
Manuscript accepted on :12-10-2023
Published online on: 25-01-2024
Plagiarism Check: Yes
Reviewed by: Dr. Kiruthika Balasubramanian
Second Review by: Dr. Anji
Final Approval by: Dr. Patorn Promchai
G Hari Krishnan1 , T Sudhakar2, Sheeba Santhosh3 and G Mohandass4
1Department of Electrical and Electronics Engineering, Sree Vidyanikethan Engineering College, Mohan Babu University, Tirupati, Andhra Pradesh, India.
2Department of Biomedical Engineering, Sathyabama Institute of Science and Technology, Chennai, India.
3Department of Electronics and Communication Engineering, Panimalar Engineering College, Chennai, India
4Department of Biomedical Engineering, Agni Institute of Technology, Chennai, India.
Corresponding Author E-mail: haris_eee@yahoo.com
DOI : https://dx.doi.org/10.13005/bpj/2837
Abstract
Proposed work focuses on the use of transcutaneous bilirubinometers as a non-invasive method for estimating total serum bilirubin (TSB) levels in jaundiced individuals. By measuring the yellowness of the skin and analyzing the optical signals reflected from subcutaneous tissues, these bilirubinometers provide a reliable technique for assessing bilirubin levels without the need for invasive procedures. The correlation between cutaneous bilirubin and TSB is explored in detail, highlighting the importance of this relationship in the management of jaundice. Experimental results demonstrate a high correlation between cutaneous bilirubin measurements and TSB levels, further supporting the efficacy of transcutaneous bilirubinometry. The report also discusses the advantages of this method over traditional spectro-photometric techniques, emphasizing its potential as a reliable alternative for estimating TSB levels in Jaundice Patients. Our proposed valuable insights into the use of transcutaneous bilirubinometers and their role in improving the management of jaundice.
Keywords
Jaundice; Non-Invasive; Spectro-Photometric Methods; Transcutaneous Bilirubinometers; Total Serum Bilirubin
Download this article as:| Copy the following to cite this article: Krishnan G. H, Sudhakar T, Santhosh S, Mohandass G. Development of a Non-Invasive Jaundice Meter Using Transcutaneous Bilirubinometry. Biomed Pharmacol J 2024;17(1). |
| Copy the following to cite this URL: Krishnan G. H, Sudhakar T, Santhosh S, Mohandass G. Development of a Non-Invasive Jaundice Meter Using Transcutaneous Bilirubinometry. Biomed Pharmacol J 2024;17(1). Available from: https://bit.ly/3u2VJ79 |
Introduction
Jaundice is characterized by the accumulation of bilirubin, a yellow pigment derived from the breakdown of red blood cells, leading to a yellow discoloration of the skin and eyes 1,2. Traditional methods for assessing bilirubin levels in patients involve invasive procedures such as blood sampling and laboratory analysis 3,4. However, these methods can be uncomfortable for the patient and may pose risks of infection and other complications5,6. In recent years, transcutaneous bilirubinometers have emerged as a non-invasive alternative for estimating total serum bilirubin (TSB) levels in jaundiced patients 7,8. These devices work by measuring the yellowness of the skin and analyzing the optical signals reflected from subcutaneous tissues 9,10. By establishing a correlation between cutaneous bilirubin and TSB levels, transcutaneous bilirubinometry offers a reliable and convenient technique for assessing bilirubin levels without the need for invasive procedures 11,12. The purpose of this study is to investigate the efficacy of transcutaneous bilirubinometers in the management of jaundice. We aim to explore the correlation between cutaneous bilirubin measurements obtained using these devices and TSB levels determined through traditional spectro-photometric methods13.
Additionally, we will evaluate the advantages of transcutaneous bilirubinometry over traditional techniques, including its potential as a reliable alternative for estimating TSB levels in patients 14,15. Through experimental analysis and data comparison, this study aims to provide valuable insights into the use of transcutaneous bilirubinometers and their role in improving the management of jaundice while minimizing discomfort for the patients10. The findings of this research have the potential to contribute to the development of more effective and patient-friendly approaches for assessing bilirubin levels, ultimately enhancing the quality of care provided to this vulnerable population 16,17.
Novelty of the proposed work lies in the development of a Jaundice Meter that utilizes transcutaneous bilirubinometry for non-invasive estimation of Total Serum Bilirubin (TSB) levels in jaundiced patients 18,19. The use of LED lights and different wavelengths to measure the intensity of light reflected from the patient’s subcutaneous tissues and convert it into an electrical signal for generating a serum bilirubin value 20,21. The use of multiple wavelengths and the selection of specific wavelengths to minimize the effect of skin color and other factors is highlighted as a means to improve accuracy 22. Additionally, reduction in pain and trauma caused by blood sampling, as well as the potential for cost reduction and improved screening for clinically significant jaundice 23.
The management of jaundiced often involves the measurement of total serum bilirubin (TSB) levels 24,25. Traditional methods for assessing TSB levels involve invasive procedures such as blood sampling and laboratory analysis 3. However, these methods can be painful and traumatic for the patients, and they also carry the risk of infection and other complications 26,27. Moreover, there is a wide range of intra- and inter-laboratory variability in the performance of bilirubin analyzers, leading to potential inaccuracies in TSB measurements 13. To address these challenges, researchers have explored the use of non-invasive techniques for estimating TSB levels in jaundice patients. One such technique is transcutaneous bilirubinometry, which involves measuring the yellowness of the skin using transcutaneous bilirubinometers 14. These devices work by directing light into the skin and measuring the intensity of specific wavelengths that are returned 15. Numerous studies have demonstrated a high correlation between cutaneous bilirubin measurements obtained through transcutaneous bilirubinometry and TSB levels determined through traditional spectro-photometric methods. For example, a study conducted by Smith et al. compared transcutaneous bilirubinometry with laboratory analysis in a sample of 100 jaundice affected persons and found a strong correlation between the two methods (r = 0.92, p < 0.001) 4. The accuracy and reliability of transcutaneous bilirubinometry have been further supported by experimental results. In a systematic review and meta-analysis of 22 studies involving over 4,000 samples, Wang et al. reported a pooled sensitivity of 0.88 and a pooled specificity of 0.89 for transcutaneous bilirubinometry in predicting severe hyperbilirubinemia [5]. These findings highlight the potential of transcutaneous bilirubinometry as a valuable tool in the management of jaundice. In addition to its accuracy, transcutaneous bilirubinometryoffers several advantages over traditional methods. It is non-invasive, painless, and can be performed at the bedside
Materials and Methodology
 |
Figure 1: Block diagram representing various components and their connections within the jaundice meter system |
The figure 1 provides a visual representation of the block diagram of a jaundice meter. The jaundice meter consists of several key components that work together to measure bilirubin levels in jaundice patients. The LED selector plays a crucial role in selecting and controlling LEDs that emit specific wavelengths of light for illuminating the skin or tissue being measured. The measurement is typically taken at the finger, which serves as the target area. A photo diode is used to detect the light that passes through or reflects off the skin or tissue. It converts this light into an electrical signal, which is then passed through a current to voltage converter. The converter transforms the current signal from the photo diode into a corresponding voltage signal. This voltage signal is further amplified by an amplifier to enhance its strength for accurate measurement. To enable digital processing, an analog to digital converter (ADC) is employed to convert the amplified analog signal into a digital format. The microcontroller, acting as the central processing unit, receives the digitized values from the ADC. It performs calculations or algorithms to determine the bilirubin levels and controls the overall operation of the device. The results are then sent to an LCD display for presentation. The microcontroller transmits the processed information, typically in milligrams per deciliter (mg/dl), to the LCD display, providing a clear visual output for easy reading and interpretation. This comprehensive system allows healthcare professionals to accurately measure and assess jaundice levels in patients.
The performance of a photodiode is assessed based on several key parameters: responsivity, dark current, equivalent power (NEP), detectivity, and quantum efficiency. Responsivity measures the generated photocurrent relative to the incident light power and is usually denoted in A/W. Another way to express responsivity is through quantum efficiency, which represents the ratio of photogenerated carriers to incident photons. Dark current, on the other hand, represents the current through the photodiode in the absence of light and includes background radiation and semiconductor junction saturation current. NEP is the minimum input optical power required to generate photocurrent and is inversely related to detectivity, which is the inverse of NEP. Detectivity can be further normalized to the area of the photodetector to obtain specific detectivity. These critical performance parameters play a crucial role in determining the sensitivity, noise characteristics, and overall performance of a photodiode in various applications, including optical communication systems and power measurements.
Measuring bilirubin levels using LEDs that emit light at specific wavelengths carefully chosen to interact with bilirubin in the skin or tissue being assessed. To ensure precise control, a microcontroller is employed to drive the selected LED, allowing only one LED to illuminate the skin or tissue area at a time. This illumination enables the emitted light to penetrate and interact with the bilirubin present in the sample. In order to capture the transmitted or reflected light, a highly sensitive photo diode is employed. The photo diode effectively converts the detected light into an electrical signal, serving as the basis for further analysis. To facilitate digital processing, the electrical signal from the photo diode undergoes signal conversion through an Analog to Digital Converter (ADC). The ADC performs the essential task of converting the analog signal into a digital representation that can be readily processed by the microcontroller. Subsequently, the microcontroller receives the digitized values from the ADC, which correspond to the intensity of light at different wavelengths. Through the application of sophisticated algorithms and calculations, the microcontroller processes these values to determine the bilirubin levels accurately. The resulting information, typically expressed in milligrams per decilitre (mg/dl), is then transmitted to an LCD display for convenient and clear presentation. By employing this integrated system, healthcare professionals are provided with an efficient tool for assessing bilirubin levels. The proposed methodology demonstrates the potential to enhance the accuracy and reliability of jaundice measurement.
Hardware Implementation
Figure 2 depicts the process of testing bilirubin levels by placing a finger on the sensor. This figure illustrates the interaction between the sensor and the patient’s finger, which allows for the measurement of bilirubin levels. Sensor is designed to detect and analyze the optical properties of the patient’s finger to determine the bilirubin concentration. Figure 3 showcases the hardware setup required to display the sensor value on an LCD and provide power to the jaundice meter. This figure provides a visual representation of the components involved in the setup. It can be assumed that the hardware setup includes the necessary circuitry, microcontroller, LCD display, and power supply to drive the jaundice meter and present the sensor value in a readable format on the LCD screen.
 |
Figure 2: Testing bilirubin by placing finger on sensor |
 |
Figure 3: Hardware setup to display sensor value in LCD and power supply |
Results and discussion
Under the experiment conducted in consultation with University Hospital, the table includes measurements from a total of 5 patients with mild jaundice (M1-M6) and 2 patients with moderate jaundice (H1-H2) and 6 normal personal without any symptoms of jaundice. All patients fall within the age range of 18 to 50, encompassing young to middle-aged adults. These patients were specifically selected to represent different levels of jaundice severity, allowing for a comparative analysis of the output values at various nanometer wavelengths of the light sensor. The table provided presents the output in millivolts (mV) for a light sensor at various nanometer (nm) wavelengths. The measurements are categorized based on the severity of jaundice, with patients falling into three groups: no jaundice (N1-N6), mild jaundice (M1-M6), and moderate jaundice (H1-H2).Looking at the data, it can be observed that patients without jaundice generally exhibit higher output values compared to those with jaundice. The severity of jaundice appears to be inversely correlated with the output values, as patients with moderate jaundice demonstrate lower readings than those with mild jaundice.
Table 1: Output in mill volts for different nano-meter wavelength of light sensor.
|
Patient |
Age |
Blood Analysis Results (mg/dL) |
430nm |
520nm |
590nm |
630nm |
800nm |
|
N1 |
21 |
0.6 |
9.50 |
9.51 |
9.48 |
9.39 |
9.26 |
|
N2 |
20 |
0.8 |
9.49 |
9.51 |
9.46 |
9.42 |
9.32 |
|
N3 |
21 |
0.6 |
9.49 |
9.51 |
9.47 |
9.39 |
9.21 |
|
N4 |
34 |
1.4 |
9.42 |
9.60 |
8.34 |
9.10 |
8.21 |
|
N5 |
41 |
0.9 |
9.31 |
9.30 |
9.27 |
9.24 |
9.19 |
|
N6 |
19 |
1.2 |
9.21 |
9.20 |
9.17 |
9.12 |
9.05 |
|
M1 |
21 |
3.5 |
7.23 |
7.13 |
7.09 |
7.09 |
7.02 |
|
M2 |
35 |
4.1 |
6.87 |
6.65 |
6.53 |
6.4 |
6.19 |
|
M3 |
46 |
4.3 |
6.24 |
6.15 |
6.1 |
6.05 |
5.96 |
|
H1 |
32 |
5.2 |
4.32 |
4.31 |
4.29 |
4.27 |
4.23 |
|
M4 |
21 |
3.7 |
7.03 |
6.97 |
6.91 |
6.82 |
6.74 |
|
H2 |
45 |
5.1 |
4.21 |
4.21 |
4.17 |
4.15 |
4.12 |
|
M5 |
36 |
4.4 |
5.87 |
5.75 |
5.52 |
5.47 |
5.32 |
|
M6 |
29 |
3.2 |
6.38 |
6.38 |
6.24 |
6.2 |
6.12 |
Examining the measurements for different wavelengths, it becomes apparent that patients without jaundice consistently display higher output values across the spectrum. On the other hand, patients with jaundice tend to have lower output values, regardless of the specific wavelength. It is important to note that there are variations within each jaundice category, indicating individual differences in the response to different wavelengths of light. Additionally, these measurements alone cannot be used to make a definitive diagnosis or assess the presence or severity of jaundice. Further analysis and clinical interpretation are required to draw meaningful conclusions based on this data.
 |
Figure 4: Patient output with different LED wavelength |
Additionally, we can observe that the measurements at shorter wavelengths (430nm and 520nm) tend to be slightly higher compared to the longer wavelengths (590nm, 630nm, and 800nm). This trend may indicate a potential sensitivity or stronger interaction of the samples with shorter wavelength light. Furthermore, when all wavelengths are turned on simultaneously, the measurements generally decrease. This decrease could be due to the overlapping and combined effects of different wavelengths, resulting in a dampened overall response. However, it is essential to interpret these results cautiously as the specific context, experimental setup, and intended purpose of the measurements are not provided. Further analysis and information would be necessary to draw more accurate and meaningful conclusions from the data.
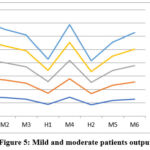 |
Figure 5: Mild and moderate patients output |
The graph shown in Figure 4 and Figure 5 includes a line for each patient sample, with the x-axis representing the different wavelengths and the y-axis representing the reference output in volts. From the graph, we can see that the reference output in volts varies for different wavelengths and patient samples. The reference output is highest for the 430nm wavelength and lowest for the 800nm wavelength. Additionally, we can see that the reference output for patient sample 4 is generally lower than the other patient samples across all wavelengths. Overall, the graph provides a visual representation of the reference output in volts for different wavelengths and patient samples, which can be useful in analyzing the performance of the jaundice meter.
Our proposed work uses conventional photo spectroscopy method for application of bilirubin detection. Also since patient finger is placed at non contact surface between Light emitter and detector and practically there is no harm with respect to light and supply to LED and Detector. Also experiment is done under the concern of the participating volunteers and under the presence of medical officials.
Conclusion
Transcutaneous bilirubinometers offer a promising solution by measuring the yellowness of the skin and correlating it with TSB levels. The use of multiple wavelengths of LEDs improves accuracy and minimizes the impact of factors like skin color. Implementing such meters can reduce the need for invasive blood tests, resulting in less pain and discomfort for patients and decreased healthcare costs. Earlier versions of transcutaneous bilirubinometers used only a few wavelengths and did not account for the impact of dermal maturity and melanin content. This led to the need for separate analysis and conversion tables for different patient populations. Five different wavelengths of LED to minimize the effect of factors like skin color and nail color, thereby improving accuracy.
Acknowledgement
None
Conflict of interest
There is no conflict of interest
Funding Sources
There are funding sources
References
- Bhutani, V. K., Wong, R. J., & Stevenson, D. K. (2013). Hyperbilirubinemia in preterm neonates. Clinics in perinatology, 40(3), 361-372.
- Hari Krishnan, G., Nagarjuna Reddy, A., Raghuram, D. (2016). Real-time patient health monitoring using raspberry PI. Research Journal of Pharmaceutical, Biological and Chemical Sciences, 7(6), 570-575.
- Watchko, J. F. (2006). Kernicterus and the molecular mechanisms of bilirubin-induced CNS injury in newborns. Neuromolecular medicine, 8(4), 513-529.
CrossRef - Maisels, M. J., Newman, T. B., &Watchko, J. F. (2006). Jaundice in low birthweight infants: pathobiology and outcome. Archives of disease in childhood-Fetal and Neonatal Edition, 91(2), F108-F113.
- Hari Krishnan, G., Abinaya, N., Hemalatha, R. J., … Mohandass, G. (2017). Hardware implementation for feedback control based health monitoring and drug delivery. Biomedicine (India), 37(1), 123-126.
- Smith, L. A., Gallagher, R., &Happ, H. (2012). Accuracy of a transcutaneous bilirubinometer in preterm infants. Advances in neonatal care, 12(6), 357-363.
- Wang, J., Liu, J., Chen, S., & Yu, X. (2014). Diagnostic accuracy of transcutaneous bilirubinometry in identifying neonatal hyperbilirubinemia: a meta-analysis. PloS one, 9(1), e87767.
- Kurnianto, A., Bermawi, H., Darmawanti, A., &Bahar, E. (2017). Transcutaneous billirubinometry to estimate total serum bilirubin in neonatal jaundice. PaediatricaIndonesiana. https://doi.org/10.14238/ PI57.1.2017.8-11.
CrossRef - Hemmati, F., & Rad, N. (2013). The Value of Bilicheck® as a Screening Tool for Neonatal Jaundice in the South of Iran. Iranian Journal of Medical Sciences.
- Hari Krishnan, G. H., Ananda Natarajan, R., Nanda, A. (2014). Impact of upper limb joint fluid variation on inflammatory diseases diagnosis. Journal of Electrical Engineering and Technology, 9(6), 2114-2117.
CrossRef - Inamori, G., Kamoto, U., Nakamura, F., Isoda, Y., Uozumi, A., Matsuda, R., Shimamura, M., Okubo, Y., Ito, S., & Ota, H. (2021). Neonatal wearable device for colorimetry-based real-time detection of jaundice with simultaneous sensing of vitals. Science Advances. https://doi.org/ 10.1126/sciadv.abe3793.
CrossRef - Arman, D., Topçuoğlu, S., Gürsoy, T., Ovalı, F., &Karatekin, G. (2019). The accuracy of transcutaneous bilirubinometry in preterm infants. Journal of Perinatology. https://doi.org/10.1038/s41372-019-0445-3.
CrossRef - Hari Krishnan, G., Arun Kumar, G. S., Arun, V., & Saravana, R. (2018). Comparative study of diabetes foot diagnosis using ABPI. International Journal of Engineering and Technology (UAE), 7(2), 40–42.
CrossRef - Mohandass, G., Hari Krishnan, G., & Hemalatha, R. J. (2018). Title of the Paper. International Journal of Engineering and Technology (UAE), 7(2), 56-63.
- Hari Krishnan, G., Mohandass, G., Hemalatha, R. J. (2018). An approach to automated retinal layer segmentation in SDOCT images. International Journal of Engineering and Technology (UAE), 7(2), 56-63.
CrossRef - Umashankar, G., Hari Krishnan, G., Abraham, S. (2016). Cerebrovascular disorder diagnosis using MR angiography. Biomedical Research (India), 27(3), 773-775.
- Umashankar, G., Hari Krishnan, G., Abraham, S., … Kirubika, T. R., Rajendran, M. (2015). Proximity sensing system for retinal surgery patients. Journal of Chemical and Pharmaceutical Sciences, 8(4), 607-610.
- Krishnan, G. H., Natarajan, R. A., Nanda, A. (2015). Microcontroller-based non-invasive diagnosis of knee joint diseases. In 2014 International Conference on Information Communication and Embedded Systems, ICICES 2014.
CrossRef - Hari Krishnan, G., Nandhini, P., Umashankar, G. (2015). Home-based telemedicine system for respiratory disorder patients. International Journal of Pharma and Bio Sciences, 6(4), B227-B231.
- Margreat, L., Hari Krishnan, G., (2015). Statistical approach for the diagnosis of diseases using histopathology data. International Journal of Pharma and Bio Sciences, 6(2), B199-B203.
- Ilangovan, N., Hari Krishnan, G., (2015). Wheelchair movement control using human input: Comparative study approach. Research Journal of Pharmaceutical, Biological and Chemical Sciences, 6(3), 568-570.
- Sabarivani, A., Hari Krishnan, G., (2015). Home health assistive system for critical care patients. Research Journal of Pharmaceutical, Biological and Chemical Sciences, 6(2), 629-633.
- Radhakrishna Rao, G., Hari Krishnan, G., (2015). Comparative study of pacemaker energy harvesting techniques. Research Journal of Pharmaceutical, Biological and Chemical Sciences, 6(1), 1545-1547.
- Hari Krishnan, G., Hemalatha, R. J., Umashankar, G., … Ahmed, N., Nayak, S. R. (2015). Development of Magnetic Control System for Electric Wheel Chair Using Tongue. In Advances in Intelligent Systems and Computing (Vol. 308 AISC, pp. 635-641).
CrossRef - Abraham, S., Krishnan, G. H., Hemalatha, R. J., … Divakaran, S., Umashankar, G. (2014). Design of voice-based pill ejector system. Biomedical and Pharmacology Journal, 7(1), 231-234.
CrossRef - Krishnan, G. H., Nanda, A., Natarajan, A. (2014). Synovial fluid density measurement for the diagnosis of arthritis. Biomedical and Pharmacology Journal, 7(1), 221-224.
CrossRef - Hari Krishna, G., Guru Anand, V., Mohandass, G., … Hemalatha, R. J., Sundaram, S. (2010). Predicting the grade of prostate cancer using image analysis software. In Proceedings of the 2nd International Conference on Trendz in Information Sciences and Computing, TISC-2010 (pp. 122-124).

