
Manuscript accepted on :20-01-2023
Published online on: 18-10-2023
Plagiarism Check: Yes
Reviewed by: Dr. Dasari, Rajaneekar
Second Review by: Dr. Ilya Nikolaevich Medvedev
Final Approval by: Dr. Ian James Martin
Rajesh Patil* and Surendra Bhosale
Electrical Engineering Department, VJTI, Mumbai, India.
Corresponding Author E-mail: rapatil@el.vjti.ac.in
DOI : https://dx.doi.org/10.13005/bpj/2803
Abstract
In medical image processing Noise removal is an important step for recreating a high-quality image like X-ray, ultrasound, MRI etc. While acquiring, transmitting, and retrieving from storage devices normally images are degraded due to noises like Gaussian, Speckle etc. So, noise must be removed from the images for proper diagnosis. Researchers are still looking for an effective noise reduction means. Wavelet Transform (WT) is considered as a powerful transform method for removal of noise. For denoising of medical images affected by Gaussian noise, various wavelets have been proposed. In this paper, various wavelets are used to study the denoising multi-modal medical images affected by Gaussian noise. Here, proposed wavelet gives better results than the wavelets which have been implemented so far now. Denoising results of medical images are compared on the basis of Root Mean Square Error (RMSE), Signal-Noise Ratio (SNR), Peak Signal-Noise Ratio (PSNR) and execution time (TE).
Keywords
CT – Scan; Medical Image Denoising; MRI; Wavelet Transform (WT); Ultrasound; X-ray
Download this article as:| Copy the following to cite this article: Patil R, Bhosale S. Multi-Modal Medical Image Denoising using Wavelets: A Comparative Study. Biomed Pharmacol J 2023;16(4). |
| Copy the following to cite this URL: Patil R, Bhosale S. Multi-Modal Medical Image Denoising using Wavelets: A Comparative Study. Biomed Pharmacol J 2023;16(4). Available from: https://bit.ly/3ZXxzX7 |
Introduction
Medical imaging is an imaging of various body parts. It includes radiology, thermograph, endoscope, medical photography, and microscopy. 1 It plays a main part for diagnosis, research related findings etc. These images are generally get noisy while acquisition and transmission of the images. Various factors like various noises, disruption due to blood movement, blood flow, body fat and breathing motion etc. are responsible for distortion and corruption of medical images. So it is very essential to denoise the image for enhancing the image class. Researchers are still looking for an effective image denoising means. 2 To remove noise from image is a repairing process. By using prior information of the degradation process, efforts are made to recover an image that gets corrupted. 3 Various noise like Gaussian noise, Impulse noise, periodic noise etc. affect medical images. There are mainly four denoising methods which are available in literature. These denoising approaches are (i) filtering method, (ii) transform domain method iii) statistical method and iv) Machine Learning (ML) Methods. Filtering approach denoise the images by using filter directly on corrupted image. In transform-domain filtering like Fourier Transform and Wavelet Transform convert the spatial realm data to the frequency realm. And filtering operations are executed in frequency realm. In Statistical Approach, images are generally modelled with the help of a Rician distribution. Here, noise variance is an essential factor in noise removal. In machine learning approach, computer algorithms which have the property of self-learning and enhance itself repeatedly through training and by the use of data are used for denoising. 4 Every approach or method for denoising has its own assumptions, merits and demerits.
Discrete Wavelet Transform (DWT)
It is a transform domain method. Other transform techniques are Fourier Transform (FT), Wavelet transform (WT), Curvelet transform (CT) etc. The Discrete Wavelet Transform (DWT) of image gives a non-redundant data. It gives enhanced spatial and spectral localization of image construction. Here, original image is given to two complementary filters which provides two signals, approximation and details. It is disintegration or investigation of image. The data can be reconstructed back into the original image without losing details. This is reconstruction or synthesis process of image. This mathematical process of analysis and synthesis, is discrete wavelet transform and inverse discrete wavelet transform. Using DWT, an image can be decomposed into a series of images having different spatial resolution. In 2D image, an N level decomposition is executed which gives 3N+1 different frequency bands. Here, the Gaussian noise will almost average out in low frequency wavelet coefficients. While in the high frequency levels, wavelet coefficients can be threshold. 5
 |
Figure 1: 2D-DWT with 3-Level decomposition |
Performance Evaluation in Image Denoising
Subjective method and objective method are two types of techniques for image quality assessment (IQA). In subjective method, image quality is decided by the human beings. And to measure the image quality, it is considered as the most correct and reliable method. But, this process is very sluggish, difficult and expensive for implementation. So, the objective image quality metrics which automatically calculate the image quality is quite convenient. The purpose of IQA is to calculate the image quality which should be very close to the subjective assessment. So, the second method is preferred. It includes mathematically defined measuring parameters like Mean Square Error (MSE), Root Mean Square Error (RMSE) and Peak Signal-Noise Ratio (PSNR). 4 Under objective method, Root Mean Square Error (RMSE) is frequently used. For image quality measurement, it is considered as a highly reliable. Mathematically: let the actual image, noisy image and the denoised image be denoted by i(x,y), n(x,y) and i’(x,y) respectively. And, the discrete spatial coordinates of the images are represented by x and y. Assume the size of image be MxN pixels i.e., x = 1, 2 …, M and y = 1, 2 …., N. Then, the MSE and RMSE can be defined as
Second image quality measurement parameter is Peak Signal to Noise ratio (PSNR). PSNR is inversely proportional to RMSE and its unit is in db (decibels). It is defined as the ratio of Peak Signal Power to Noise Power. It is mathematically defined by

here 255 is the Maximum Pixel Value for an 8 bits/gray-scale image.
It compares the quality of reconstructed image and the original image. It gives a single number which indicates the class of new image. Denoised images having lesser MSE and greater PSNR are considered superior.
Execution time (ET) is defined as the time taken by a digital computing platform to execute the filtering algorithm when no other software, except the operating system (OS), runs on it. Lesser is the time, better is the measuring parameter. 4,6,7,8
Literature Review
Various wavelets for image denoising have been proposed by researchers. Nadir Mustafa et al. 9 proposed bi-orthogonal wavelet which is found to be more effective method than other wavelet families such as Haar, Daubechies, and Symlets. It gave better mean square error (MSE) in soft and hard threshold. Sugandha Agarwal et al. 2 based on the statistical measures and visual quality of MRI image proposed Symlet based Wavelet Transform which outperformed other wavelet transforms. In this paper, the efficiency of various wavelet family i.e. Haar, Morlet, Symlet, Daubechies were used for denoising the speckle noise from MRI of brain image. According to R. Sujitha et al. 10 the haar wavelet (db1) gave the best results as compare to other wavelets for Simulated & MRI image. S.Kother Mohideen et al. 5 mentioned wavelet coiflet for better image denoising. As per Ajeet Singh 11, the best PSNR is obtained at the decomposition level of two.
Wavelets
Wavelets are generally categorized into three parts: continuous, discrete, and multiresolution-based. In continuous wavelet transform (CWT), a given finite energy signal is projected on a continuous family of frequency bands. Discrete Wavelet Transform (DWT) is one more form of representation of the signal. It does not vary the data. It is a sampled form of the CWT. The reconstructed data contains high redundancy. DWT is more effective in removing redundancy than CWT. 13 The DWT decomposes the original signal into an approximation subsignal and detailed subsignals. While the Multiresolution Analysis (MRA) algorithm continue to decompose the approximation subsignal, which again gives detailed subsignals and an approximation subsignal. The choice of the decomposition level is based on the earlier size of the original data, and the requisite spectral and temporal resolution. Lastly, the original data can be reconstructed by the approximation coefficients of the last decomposition level and the accumulated detailed coefficients of all decomposition levels. 14 In this paper, wavelets like Harr, db4, sym4, bior6.8 and dmey which were proposed and studied by the researchers are used for denoising.
Harr wavelet
Harr wavelet is a square-shaped function which can be rescaled. Its mother wavelet function {\displaystyle \psi (t)}x(t) can be described as:
x(t) = 1, 0 ≤ t <0.5
= -1, 0.5 ≤ t < 1
= 0, otherwise
Daubechies (db4) wavelet
Ingrid Daubechies did the basic research work for this wavelet. These are orthogonal wavelet group. DWT is defined by db4 wavelets. Each wavelet is having scaling factor (named as the father wavelet) which gives an orthogonal multiresolution analysis.
Symlet (sym4) wavelet
Daubechies’ least-asymmetric wavelets are also known as symN wavelets. These wavelets are more symmetric. In symN, N is the number of vanishing moments.
Biorthogonal (bior6.8) wavelet
These wavelets have two functions: one is scaling functions and another is related to scaling filters. One function is for analysis while another function is for synthesis. They can have dissimilar numbers of vanishing moments and regularity characteristics.
Meyer (dmey) wavelet
The Meyer wavelet is a frequency-band-limited orthogonal wavelet. In 1985, it was suggested by Yves Meyer. They are indeterminately differentiable orthonormal wavelets. It is quite localized and decline from their central peak. The Meyer wavelet’s discrete format approximation is dmey wavelet.12
Methodology
De-noising algorithms which uses the wavelet transform comprise of three steps.
To find the wavelet transform of the noisy signal.
To change the noisy wavelet coefficients as per prerequisite regulation.
To find the inverse transform using the changed coefficients.
In this study, Wavelet Transform (WT) is used for denoising the medical image corrupted by Gaussian noise. Here, medical image is taken as an input. The Gaussian noise is generated randomly and added to the medical image. And then, WT is applied. The decomposition level used in this study is 2 and different wavelets are used.
Steps used in the study:
Step 1 – Take a medical image
Step 2 – Add Gaussian noise
Step 3- Take the wavelet transforms of noisy image using different wavelets.
Step 4 – Change the noisy wavelet coefficients as per the requirement.
Step 5 – Take inverse wavelet transform of changed wavelet coefficients.
Step 6 – Find the PSNR, SNR and MSE of denoised output image. Also find ET.
Experimental Setup
Programming language used for coding is MATLAB 2020B. A standard MRI of brain, chest X-ray, CT image, Ultrasound image of ovary and retina image of right are used for study of denoising medical images as shown in Fig. 1(a), Fig. 2(a), Fig. 3(a), Fig. 4(a) and Fig. 5(a) respectively. Gaussian noise having noise variance of 0.05 and 0.09 was introduced in the medical image. Wavelet transform was performed using 5 different wavelets like Harr, db4, sym4, bior6.8 and dmey. The above process is repeated 3 times for different noise variance and each time SNR, PSNR, RMSE and execution time (ET) were calculated.
Results and Discussion
Table 1-3 displays the denoising parameters in terms of SNR, PSNR, RMSE and execution time for different wavelets. Fig. 2 (a-d), Fig. 3 (a-d), Fig. 4 (a-d), Fig. 5 (a-d) and Fig. 6 (a-d) show the pictures of various types of original medical images, noisy and denoised image. Multi-modal medical images were denoised using different wavelets. In original multi-modal medical images Gaussian noise having 0.05 and 0.09 were introduced. And these images were denoised using DWT with the help of 5 different types of wavelets. It can be seen from the denoised images obtained that the denoising parameters vary with different wavelets. For all noise variance dmey wavelet reduces more noise in medical image and gives better SNR, PSNR and RMSE. Similar results are obtained for other medical images MRI, X-ray, CT, Ultrasound and retinal image. But, execution time of dmey wavelet is more as compare to other wavelets.
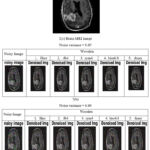 |
Figure 2: (a-c). MRI Denoised Images by various wavelets |
Table 1: (A-B): Impact of wavelets on noise parameters for MRI
Table 1(A): Noise – Gaussian, Noise variance = 0.05
|
Sr No. |
Denoising parameters |
Noisy Img parameters |
Wavelets |
||||
|
1. Harr |
2. db4 |
3. sym4 |
4. bior6.8 |
5. dmey |
|||
|
1 |
SNR |
4.0437 |
7.9324 |
8.3532 |
8.4618 |
8.3467 |
8.6454 |
|
2 |
PSNR |
15.0559 |
20.8025 |
21.1497 |
21.2693 |
21.0797 |
21.5160 |
|
3 |
RMSE |
2029.9907 |
540.5470 |
499.0087 |
485.4548 |
507.1149 |
458.6440 |
|
4 |
ET |
– |
0.41398 |
0.28123 |
0.28123 |
0.28114 |
0.35632 |
Table 1(B): Noise – Gaussian, Noise variance = 0.09
|
Sr No. |
Denoising parameters |
Noisy Img parameters |
Wavelets |
||||
|
1. Harr |
2. db4 |
3. sym4 |
4. bior6.8 |
5. dmey |
|||
|
1 |
SNR |
2.9341 |
6.4510 |
6.7814 |
6.8106 |
6.6776 |
6.9646 |
|
2 |
PSNR |
12.7990 |
18.8227 |
19.0594 |
19.1279 |
18.8505 |
19.3417 |
|
3 |
RMSE |
3413.3158 |
852.7227 |
807.4905 |
794.858 |
847.2929 |
756.6783 |
|
4 |
ET |
– |
0.77915 |
0.61345 |
0.59719 |
0.39631 |
0.41275 |
 |
Figure 3: (a-c) X-ray Denoised Images by various wavelets |
Table 2(A-B): Impact of wavelets on noise parametersfor X-ray Images
Table 2(A): Noise – Gaussian, Noise variance = 0.05
|
Sr No. |
Parameters |
Noisy Img |
Wavelets used for Denoising |
||||
|
1. Harr |
2. db4 |
3. sym4 |
4. bior6.8 |
5. dmey |
|||
|
1 |
SNR |
9.3853 |
19.1203 |
19.4645 |
19.4237 |
19.0484 |
19.5193 |
|
2 |
PSNR |
13.7855 |
24.0645 |
24.4097 |
24.3636 |
23.9780 |
24.4668 |
|
3 |
RMSE |
2719.7337 |
255.0541 |
235.5623 |
238.0782 |
260.1845 |
232.4894 |
|
4 |
ET |
– |
0.36336 |
0.4189 |
0.38673 |
0.41855 |
0.5505 |
Table 2(B): Noise – Gaussian, Noise variance = 0.09.
|
Sr No. |
Parameters |
Noisy Img |
Wavelets used for Denoising |
||||
|
1. Harr |
2. db4 |
3. sym4 |
4. bior6.8 |
5. dmey |
|||
|
1 |
SNR |
7.5677 |
16.9453 |
17.1583 |
17.1124 |
16.7643 |
17.1952 |
|
2 |
PSNR |
11.7936 |
22.0125 |
22.2171 |
22.1761 |
21.8061 |
22.2647 |
|
3 |
RMSE |
4302.4759 |
409.1013 |
390.2775 |
393.9790 |
429.0143 |
386.0212 |
|
4 |
ET |
– |
0.2636 |
0.31234 |
0.28042 |
0.32132 |
0.35584 |
 |
Figure 4: (a-c). CT Denoised Images by various wavelets |
Table 3(A-B): Impact of wavelets on noise parametersfor CT Images
Table 3(A): Noise – Gaussian, Noise variance = 0.05
|
Sr No. |
Parameters |
Noisy Img |
Wavelets used for Denoising |
||||
|
1. Harr |
2. db4 |
3. sym4 |
4. bior6.8 |
5. dmey |
|||
|
1 |
SNR |
9.1962 |
15.3155 |
16.0597 |
16.0784 |
16.2372 |
16.4595 |
|
2 |
PSNR |
14.4796 |
21.1647 |
21.8846 |
21.9034 |
22.0605 |
22.3032 |
|
3 |
RMSE |
2318.0148 |
497.2923 |
421.3312 |
419.5055 |
404.6026 |
382.6146 |
|
4 |
ET |
– |
0.62455 |
0.48287 |
0.53743 |
0.54176 |
0.96824 |
Table 3(B): Noise – Gaussian, Noise variance = 0.09
|
Sr No. |
Parameters |
Noisy Img |
Wavelets used for Denoising |
||||
|
1. Harr |
2. db4 |
3. sym4 |
4. bior6.8 |
5. dmey |
|||
|
1 |
SNR |
7.3470 |
13.4375 |
13.8991 |
19.8693 |
14.0043 |
14.2971 |
|
2 |
PSNR |
12.4464 |
19.3944 |
19.8476 |
19.8693 |
19.9352 |
20.2705 |
|
3 |
RMSE |
3702.0695 |
747.5473 |
673.4656 |
670.1102 |
660.0218 |
610.9850 |
|
4 |
ET |
– |
0.43939 |
0.84431 |
0.40388 |
0.80107 |
0.97444 |
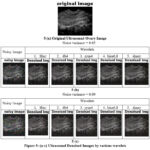 |
Figure 5: (a-c) Ultrasound Denoised Images by various wavelets |
Table 4(A-B): Impact of wavelets on noise parametersfor ultrasound Images
Table 4(A): Noise – Gaussian, Noise variance = 0.05
|
Sr No. |
Parameters |
Noisy Img |
Wavelets used for Denoising |
||||
|
1. Harr |
2. db4 |
3. sym4 |
4. bior6.8 |
5. dmey |
|||
|
1 |
SNR |
4.5936 |
10.7668 |
11.2147 |
11.2146 |
10.7295 |
11.3593 |
|
2 |
PSNR |
14.6838 |
22.5272 |
22.9535 |
22.9629 |
22.4096 |
23.1100 |
|
3 |
RMSE |
2211.5762 |
363.3780 |
329.4073 |
328.6930 |
373.3553 |
317.7486 |
|
4 |
ET |
– |
0.47157 |
0.4751 |
0.56423 |
0.61324 |
0.80855 |
Table 4(B): Noise – Gaussian, Noise variance = 0.09
|
Sr No. |
Parameters |
Noisy Img |
Wavelets used for Denoising |
||||
|
1. Harr |
2. db4 |
3. sym4 |
4. bior6.8 |
5. dmey |
|||
|
1 |
SNR |
3.4562 |
8.9853 |
9.2309 |
9.2561 |
8.8204 |
9.3208 |
|
2 |
PSNR |
12.5075 |
20.3061 |
20.5466 |
20.5669 |
20.0463 |
20.6487 |
|
3 |
RMSE |
3650.3444 |
605.9993 |
573.3477 |
570.6795 |
643.3523 |
560.0318 |
|
4 |
ET |
– |
0.5723 |
1.4247 |
0.57397 |
0.48878 |
0.76511 |
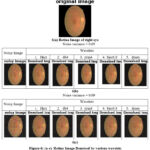 |
Figure 6: (a-c). Retina Image Denoised by various wavelets |
Table 5(A-B): Impact of wavelets on noise parametersfor Retina Image
Table 5(A): Noise – Gaussian, Noise variance = 0.05
|
Sr No. |
Parameters |
Noisy Img |
Wavelets used for Denoising |
||||
|
1. Harr |
2. db4 |
3. sym4 |
4. bior6.8 |
5. dmey |
|||
|
1 |
SNR |
6.6038 |
12.7675 |
12.8269 |
13.0170 |
12.5426 |
13.2154 |
|
2 |
PSNR |
14.6275 |
21.7209 |
21.7690 |
21.9560 |
21.4382 |
22.1894 |
|
3 |
RMSE |
2240.4053 |
437.5167 |
432.6892 |
414.4578 |
466.9343 |
392.7747 |
|
4 |
ET |
– |
0.17465 |
0.22211 |
0.17608 |
0.20391 |
0.2504 |
Table 5(B): Noise – Gaussian, Noise variance = 0.09
|
Sr No. |
Parameters |
Noisy Img |
Wavelets used for Denoising |
||||
|
1. Harr |
2. db4 |
3. sym4 |
4. bior6.8 |
5. dmey |
|||
|
1 |
SNR |
4.9742 |
10.7800 |
10.8362 |
10.9240 |
10.3908 |
11.0438 |
|
2 |
PSNR |
12.4453 |
19.6432 |
19.6716 |
19.7959 |
19.2130 |
19.9504 |
|
3 |
RMSE |
3702.9407 |
705.9231 |
701.3186 |
681.5370 |
779.4333 |
657.7212 |
|
4 |
ET |
– |
0.26397 |
0.27853 |
0.3458 |
0.31123 |
0.63357 |
Conclusion and future scope
Many diseases are diagnosed by using medical imaging methods like CT scan, X-ray, ultrasound, MRI, etc. But, noise degrades the quality of images and it becomes difficult to diagnose the disease. Here, the experimental results clearly shows for Gaussian noise the dmey wavelet gives better SNR, PSNR and RMSE than Harr, db4, sym4 and bior6.8 wavelets. But, its execution time is higher than other wavelets. Similar result is obtained for other five medical images i.e. MRI, X-ray, CT, Ultrasound and retina image studied for experimentation. So, it can be concluded that for Gaussian noise removal dmey wavelet gives better results for multi-modal medical images.
In this proposed solution, only Gaussian noise is used for analysis. Similarly, impact of other types of noises like speckle, Salt and Pepper noise etc. which also affect multi-modal medical images should be also studied and compared on the basis of SNR PSNR, RMSE and execution time.
Conflict of interest
There are no conflict of interest
Funding sources
There is no funding sources
References
- Debashis Ganguly, Srabonti Chakraborty, Maricel Balitanas, and Tai-hoon Kim,” Medical Imaging: A Review” International Conference on Security-Enriched Urban Computing and Smart Grid, SUComS 2010
CrossRef - Sugandha Agarwal, O.P. Singh and Deepak Nagaria, “Analysis and Comparison of Wavelet Transforms For Denoising MRI Image” Biomedical & Pharmacology Journal Vol. 10(2), 831-836 (2017)
CrossRef - Mohd. Ameen, Shah Aqueel Ahmed, “An Extensive Review of Medical Image Denoising Techniques”, Global Journal of Medical Research: Radiology, Diagnostic Imaging and Instrumentation, Volume 16, Issue 2 Version 1.0, 2016
- Rajesh Patil, S. J. Bhosale, “Medical Image Denoising Techniques: A Review”, International Journal on Engineering, Science and Technology, Volume 4, No 1, 2022
CrossRef - S. Kother Mohideen, Dr. S. Arumuga Perumal et al. (2008), “Image De-noising using Discrete Wavelet transform” , IJCSNS International Journal of Computer Science and Network Security, VOL.8 No.1
CrossRef - Kim-Han Thung, Paramesran Raveendran, “A Survey of Image Quality Measures” Conference Technical Postgraduates, Jan 2010
CrossRef - Barten P. G. J. (1999), “Contrast sensitivity of the human eye and its effects on image quality”, SPIE Optical Engineering Press, Bellingham, WA
CrossRef - Marta M., Grgic S. and Grgic M. (2003), “Picture quality measures in image compression systems”, Proceedings EUROCON ’03, p. 233-237
- Nadir Mustafa, Jiang Ping Li et al. (2015), “Medical Image De-Noising Schemes using Wavelet Transform with Fixed form Thresholding”, (IJACSA) International Journal of Advanced Computer Science and Applications, Vol. 6, No. 10
CrossRef - R. Sujitha, C. Christina, De Pearlin et al. (2017), “Wavelet Based Thresholding for Image Denoising in MRI Image” International Journal of Computational and Applied Mathematics. ISSN 1819-4966 Volume 12, Number 1
- Ajeet Singh (2013), “Denoising of Medical Images Using Wavelet Transform”,International Journal of Scientific & Engineering Research, Volume 4, Issue 7, July-2013
- Marwa Chafii, Jacques Palicot, Rémi Gribonval (2017), “Wavelet modulation: An alternative modulation with low energy consumption”, C. R. Physique 18 pg. 156-167
CrossRef - Kumar N, Alam K, Siddiqi A. H. Wavelet Transform for Classification of EEG Signal using SVM and ANN. Biomed Pharmacol J 2017;10(4).
CrossRef - S. Behzadpour et al., “Multiresolution wavelet analysis applied to GRACE range-rate residuals”, Geosci. Instrum. Method. Data Syst., 8, 197–207, 2019
CrossRef

