
Manuscript accepted on :15-02-2023
Published online on: 15-11-2023
Plagiarism Check: Yes
Reviewed by: Dr. Nagham Aljamali
Second Review by: Dr. Abidin Çalışkan
Final Approval by: Dr. Ayush Dogra
Triveni D. Dhamale* , Sheetal U. Bhandariand Varsha K. Harpale
Department of Electronics and Telecommunication, Pimpri Chinchwad College of Engineering, Nigdi, Savitribai Phule Pune University (SPPU), India.
Corresponding Author E-mail: trivenidhamale08@gmail.com
DOI : https://dx.doi.org/10.13005/bpj/2819
Abstract
Autism Spectrum Disorder (ASD) is a major incident neurological disorder. Medical practitioners use different diagnostic techniques such as Electroencephalogram (EEG) Analysis, Magnetic Resonance Imaging (MRI) analysis, and traditional Behavioral Analysis for ASD detection. However, diagnosis success largely depends on specialists' knowledge and remains seldom accessible to remote patients. To address this issue, recently, various machine learning (ML) approaches have been developed for ASD detection using brain MRI images. The performance of these approaches is often limited because of poor feature discrimination, inferior quality of features, high feature length, and poor correlation of features. Thus, there is a need for robust feature extraction and selection techniques to improve the performance of ASD detection. The proposed work demonstrates a fusion of three features, namely Gray Level Co-occurrence Matrix (GLCM) based holistic texture features, Local Binary Pattern (LBP) based local texture features, and Geometrical Features of the Corpus Callosum (GFCC) from brain MRI images. Further, a correlation-based feature selection technique is employed for the salient feature selection from the GLCM, LBP, and GFCC set to improve the feature quality. The effectiveness of the selected feature is evaluated using three ML classifiers such as K-Nearest neighbor (KNN), Support Vector Machine (SVM), and Classification Tree (CT). The proposed ASD detection scheme provides an accuracy of 95.86% with 10-fold cross-validation with a CT classifier. It is observed that the accuracy of the proposed system is improved by 11.32% over the recent GLCM-based ASD system. The correlation-based feature selection techniques minimize the recognition time by 34.95% over the ASD system without feature selection.
Keywords
Autism Spectrum Disorder; Classification Tree; Gray Level Co-occurrence Matrix; K-Nearest Neighbor; Local Binary Pattern; Machine Learning; Magnetic Resonance Imaging; Support Vector Machine
Download this article as:| Copy the following to cite this article: Dhamale T. D, Bhandari S. U, Harpale V. K. Fusion of Features: A Technique to Improve Autism Spectrum Disorder Detection Using Brain MRI Images. Biomed Pharmacol J 2023;16(4). |
| Copy the following to cite this URL: Dhamale T. D, Bhandari S. U, Harpale V. K. Fusion of Features: A Technique to Improve Autism Spectrum Disorder Detection Using Brain MRI Images. Biomed Pharmacol J 2023;16(4). Available from: https://bit.ly/3SCf3Sz |
Introduction
Autism Spectrum Disorder (ASD) is a neurological disorder characterized by persistent social communication impairments like difficulties in talking and interacting, limited interests, and repetitive activities that increase with time 1. According to the World Health Organization (WHO), Autism affects one out of every 160 children and can cause physical and psychological developmental problems. In the United States, the prevalence of ASD is estimated to be 1.47 percent, with an average lifetime cost of one million dollars per patient. The disorder is caused by various factors, including inheritance, brain structure, function, and environmental influences 2,3.
The symptoms of ASD usually appear in the first two years of life. Early diagnosis is expected to improve the quality of life for persons with Autism by providing timely treatment 4,5. The non-availability of defined biological tests for ASD, like other diseases such as diabetes, HIV, etc., imposes challenges for ASD detection. Also, defining and diagnosing mental health disorders is difficult due to the overlapping nature of symptoms. ASD detection is significant in analyzing the patients’ mental and physical health. ASD detection is critical as often the cause of ASD is unpredictable, and symptoms are generally neglected, which hampers the sustainable health life of the person with ASD 6.
The traditional method of diagnosing ASD is based on a psychological examination of the person’s behavior, such as a questionnaire test or a consultation 7. In recent years, various bio-signals, such as EEG, ECG, speech, and face, have significantly contributed to ASD detection. However, the performance of ASD detection techniques based on these bio-signals is highly sensitive to noise and facts due to other body organs, chronic diseases, and environmental and sociological parameters. Brain MRI or CT images are widely used over other bio-signals because of their capability to characterize the structural and functional changes in the brain region that directly correlate with the activities of the human being 8. The behavioral observation-based diagnostic process is time-consuming and reliant on specialists. It may be prone to misdiagnosis due to observer fatigue, exhaustion, a lack of expert knowledge, and aversion to the Test and consultation 9. Other than behavioral observations, brain signals like EEG and brain images like MRI are the major sources of ASD detection. Autism can cause anatomical and functional abnormalities in the brain, making it easier to recognize ASD 10. Functional MRI (fMRI) images can highlight changes in the brain’s local and regional connection patterns. In contrast, structural MRI (sMRI) images can provide volumetric and morphometric analyses to look at abnormal brain structure 11.
Analysis of brain MRI data is expected to provide valuable markers that result in a more accurate diagnosis of brain diseases. ML-based techniques have shown significant contributions in biomedical image and signal processing, such as arrhythmia classification 12,13, Tympanic Membrane classification 14, effective human-computer interfacing using biometric traits, etc. Researchers have extensively experimented with ML techniques using brain MRI image datasets for brain disorders like Autism, Alzheimer’s, etc. The ML-based ASD includes feature extraction, selection of appropriate features, and classifier for ASD and non-ASD, i.e., Typical development (TD) recognition. Various researchers have used single or two-feature extraction techniques that limit the performance of traditional ML-based ASD systems 15.
The proposed ASD detection system uses a fusion of three types of features Gray Level Co-occurrence matrix feature (GLCM), Local Binary Features (LBP), and geometrical features of the corpus callosum region (GFCC) of the brain obtained from sMRI images. The suggested ASD detection scheme uses novel hybrid feature extraction techniques to characterize the sMRI changes that occurred due to Autism. Also, researchers give very little concentration to the salient feature selection. The proposed work employs a correlation-based feature selection technique for the salient feature selection from the GLCM, LBP, and GFCC set to improve the feature quality. Further, the effectiveness of the proposed fusion of features is evaluated using KNN, SVM, and CT classifiers based on cross-validation accuracy.
The article is arranged as follows: Section II briefly reviews recent trends in Autism Spectrum Disorder Detection using ML. Section III describes the dataset, feature extraction, and feature selection used in the anticipated approach. Further, section IV gives the experimental results and discussions on the results. Finally, section V concludes the paper and presents the future direction for improvement in the suggested approach.
Recent trends in Autism Spectrum Disorder Detection using Machine Learning
Various machine-learning algorithms for ASD detection have been presented in recent years. This section offers the recent work on ASD detection using ML algorithms that focus on the various feature extraction and classifier algorithms and their performance for ASD detection. Morphometric and intensity features and a random forest classifier have resulted in 95% accuracy for intensity features 16. Researchers investigated a multimodal technique that integrated the characteristics of fMRI and sMRI based on convolution neural networks and non-stationary independent components (PCA/ICA/k-PCA). It has given an ASD detection accuracy of 67.30% and 64.30 for ADHD-200 and ABIDE holdout data, respectively 17,18 studied how to train a 3-D Convolutional Neural Network (CNN) to detect Autism using a variety of area and spectral parameters. 19 analyzed the correlation features of sMRI that achieved 79% accuracy for ASD using the KNN classifier on the National Database of Autism Research (NDAR) dataset.
20 compared the performance of an Extreme Learning Machine (ELM) and SVM classifier for cortical thickness features of sMRI for ASD detection. It resulted in 90.18% and 84.73% accuracy for ELM and SVM for the ADHD dataset. It shows that geometrical features are significant for ASD detection. 21 have used Pearson correlation and partial correlation for texture description of the sMRI, which has given 76.15 % accuracy on ADHD. In 22, an SVM classifier is used for ASD detection using geometrical features of the cerebral cortex region. 23 investigated GLCM (6 features) based ASD detection based on a manual selection of features. It has given 85.71% accuracy using the KNN classifier for the ABIDE-I dataset. 24 presented an F1-score feature selection strategy for selecting significant features from functional connectivity features of fMRI images. It provided 80.76% accuracy for SVM classification, but its application is limited for the sMRI images and larger datasets. 25 investigated that ABID-I provides enhanced performance compared with the ABIDE-II dataset because of variability in the dataset and subjects using CNN architectures. It shows that Adam provided higher results compared with traditional Adam optimizers. Further, different feature selection techniques such as Nilearn 26, minimum redundancy maximum relevance (MRMR) 27, and F1-score feature selection 28 have been employed to improve the distinctiveness of the traditional handcrafted features to improve the learning of the classification algorithm for ASD detection. The summary of several recent machine learning-based approaches for ASD detection is illustrated in Table 1.
From the review of several approaches, it is observed that ASD detection using MRI images is challenging due to the complex structure of the images, the shape of the brain, and the availability of a larger dataset for evaluation. The performance of various machine learning classifiers depends on the raw features obtained from the MRI images that show sensitivity to the poor quality of features.
Table 1: Summary of recent work in ASD detection.
|
Author |
Feature Extraction |
Classifier |
Database |
Performance |
|
(Katuwal, 2020) [17] |
Morphometric and intensity Features |
Random Forest Classifier |
112 Non-ASD and 115 ASD patient’s data |
Area Under Curve: Intensity features (95%), cortical folding index (69 %), cortical and subcortical volume (69 %), and surface area (68 %). |
|
(Sen, 2018) [18] |
Autoencoder, PCA |
Support Vector Machine |
ADHD-200 holdout data and ABIDE holdout data |
Accuracy: 67.30% (ADHD-200 holdout data and 64.30% (ABIDE holdout data) |
|
(Dekhil, 2019) [9] |
Correlation matrices |
K-Nearest neighbor Classifier |
NDAR |
fMRI-75%, sMRI-79%, fMRI+sMRI-81% |
|
(Peng, 2013) [21] |
Cortical Thickness |
ELM & SVM |
ADHD |
90.18% (ELM) and 84.73% (SVM) |
|
(Sara Calderon, 2012) [22] |
Pearson and Partial correlation |
SVM |
ADHD |
76.15 % |
|
(Lohar, 2020) [24] |
GLCM |
KNN |
Autism Brain Imaging Data Exchange (ABIDE) I |
85.71 % |
Material and Methods
The work aims to provide a discriminative feature set for ASD detection, investigates the importance of automatic machine learning-based ASD detection, and presents a feature selection scheme to improve ASD detection accuracy. This section provides details on the Materials and Methods used during the experimentation.
Dataset
Extensive experimentation is performed on the ABIDE-I dataset (sMRI images) 24, encompassing 1075 samples from 16 sites, as described in Table 2. It consists of 544 ASD samples and 531 TD samples. This dataset is collected for persons aged 7-64 years old. The total dataset is split into 70:30 for training and testing, respectively. Pre-processed ABIDE images having a resolution of 256×256 pixels are being considered.
Table 2: Description of ABID-I dataset (16 sites).
|
Database Name |
ASD |
TD |
|
Caltech_Anat |
21 |
17 |
|
KKI_Anat |
20 |
35 |
|
Leuven_Anat |
30 |
34 |
|
MaxMun_Anat |
23 |
34 |
|
NYU_Anat |
105 |
79 |
|
OHSU_Anat |
13 |
15 |
|
Olin_Anat |
20 |
16 |
|
Pitt_Anat |
31 |
26 |
|
SBL_Anat |
14 |
16 |
|
SDSU_Anat |
12 |
24 |
|
Stanford_Anat |
21 |
19 |
|
Trinity_Anat |
24 |
25 |
|
UCLA_Anat |
56 |
43 |
|
USM_Anat |
58 |
43 |
|
UM_Anat |
68 |
77 |
|
Yale_Anat |
28 |
28 |
|
Total Samples |
544 |
531 |
Proposed Methodology
The algorithmic flow diagram of the proposed ASD system is illustrated in Figure 1, which includes feature extraction, feature selection, and classification. The proposed ASD system uses three feature extraction techniques to characterize the sMRI (GLCM, LBP, and GFCC). The prominent features are selected using a correlation-based feature selection algorithm. For classification, three ML classifiers that researchers majorly adopt are applied, which will be suitable for fair comparison of feature fusion technique with state-of-the-art results reported by other researchers.
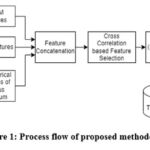 |
Figure 1: Process flow of proposed methodology. |
Feature Extraction
The proposed ASD detection approach collaborates the global features of the texture of brain sMRI images obtained using GLCM and LBP and geometrical features of the corpus callosum region of the brain. The proposed collaborative feature fusion of GLCM, LBP, and GFCC provides the feature vector of 273 samples that includes 12 features of GLCM, 255 features of LBP, and six features of GFCC.
Gray Level Co-occurrence Matrix Features
GLCM is a statistical texture descriptor representing the co-occurrence of a pair of image pixels with a particular value. It uses a gray co-occurrence matrix to provide the spatial representation of the image texture. The different texture attributes can be characterized using GLCM, such as energy, entropy, contrast, homogeneity, variance, auto-correlation, cluster shade, cluster prominence, mean, etc. The different attributes extracted using the co-occurrence matrix are summarized as follows:
Contrast
Contrast provides the gray level variance between the pixel and its adjacent pixels over the entire image, as given in Eq. 1.

The contrast value is 0 for homogeneous texture; for sMRI images, it lies between 0 to [size(P,1)-1]2.
Correlation
Correlation characterizes the degree of similarity between two adjacent pixels over an entire image. It lies between -1 and 1 for positively and negatively correlated images. It is calculated using Eq. 2.
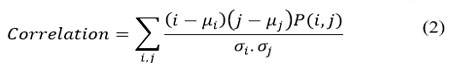
Where μi, and μj are mean over row and column, respectively, σi and σj represent variations over row and column, respectively.
Energy
Energy provides the uniformity of the texture computed using Eq. 3. Higher value energy (1) represents a high degree of uniformity in the texture, whereas lower value (0) provides a low degree of uniformity in texture.

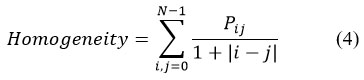
Homogeneity
It provides the degree of closeness of GLCM distribution to its diagonal and has a value between 0 and 1. It has a value of 1 for diagonal GLCM. It is computed using Eq. 4.
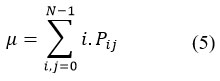
Mean
It estimates the intensity of all pixels in the relationships that contributed to the GLCM.
Variance
The variance of the intensities of all reference pixels in the relationships that contributed to the GLCM.
Cluster Prominence
Cluster prominence evaluates the asymmetry of the brain MRI image. The higher asymmetry caused by ASD in brain structures shows a higher cluster prominence value.
Cluster Shade
Cluster shades provide information regarding the matrix’s skewness, representing the image’s uniformity.
Inverse difference
It describes the texture of the image and results in a high value when the gray levels over the image are uniform.

Dissimilarity
It provides the degree of variance in the image’s texture.

Autocorrelation
Autocorrelation depicts the characteristics of similarity in the pattern and periodic patterns in the image.
Entropy
Entropy provides the degree of randomness in the brain sMRI images.
Local Binary Pattern Features
LBP is a scale-invariant, rotation-invariant, computationally efficient, and simple texture descriptor. It provides a local representation of the image texture using a binary pattern where the neighboring pixel intensities are compared with centered pixel intensity in the local window of 3×3 pixels. If the neighboring pixel value is greater than the central pixel value, it is assumed to be a binary one; otherwise, zero is given in Eq. 13.

 |
Figure 2: process of LBP feature extraction. |
The histogram of the LBP texture descriptor is computed, which provides 256 values. The histogram is calculated over the N×N blocks. The LBP histogram minimizes the feature vector length and helps to achieve the rotation-invariant and scale-invariant nature.
 |
Figure 3: Process of geometrical feature extraction of the corpus callosum. |
Geometrical Features of Corpus Callosum
The corpus callosum shows significant changes in ASD patients, such as increased area, irregularity in perimeter, and increase in shape and length. The multi-Otsu thresholding is employed for segmenting corpus callosum from brain sMRI images. The cluster with corpus callosum is considered for further processing. The morphological opening and closing are performed to minimize the noise and unwanted parts in the segmented output. Six geometrical properties of the segmented corpus callosum, such as area, perimeter, Major axis length, minor axis length, solidity, and extent, are computed to characterize the ASD and TD MRI. The flow diagram of the geometrical feature extraction of the corpus callosum is shown in Figure 3.
Feature Selection
The overall feature vector combines GLCM, LBP, and GFCC features, as illustrated in equation 14. The features of GLCM, LBP, and GFCC are described in Equations 15, 16, and 17, respectively.

High correlation features are more linearly dependent and have approximately the same influence on the dependent variable. When two features have a high correlation, one might be dropped. If two feature sequences have similar values, then the cross-correlation value attains maximum value. The cross-correlation-based feature selection helps to minimize the redundant information from the feature set and reduces the feature vector.
Results and Discussion
The system’s performance is evaluated based on various metrics such as percentage accuracy, recall, precision, and F1-score. The total features used in experimentations and feature details are mentioned in Table 3. A cross-correlation-based feature selection approach identifies the relevance of the extracted features using GLCM, LBP, and GFCC. There are a total of 274 features, which comprise 255 LBB features, 6 GFCC features, and 12 GLCM features.
The cross-correlation-based feature selection aids in selecting the important features to minimize the computational complexity and improve the feature discrepancy. The selected features using the cross-correlation-based feature selection technique are shown in Figure 4. Figure 4 a) provides the correlation value of every feature in the feature set that can result in better distinctiveness. The features are arranged in descending order so that the most promising features can be selected for classifier training. The effectiveness of the suggested technique is evaluated for a variable number of features, and the best value is decided based on cross-validation accuracy.
 |
Figure 4: a). Correlation value of original feature b). Sorted Features in descending order. |
Table 3: Feature description of GLCM, LBP, and GFCC
|
Feature Extraction Techniques |
Total Features |
Description |
|
GLCM |
12 |
Variance, energy, entropy, contrast, inverse difference, and dissimilarity provide better discrimination over homogeneity, autocorrelation, mean, cluster shade, correlation, and cluster prominence. |
|
LBP |
256 |
LBP Histogram |
|
GFCC |
6 |
Area, perimeter, Major axis length, minor axes length, solidity, and extent |
The performance of various classifiers for selected GLCM features is described in Table 4. The cross-correlation-based feature selection approach suggests that variance, energy, entropy, contrast, inverse difference, and dissimilarity provide better discrimination over homogeneity, autocorrelation, mean, cluster shade, correlation, and cluster prominence features. It has shown 90.71% for six features and 10-fold cross-validation for the classification tree classifier, and 91.11% accuracy for the RBF-SVM classifier GLCM does not focus on the gradient changes in the different directions and spatial dependencies in the brain MRI image. The GLCM matrix generation method is time-consuming for a large-resolution image, and features are sensitive to the image resolution.
Table 4: Performance of GLCM features based on % cross-validation accuracy
|
No. of Features |
K-fold |
Classification Tree |
KNN (K=3) |
KNN (K=5) |
KNN (K=7) |
KNN (K=9) |
Linear SVM |
RBF SVM |
Polynomial SVM |
|
6 |
5 |
90.63 |
55.63 |
55.19 |
54.64 |
50.46 |
56.07 |
56.07 |
57.96 |
|
6 |
10 |
90.71 |
55.99 |
56.55 |
52.83 |
50.38 |
56.1 |
56.1 |
58 |
|
6 |
15 |
90.63 |
56.95 |
54.95 |
53.23 |
50.92 |
55.14 |
56.57 |
52.73 |
|
12 |
5 |
87.87 |
50.38 |
52.06 |
52.88 |
50.09 |
56.54 |
91.11 |
43.92 |
|
12 |
10 |
87.94 |
50.47 |
45.01 |
46.66 |
50.03 |
56.58 |
91.03 |
43.89 |
|
12 |
15 |
87.77 |
55.52 |
55.14 |
56.57 |
52.73 |
54.67 |
57.44 |
55.9 |
The LBP features show local texture descriptions and help characterize the gradient change’s local characteristics over the brain MRI image, as given in Table 5. The LBP-CT shows a higher percentage accuracy for the complete feature vector. However, LBP-CT provides 92.55% for 12 features and shows almost equal performance compared with total LBP features. The RBF and Polynomial SVM shows overfitting for LBP features and 100% accuracy for all features for different k-fold cross-validation.
Table 5: Performance of LBP features based on % cross-validation accuracy.
|
No. of Features |
K-fold |
Classification Tree |
KNN (K=3) |
KNN (K=5) |
KNN (K=7) |
KNN (K=9) |
Linear SVM |
|
6 |
5 |
89.73 |
56.04 |
53.67 |
56.03 |
61.21 |
64 |
|
12 |
5 |
92.52 |
52.8 |
57.43 |
51.41 |
54.66 |
63.54 |
|
255 |
5 |
93.59 |
52.3 |
54.19 |
55.6 |
53.79 |
93.58 |
|
6 |
10 |
89.74 |
53.09 |
56.6 |
56.96 |
58.93 |
63.91 |
|
12 |
10 |
92.55 |
59.82 |
51.92 |
55.51 |
56.19 |
63.46 |
|
255 |
10 |
93.61 |
59.3 |
54.67 |
57.44 |
55.9 |
93.58 |
|
6 |
15 |
89.68 |
51.46 |
57.17 |
58.47 |
56.57 |
64.09 |
|
12 |
15 |
92.47 |
55.58 |
54 |
55.23 |
53.46 |
63.61 |
|
255 |
15 |
93.57 |
59.3 |
57.49 |
56.44 |
58.03 |
93.58 |
The performance of three classifiers, KNN, SVM, and CT, using geometrical features is discussed in Table 6. It has shown higher accuracy for six geometrical features along with a CT classifier for 5-fold cross-validation. It is observed that feature reduction shows lesser significance for the geometrical features because of less number of features. RBF SVM shows overfitting for geometrical features, resulting in 100% accuracy for different features and k-fold cross-validations.
Table 6: Performance of geometrical features based on % cross-validation accuracy
|
No. of Features |
K-fold |
Classification Tree |
KNN (K=3) |
KNN (K=5) |
KNN (K=7) |
KNN (K=9) |
Linear SVM |
Polynomial SVM |
|
3 |
5 |
81.76 |
64.45 |
53.7 |
55.13 |
56.55 |
56.07 |
56.07 |
|
6 |
5 |
89.72 |
46.23 |
50.89 |
52.77 |
55.55 |
52.76 |
56.07 |
|
3 |
10 |
81.77 |
64.5 |
59.89 |
58.74 |
57.9 |
56.1 |
56.1 |
|
6 |
10 |
89.69 |
45.75 |
48.05 |
53.67 |
56.55 |
52.18 |
56.1 |
|
3 |
15 |
81.71 |
62.47 |
60.38 |
58.92 |
55.87 |
56.12 |
56.32 |
|
6 |
15 |
89.68 |
46.19 |
50.06 |
50.44 |
54.69 |
52.76 |
56.12 |
Table 7 shows the performance of the proposed collaborative features that encompass 273 features of GLCM, LBP, and geometrical features.
Table 7: Performance of proposed collaborative features (GLCM-LBP-GFCC) based on % cross-validation accuracy.
|
No. of Features (GLCM-LBP-GFCC) |
K-fold |
Classification Tree |
KNN (K=3) |
KNN (K=5) |
KNN (K=7) |
KNN (K=9) |
Linear SVM |
RBF SVM |
Polynomial SVM |
|
10 |
5 |
90.66 |
54.71 |
58.39 |
57.89 |
57.06 |
63.58 |
100.00 |
42.51 |
|
10 |
90.71 |
55.49 |
56.51 |
57.44 |
59.39 |
63.61 |
100.00 |
42.55 |
|
|
15 |
90.63 |
57.01 |
56.85 |
58.03 |
56.79 |
63.71 |
100.00 |
42.50 |
|
|
20 |
90.77 |
58.40 |
57.68 |
57.04 |
60.68 |
63.54 |
100.00 |
42.27 |
|
|
25 |
90.15 |
57.20 |
57.20 |
57.00 |
59.30 |
63.54 |
100.00 |
42.41 |
|
|
20 |
5 |
92.55 |
51.41 |
52.34 |
49.08 |
48.17 |
67.77 |
100.00 |
60.70 |
|
10 |
92.48 |
56.03 |
54.65 |
52.31 |
51.92 |
67.81 |
100.00 |
60.73 |
|
|
15 |
92.54 |
55.18 |
53.86 |
53.86 |
51.50 |
66.80 |
100.00 |
60.10 |
|
|
20 |
92.66 |
56.00 |
57.07 |
53.14 |
51.77 |
67.80 |
100.00 |
60.57 |
|
|
25 |
92.25 |
54.70 |
53.10 |
53.29 |
50.54 |
66.30 |
100.00 |
59.70 |
|
|
30 |
5 |
93.93 |
51.37 |
54.17 |
58.42 |
69.17 |
70.58 |
100.00 |
43.47 |
|
10 |
93.89 |
53.37 |
55.58 |
56.94 |
58.87 |
70.54 |
100.00 |
43.37 |
|
|
15 |
93.87 |
50.17 |
54.38 |
56.98 |
59.40 |
70.60 |
100.00 |
43.33 |
|
|
20 |
93.90 |
53.04 |
53.63 |
57.04 |
58.45 |
70.10 |
100.00 |
43.00 |
|
|
25 |
93.16 |
52.60 |
53.50 |
54.59 |
54.90 |
68.30 |
100.00 |
42.20 |
|
|
40 |
5 |
95.78 |
51.82 |
52.74 |
56.02 |
57.42 |
60.73 |
100.00 |
40.14 |
|
10 |
95.77 |
56.01 |
54.84 |
55.17 |
53.67 |
60.77 |
100.00 |
40.21 |
|
|
15 |
95.80 |
56.47 |
53.71 |
54.15 |
54.73 |
60.76 |
100.00 |
40.19 |
|
|
20 |
95.86 |
55.27 |
53.50 |
54.59 |
54.90 |
59.73 |
100.00 |
40.00 |
|
|
25 |
94.30 |
54.38 |
53.10 |
53.29 |
50.54 |
57.20 |
100.00 |
39.20 |
|
|
50 |
5 |
93.89 |
53.37 |
55.58 |
56.94 |
58.87 |
70.54 |
100.00 |
43.37 |
|
10 |
93.93 |
51.37 |
54.17 |
58.42 |
69.17 |
70.58 |
100.00 |
43.47 |
|
|
15 |
92.25 |
54.70 |
53.10 |
53.29 |
50.54 |
66.30 |
100.00 |
59.70 |
|
|
20 |
92.48 |
56.03 |
54.65 |
52.31 |
51.92 |
67.81 |
100.00 |
60.73 |
|
|
25 |
90.63 |
57.01 |
56.85 |
58.03 |
56.79 |
63.71 |
100.00 |
42.50 |
The proposed collaborative features provide 95.86% accuracy for the CT classifier for 40 features for 20-fold cross-validation. Increasing the cross-fold validation increases the chances of distribution of the proper training set. When the proposed method is evaluated using the KNN classifier, it provides better results for K=3 compared with K=5, K=7, and K=9. It has given 56.47% accuracy for 40 features and 15-fold cross-validation for K=3. Figure 5 shows the comparative analysis of the overall performance of the proposed system. It is observed that the CT classifier gives the highest accuracy of 95.85% for 20-fold cross-validation and performs better than the KNN, linear SVM, and polynomial-SVM classifier. The linear SVM provides superior results compared with the polynomial classifier. The feature selection is important in the system’s accuracy and helps minimize the algorithm’s complexity.
 |
Figure 5: Overall performance of a proposed system. |
The total recognition time of the proposed scheme with and without feature selection is described in Table 8. It is noticed that the cross-correlation-based feature selection methods help to consider the prominent features and minimize the recognition time of ASD detection. It is observed that the proposed GLCM-LBP-GFCC and the CT classifier provide a lesser recognition time of 20.25 sec for 40 features.
Table 8: Recognition time for ASD detection
|
Method |
Recognition Time (sec) |
|
|
Without Feature Selection |
With Feature Selection (40 Features) |
|
|
GLCM-LBP-GFCC-KNN |
36.50 |
28.23 |
|
GLCM-LBP-GFCC-CT |
31.13 |
20.25 |
|
GLCM-LBP-GFCC-SVM (Linear) |
32.76 |
21.39 |
|
GLCM-LBP-GFCC-SVM (Polynomial) |
32.35 |
21.89 |
The performance of the proposed scheme is compared with the previous machine learning-based approaches used for ASD detection, as given in Table 9. It is observed that the anticipated scheme outperforms the traditional techniques and suggests that a combination of features and efficient feature selection helps to improve ASD detection accuracy.
Table 9: Performance comparison with traditional schemes
|
Author & Year |
MRI Images |
Feature Extraction Technique |
Feature Selection |
Classifier |
Performance (% Accuracy) |
|
(Lohar, 2020) [24] |
ABIDE-I (sMRI) |
GLCM |
NA |
KNN (K=15) |
85.71 % |
|
(Devika, 2021) [25] |
ABIDE-II (fMRI) |
Functional connectivity matrix |
F1-score selection |
SVM |
80.76 % |
|
(Maryam , 2019) [26] |
ABIDE-I (fMRI) |
CNN-Adamax |
NA |
Softmax |
72.00% |
|
ABID-II (fMRI) |
CNN-Adamax |
NA |
Softmax |
67.00% |
|
|
(Yang , 2019) [27] |
ABIDE (rs-fMRI) |
Different Features |
NA |
Ridge Classifier |
71.98% |
|
(Chen, 2016) [28] |
ABIDE (rs-fMRI) |
Functional connectivity matrix |
F1-score selection |
SVM |
79.17 % |
|
(Zhou, 2014) [29] |
ABIDE (sMRI) |
Cortial thickness and geometrical gray matter |
mRMR |
SVM |
70.00% |
|
Proposed approach |
ABIDE-I (sMRI) |
GLCM-LBP-GFCC |
Correlation-based Feature Selection |
KNN (K=9) |
69.17 % |
|
Linear SVM |
70.54 % |
||||
|
Polynomial SVM |
60.73 % |
||||
|
CT |
95.86 % |
It is noted that the proposed approach provides 11.80-43.07% improvement over the existing techniques utilized for ASD detection given in [21,24-29]. The hybrid feature extraction technique combines the local texture, global texture, and geometrical characteristics of the sMRI for ASD detection. Also, the correlation-based feature selection aids in choosing the salient and distinctive features to improve the ASD detection rate. The proposed GLCM-LBP-GFCC-based attribute scheme for ASD detection gives superior results for CT classifier (95.86%) compared with KNN (69.17%), linear SVM (70.54%) and polynomial SVM (60.73%).
Conclusion
The paper presented the effectiveness of the feature fusion technique for ASD detection using sMRI of the brain. The collaboration of three types of features, namely GLCM, LBP, and GFCC, is proposed. Instead of selecting all features, the cross-correlation-based feature selection is used. The effectiveness of the proposed approach is validated using three classifiers such as K-Nearest Neighbor, Support Vector Machine, and Classification Tree classifier based on cross-validation accuracy. It is observed that the feature fusion technique and cross correlation-based feature selection help to grab the salient features from the obtained feature set, provide better accuracy with a minimum number of features, and effectively result in lesser recognition time. The proposed scheme has shown 95.86% accuracy for the CT classifier for the collaborative features obtained from GLCM, LBP, and GFCC, along with cross-correlation-based feature selection.
In the future, the performance of the anticipated system can be further improved by using deep learning frameworks. The availability of the ASD dataset is very challenging, and limited dataset availability causes class imbalance problems. Thus, a data augmentation strategy can tackle the class imbalance issue. The efficiency and trust of the ASD detection system can be enhanced using multimodal biometrics traits such as facial expressions, speech, EEG signals, etc., for ASD detection.
Acknowledgment
The author would like to thank the Principal and Management of Pimpri Chinchwad College of Engineering and Research, Ravet, for continuous support for the research work.
Conflict of Interest
The authors declare that they have no conflicts of interest.
Funding Sources
There is no funding sources
References
- Autism Spectrum Disorder, https://www.who.int/news-room/fact-sheets/detail/autism-spectrum-disorders, Retrieved on 5 January 2022.
- De Belen, Ryan Anthony J., Tomasz Bednarz, Arcot Sowmya, and Dennis Del Favero. “Computer vision in autism spectrum disorder research: a systematic review of published studies from 2009 to 2019.” Translational Psychiatry 10, no. 1 (2020): 1-20.
CrossRef - Nogay, Hidir Selcuk, and Hojjat Adeli. “Machine learning (ML) for the diagnosis of autism spectrum disorder (ASD) using brain imaging.” Reviews in the Neurosciences 31, no. 8 (2020): 825-841.
CrossRef - Walsh, Melissa JM, Gregory L. Wallace, Stephen M. Gallegos, and B. Blair Braden. “Brain-based sex differences in autism spectrum disorder across the lifespan: A systematic review of structural MRI, fMRI, and DTI findings.” NeuroImage: Clinical (2021): 102719.
CrossRef - Guo, Xiang, Jiehuan Wang, Xiaoqiang Wang, Wenjing Liu, Hao Yu, Li Xu, Hengyan Li, “Diagnosing autism spectrum disorder in children using conventional MRI and apparent diffusion coefficient based deep learning algorithms.” European Radiology (2021): 1-10.
CrossRef - Pereira, Alessandra M., Brunno M. Campos, Ana C. Coan, Luiz F. Pegoraro, Thiago JR de Rezende, Ignacio Obeso, Paulo Dalgalarrondo, Jaderson C. da Costa, Jean-Claude Dreher, and Fernando Cendes, “Differences in cortical structure and functional MRI connectivity in high functioning autism,” Frontiers in neurology, 9, 2018, pp. 509: 539.
CrossRef - Manciu, Felicia S., Kendall H. Lee, William G. Durrer, and Kevin E. Bennet, “Detection and monitoring of neurotransmitters—a spectroscopic analysis,” Neuromodulation: Technology at the Neural Interface, 16(3), 2013, pp. 192-99.
CrossRef - Badgaiyan, Rajendra D., “Imaging dopamine neurotransmission in the live human brain,” Progress in brain research, 211, 2014, pp. 165-82.
CrossRef - Dekhil, Omar, Mohamed Ali, Reem Haweel, Yaser Elnakib, Mohammed Ghazal, Hassan Hajjdiab, Luay Fraiwan, “A comprehensive framework for differentiating autism spectrum disorder from neurotypicals by fusing structural MRI and resting-state functional MRI.” In Seminars in Pediatric Neurology, vol. 34, p. 100805. WB Saunders, 2020.
CrossRef - Li, Xiaoyi, Kai Zhang, Xiao He, Jinyun Zhou, Chentao Jin, Lesang Shen, Yuanxue Gao, Mei Tian, and Hong Zhang. “Structural, Functional, and Molecular Imaging of Autism Spectrum Disorder.” Neuroscience Bulletin (2021): 1-21.
CrossRef - Frewer, Veronica, Courtney P. Gilchrist, Simonne E. Collins, Katrina Williams, Marc L. Seal, Richard J. Leventer, and David J. Amor. “A systematic review of brain MRI findings in monogenic disorders strongly associated with an autism spectrum disorder.” Journal of Child Psychology and Psychiatry 62, no. 11 (2021): 1339-1352.
CrossRef - HaweelReem, Noha Seada, Ayman El-Baz, and Said Ghoniemy”A review on autism spectrum disorder diagnosis using task-based functional MRI.” International Journal of Intelligent Computing and Information Sciences 21, no. 2 (2021): 23-40.
CrossRef - Çalışkan, Abidin. “A new ensemble approach for congestive heart failure and arrhythmia classification using shifted one-dimensional local binary patterns with long short-term memory.” The Computer Journal 65, no. 9 (2022): 2535-2546.
CrossRef - Çalışkan, Abidin. “Classification of Tympanic Membrane Images based on VGG16 Model.” Kocaeli Journal of Science and Engineering 5, no. 1: 105-111.
CrossRef - Çalişkan, Abidin, and Ulus Çevik. “An efficient noisy pixels detection model for CT images using extreme learning machines.” Tehnički vjesnik 25, no. 3 (2018): 679-686.
CrossRef - Xu, Ming, Vince Calhoun, Rongtao Jiang, Weizheng Yan, and Jing Sui. “Brain imaging-based machine learning in autism spectrum disorder: methods and applications.” Journal of Neuroscience Methods 361 (2021): 109271.
CrossRef - Katuwal Gajendra J., Stefi A. Baum, and Andrew M. Michael, “Early brain imaging can predict autism: Application of machine learning to a clinical imaging archive,” BioRxiv 2018, pp. 471169.
CrossRef - Sen Bhaskar, Neil C. Borle, Russell Greiner, and Matthew RG Brown, “A general prediction model for the detection of ADHD and Autism using structural and functional MRI,” PloS one, 13(4), 2018, pp. e0194856.
CrossRef - Thomas, Rajat Mani, Selene Gallo, Leonardo Cerliani, Paul Zhutovsky, Ahmed El-Gazzar, and Guido van Wingen, “Classifying autism spectrum disorder using the temporal statistics of resting-state functional MRI data with 3D convolutional neural networks,” Frontiers in Psychiatry 2020, pp. 440.
CrossRef - Dekhil, Omar, Mohamed Ali, Yaser El-Nakieb, Ahmed Shalaby, Ahmed Soliman, Andrew Switala, Ali Mahmoud, “A personalized autism diagnosis CAD system using a fusion of structural MRI and resting-state functional MRI data” Frontiers in psychiatry, 10, 2019, pp. 392.
CrossRef - Peng, Xiaolong, Pan Lin, Tongsheng Zhang, and Jue Wang, “Extreme learning machine-based classification of ADHD using brain structural MRI data,” PloS one, 8(11), 2013, pp. e79476.
CrossRef - Calderoni, Sara, Alessandra Retico, Laura Biagi, RaffaellaTancredi, Filippo Muratori, and Michela Tosetti, “Female children with autism spectrum disorder: an insight from mass-univariate and pattern classification analyses,” Neuroimage, 59(2), 2012, pp. 1013-22.
CrossRef - Ecker, Christine, Vanessa Rocha-Rego, Patrick Johnston, JanainaMourao-Miranda, Andre Marquand, Eileen M. Daly, Michael J. Brammer, Clodagh Murphy, Declan G. Murphy, and MRC AIMS Consortium, “Investigating the predictive value of whole-brain structural MR scans in autism: a pattern classification approach,” Neuroimage 49(1), 2010, pp. 44-56.
CrossRef - Lohar Mamata, V., and S. Chorage Suvarna. “Detection of autism spectrum disorder (ASD) using machine learning techniques: a review.” Int J Future Generat Commun Net 13, no. 1 (2020): 426-438.
- Devika, K., and V. Ramana Murthy Oruganti. “A Machine Learning Approach for Diagnosing Neurological Disorders using Longitudinal Resting-State fMRI.” In 2021 11th International Conference on Cloud Computing, Data Science & Engineering (Confluence), pp. 494-499. IEEE, 2021.
- Aghdam, Maryam Akhavan, Arash Sharifi, and Mir Mohsen Pedram. “Diagnosis of autism spectrum disorders in young children based on resting-state functional magnetic resonance imaging data using convolutional neural networks.” Journal of Digital Imaging 32, no. 6 (2019): 899-918.
CrossRef - Yang, Xin, Mohammad Samiul Islam, and AM Arefin Khaled. “Functional connectivity magnetic resonance imaging classification of autism spectrum disorder using the multisite ABIDE dataset.” In 2019 IEEE EMBS International Conference on Biomedical & Health Informatics (BHI), pp. 1-4. IEEE, 2019.
CrossRef - Chen, Heng, Xujun Duan, Feng Liu, Fengmei Lu, Xujing Ma, Youxue Zhang, Lucina Q. Uddin, and Huafu Chen. “Multivariate classification of autism spectrum disorder using frequency-specific resting-state functional connectivity—a multi-center study.” Progress in Neuro-Psychopharmacology and Biological Psychiatry 64 (2016): 1-9.
CrossRef - Zhou, Yongxia, Fang Yu, and Timothy Duong. “Multiparametric MRI characterization and prediction in autism spectrum disorder using graph theory and machine learning.” PloS one 9, no. 6 (2014): e90405.
CrossRef

