
Manuscript accepted on :30-Sep-2020
Published online on: --
Plagiarism Check: Yes
Reviewed by: Dr. Shruti Jain
Second Review by: Victor B Oti
Final Approval by: Dr Pallav Sengupta
Leena Chandrashekar*  and Sreedevi A
Electrical and Electronics Engineering Department, VTU, Bangalore, India, 560098.
Corresponding Author E-mail: leenamaheshnikam10@gmail.com
DOI : https://dx.doi.org/10.13005/bpj/2026
Abstract
Multimodal images are studied to confirm the presence or classify the brain tumors like Glioblastoma. Magnetic Resonance Imaging (MRI) and Computed Tomography (CT) are the commonly used multimodal images to confirm the tumors. Each of the images represents a unique and crucial attribute of the tumor. Experts perform an elaborate manual analysis for each of these images and in some cases the conclusions on the tumors can be indecisive. The efficiency of analysis is mostly based on the expertise of the experts. Moreover, the multimodal images succumb to uncertainty, since they represent diverse information of the tumor. We propose a technique to overcome these issues by fusing multimodal images using Non-sub Sampled Contourlet Transform. The quality of the fused images can be further improved by performing a contrast and edge enhancement technique based on Contrast Limited Adaptive Histogram technique and Particle Swarm Optimization. The paper proposes a novel approach that can promote the visual quality of the fused images. The proposed technique provides improvement in standard deviation, entropy, structural similarity index and unique image quality index of the fused images.
Keywords
Contrast Limited Adaptive Histogram Equalization; Multimodal Image Fusion; Non-Local Means Filter; Non-sub Sampled Contourlet Transform; Particle Swarm Optimization.
Download this article as:| Copy the following to cite this article: Chandrashekar L, Sreedevi A. Multimodal Image Fusion of Magnetic Resonance and Computed Tomography Brain Images – A New Approach. Biomed Pharmacol J 2020;13(3). |
| Copy the following to cite this URL: Chandrashekar L, Sreedevi A. Multimodal Image Fusion of Magnetic Resonance and Computed Tomography Brain Images – A New Approach. Biomed Pharmacol J 2020;13(3). Available from: https://bit.ly/343G0ol |
Introduction
Glioblastoma is the fastest-growing Grade IV malignant tumours found in the brain with a survival time of less than a year after their detection. The detection of these tumours has always been a challenge to doctors. The reasons for the delay in detection are due to failure to understand the early symptoms, lack of awareness, inadequate healthcare facilities like imaging, preliminary screening for the patients and expertise with doctors. An inability to distinguish tumours experts is mostly due to incorrect imaging procedures, patient’s condition at the time of image acquisition and noise may lead to delayed prognosis. For this reason, medical imaging is paramount in the detection, identification, grading and diagnosis of the Glioblastoma. Doctors recommend many imaging techniques for detection of Glioblastoma like Computed Tomography (CT), Magnetic Resonance Imaging (MRI) and its variants, Fluid Attenuated Inverse Recovery (FLAIR) and Positron Emission Tomography (PET).1,2 These images are acquired sequentially through different scanning machines at different times. Each of the modalities is available in different resolution, size and provides different information of the brain. For example, the structural information of the brain like bone structure, tissue symmetries, changes in tissue density and space-occupying lesions are provided by CT images.3 It also shows changes made in the nearby skull region due to tumour extension and calcification of tumours. Conversely, tumour borders and infiltration in the nearby regions are undetected in CT images. These can be easily visualized with MR (Magnetic Resonance) images, which provide structural and functional information of the brain along with high contrast and resolution for soft tissues like tumours or lesions.3 FLAIR images are a special type of MRI, which is sensitive to changes at the periphery of the cerebral hemispheres. PET images assess the tumour growth and spread.4 These multimodal images are the noninvasive ways to detect Glioblastoma. Based on the multimodal images, surgical resection or complete removal of tumour is made followed by radiochemotherapy.4
The medical images acquired have poor contrast and are affected with noise due to various reasons. Pre-processing is a significant process for removing the noise from the images with minimum loss of information. Some of the pre-processing techniques used are Bilateral Filter, Anisotropic Diffusion Filter and Non-local means filter.5 Further, these images are enhanced to obtain improved quality in contrast, entropy and structural information. The enhancement is achieved by the following techniques – Non-Linear Transfer function, Histogram based and Frequency Domain.6 A variant of Histogram Equalization is the Contrast Limited Adaptive Histogram Equalization (CLAHE), proposed by K Zuierveld,7 is also a block-based contrast enhancement technique with focus on local contrast. Unlike AHE, CLAHE provides uniform equalization with clipping the excess portion of large peaks found after the histogram equalization, thereby avoiding over-amplification. The excess portion removed depends on a parameter called clip limit, which is a function of the dynamic range of the image and block size. The block size, clip limit and the distribution function determine the quality of enhancement and must be chosen by the user.7 Various histogram based enhancement techniques are compared and analyzed, CLAHE is observed to perform better for MRI brain Images.8
Even though, CLAHE provides good local contrast, it fails to enhance the pixels with low gray level intensity. Besides, there is no standard for finding the optimal clip limit for a specific region of interest in medical images. Generally, the average height of the histogram is proportional to the clip limit, with user defined normalization factor. The clip limit must be computed adaptively for every block.9 Optimization techniques provide a convenient way of determining the CLAHE parameters without any manual intervention and compute them independently for every image block. An optimization technique called Particle Swarm Optimization was proposed by Eberhart and Kennedy,10 which is motivated by nature. It is based on how the biological social groupings interact with each other to find food or save from predators. It is mostly based on swarm intelligence to solve the optimization problem. A group of possible solutions also called particle form the swarm. An optimum particle or solution to the optimization problem is determined based on a fitness function. Each particle of the swarm is identified with its velocity and position, which are updated through iterations. The search for best solution terminates at the end of the iterations or when the solution generates the highest fitness value.11 Malik Braik and Alaa Sheta have implemented the PSO algorithm for enhancing general images.12
The Multimodal Image fusion of CT and MRI images has emerged as latest development in medical imaging.16 It deals with integration of multimodal images, like CT and MRI into a single image that assist early detection of tumors. Along with generating high quality images, it also occupies lesser digital storage.6,13 Some of the techniques for fusing the multimodal images are Discrete Wavelet Transform (DWT),13-14 Laplacian Pyramid (LP),15 Contourlet Transform (CTT)16 and Non-sub Sampled Contourlet transform (NSCT).21-23 The methodology for fusion commence with the disintegration of the medical images by the above transforms. The low frequency and high frequency components are extracted from the medical images, fused in accordance with predefined rules and integrated back to obtain the fused image. The process can be extended to multi-level, by recursive decomposition of low frequency sub-images. This often leads to redundancy and gradual decline of edge information from the high frequency sub-images. In view of obtaining the finest details of the image, the down sampling and up sampling process in performed, that usually lead to aliasing and blocking effect in fused images. Hence, multimodal image fusion is shift variant and redundant.17
The medical images contain many edges and curved lines, which can be easily detected by Contourlet Transform. However, shift variant and redundant characteristic hinder the visual quality of the fused image. A slight modification of CTT led to Non-Subsampled Contourlet transform (NSCT). This transform offers an exceptional performance in edge and contour detection. The NSCT is a 2-filter bank of low pass and band pass filter along with directional filters. It generates a large number of low frequency and high frequency components due to the absence of up sampling and down sampling. Thus, aliasing effect is not seen in the fused images. In addition, the directional filters decompose high frequency images to next levels. Therefore, NSCT provides a very good contrast and edge information in the fused images.22-23 The visual quality of the fused images can be further increased by considering the enhanced CT and MRI images. The structural information is of great importance in the fused MRI and CT images, as they indicate the periphery of tumor region. The objective of this paper is to provide a new approach for integrating multimodal and Multiresolution images to assist early detection of brain tumors.
Proposed Method
The research work includes three main phases a) preprocessing of MRI and CT images, b) image enhancement followed by image registration and c) image fusion. More than 200 MRI and CT images containing Grade IV tumors – Glioblastoma is taken from www.Radiopedia.org for this work. There are quite a few databases available publicly for MRI images, but the challenge in our research is to get multimodal images for the same patient. Since these are acquired at different times and from different machines, they must be registered and preprocessed before fusing them. The Figure 1 shows the block diagram for the fusion process.
Preprocessing with Non-local Means Filter
The preprocessing stage deals with resizing, converting the images to 8 bit gray scale. The Non-Local Means Filter (NLMF) is used for eliminating the Gaussian and Rician noise present in the CT and MRI images. It should be noted that the noisy pixels are usually independent and generally associated with other pixels in the neighborhood. Noise cancellation occurs on averaging of the neighborhood pixels and replacing the noisy pixel with the weighted average value that is close to its original value.
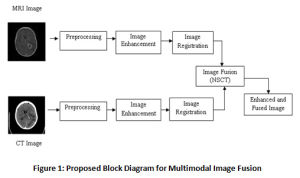 |
Figure 1: Proposed Block Diagram for Multimodal Image Fusion |
The similarity measure for a noisy pixel in the neighborhood is compared with a similar pixel in the neighborhood based on the Euclidean distance. σ is the standard deviation of the Gaussian kernel. The preference of weights is made on basis of the Euclidean distance and computed using Eq. (1), with Z(i) as a normalization constant
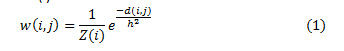
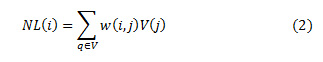
The values of weights, w (i, j) lie in the range of 0 and 1. And sum of the all the weights is unity. The exponential decay of eq.2 is controlled by a smoothing kernel h. The area of the function shrinks or expands based on the values of h. Smaller values of h lead to suppressing the noise and large values of h lead to blurring. The range of values for weights are mostly dependent on the similarity between the neighboring pixels i and j. For a discrete noisy image, V = {V (j)| j ε I}, 0 ≤ I ≤ 255, represents a neighborhood of the noisy pixel. The denoised image pixel NL (i) is computed as a product of weight and the pixel intensities V (j) in the image as shown in eq.(1.2)
The Non-local Means filter contains a remarkable self normalizing feature due to a quick decay of the exponential function that depends on the Euclidean distance, that eventually lead to zero when the neighborhood of pixels diminish for a denoised image. Additionally, the NLMF compares the pixel intensity along with the structural relationship like edges in the vicinity of the pixels. High Peak Signal Nosie Ratio, low Mean Square Error and high Structural similarity index is achieved with this technique as it considers the intensity of all the pixels in the image to filter the noisy pixel, and hence the name non-local. Conversely, due to its complexity, the computational burden is its major shortcoming.5
Image Enhancement
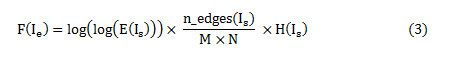
The image enhancement usually deals with contrast enhancement, to distinguish tumorous and non-tumorous regions in the CT and MRI images. But, with contrast enhancement, the edges in the images are greatly affected; hence there is a need to enhance the contrast of the images by not affecting the edges in the image. Histogram equalization is a popular technique for enhancement, but fails to enhance the very low intensity pixels. Contrast Limited Adaptive Equalization (CLAHE) is mostly used, since it enhances the low intensity pixels by adding the excess of high intensity pixel values based on a predefined clip-limit value. The clip-limit value is usually an average of histogram values. The enhancement technique implemented is a 2-fold one – first the image is enhanced by CLAHE based on a predefined clip limit, secondly, a nature inspired algorithm like Particle Swarm Optimization (PSO) is used to choose the clip limit automatically. An objective function is computed to determine the optimal clip limit value. The normalized clip limit is mostly in the range of 0 to 0.01. The objective function given by Eq. (3)
The possible values for clip limit are visualized as a swarm of particles. Each particle is represented in terms of its velocity and position. For any particle ‘i’, the position and velocity indicates its location in the swarm and it direction of descent or ascent respectively. To begin with random values are assumed for velocity and position of the particle, which is recursively, updated with every iteration using Eq. (4) and Eq. (5).
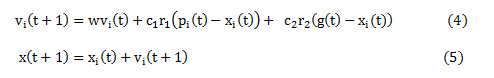
vi(t) and xi(t) represent the velocity and position for an particle i for iteration t. Eq.(1.4) comprises of three components – first component representing the initial velocity of the particle, the second component represents the particle’s decision based on its own experience and the third component indicates the particle’s decision based on swarm’s experience. In every iteration, the image is enhanced using CLAHE with the selected clip limit (each particle). The fitness function is computed using Eq. (3).This process is repeated for all the particles to get the best fit (clip limit). The clip limit that maximizes the fitness function can be accessed from the swarm based on its position and velocity and is represented as ‘pbest’ or pi(t). This denotes the best local solution for that iteration. The enhancement process is repeated for all the iterations to get ‘pbest’ or pi(t) for each iteration. In case the ‘pbest’ value in the current iteration is greater than the previous one, then the ‘pbest’ is updated with a new ‘pbest’ and ‘gbest’, otherwise the ‘pbest’ from previous iteration is retained as ‘pbest’ and ‘gbest’. The ‘gbest’ or g(t) in Eq.(4) is the global solution for the enhancement process obtained at the end of all the iterations. When ’pbest’ appears equal ‘gbest’ over a predefined number of iterations the enhancement process terminates.
Initialize the particle swarm (clip limit)
For each iteration
For each particle
Enhance the image using CLAHE
Compute the fitness value (Eq. (3))
If the fitness value is greater than the previous fitness value (pbest)
Set current value as the new pbest (gbest)
End
Choose the particle with the best fitness value among all the pbest (gbest)
For each particle
Calculate particle velocity (Eq. (4)
Calculate the particle position (Eq. (5))
End
Continue while maximum iterations are attained.
End
Report the gbest and pbest
A balance between ‘pbest’ and ‘gbest’ is achieved by inertia weight represented as w, c1 and c2 – the positive acceleration constants and r1 and r2 are random values in the range of [0,1]. The, an optimal value for the clip limit is obtained by PSO algorithm based on maximum value of the fitness function. Figure 2 shows the pseudo code for proposed CLAHE-Particle Swarm Optimization (CPSO) algorithm with Uniform distribution function.19
Image Registration
The CT and MRI images are obtained from different machines and at different times. Hence, they must be registered with each other for uniform scaling, rotation or skewness. An intensity based registration is performed, where in the CT image is treated as a reference image and the MRI image is a moving image. The optimizer is chosen to transform the moving image in terms of scaling, rotation or shifting and evaluate a similarity metric like mean square error or mutual information for the 2 images. This process is repeated for a large number of iterations or for a predefined similarity metric value.18-19
Non-Sub sampled Contourlet Transform (NSCT)
The multi-scale and multi-direction characteristic of NSCT is due to it is 2-stage filter bank as illustrated in the Figure 3. The non-existence of the up-sampling and down sampling is the uniqueness of this transform, enables shift invariance and evades pseudo Gibbs phenomenon in the fused images.20 Laplacian Pyramid forms the first stage of the transform, referred as Non Subsampled Pyramid (NSP) due to absence of samplers. This stage offers the multi-scale property of the transform. Non Subsampled Direction Filter Bank (NSDFB) – the second stage of NSCT provides the directionality feature. This stage decomposes the image in k+1 sub-image, with k represent 2k directional images and ‘1’ represents one low frequency image at each level.21 Matlab provides NSCT toolbox; the “pyrexc” and “vk” are the low pass filter and directional filter respectively. The decomposition of each source image is performed up to four levels and in 4, 8, 8, 16 directions at each corresponding level.22-23
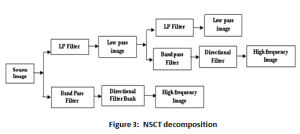 |
Figure 3: NSCT decomposition |
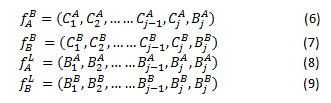
The CT and MRI images are represented as A and B. NSCT decomposition of the A and B generates the low frequency and high frequency images ,, and , respectively. The high frequency coefficients and are derived from high frequency images, as in Eq.(6) and (7). Likewise, and represent the low frequency coefficients decomposed from low frequency images A and B respectively shown in eq.(8) and eq.(9)
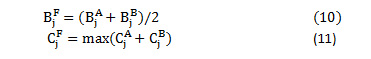
The fused low frequency and high frequency coefficients at level j are computed as eq. (10) and eq.(11)
The NSCT based fusion technique consumes more CPU time due to its complexity and large number of coefficients.17,18 Furthermore, the challenge also lies in favor of choosing the number of decomposition levels and the fusion rules. In fact there is no evidence for the best possible number for the decomposition levels and is established on the experimentation, nature of images and visual quality of images Figure 4 illustrates a single level decomposition and recomposition of CT and MRI images using NSCT.
Experiment and Results
All experiments are carried on Matlab 2016a with dataset of following arrangement (i) images with contrast agent (ii) images without contrast agent and (iii) delayed images with contrast agent. A combination of CT and MRI T1 image, CT and MRI T2 and CT and MRI FLAIR image is tested and results are documented. The datasets are available on open access radiology resources.25,26 The performance of the new approach is evaluated based on the parameters listed in Table 1.
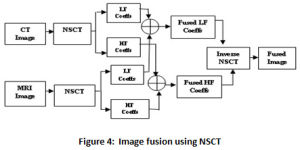 |
Figure 4: Image fusion using NSCT |
The CT and MRI images are fused using NSCT fusion and enhanced using the built-in function for CLAHE (adapthisteq), the results are recorded under P1. The performance of the fused and enhanced image is compared with images enhanced by CLAHE-PSO technique, under P2. The new approach deals with enhancing the CT and MRI images prior to integrating them, using CLAHE-PSO technique. The enhanced CT and MRI images are later fused and its visual quality is evaluated (Proposed). Since the CT and MRI images are enhanced prior to integrating them by means of NSCT, the low frequency and high frequency coefficients are better-off than the original CT and MRI images. This is the novel approach in our paper.
The results for 5 Datasets is shown in Table 2. Fig.5 displays the CT, MRI images, the fused images, image obtained by P1 and P2 techniques and the proposed technique. The contrast of fused images is measured by Standard Deviation (SD). The parameter assists in differentiation of the soft tissues and tumors. The contrast is largely improved with the proposed technique. The information content of the fused image is measured by Entropy. The NLMF, CLAHE with PSO and NSCT have greatly contributed towards the entropy of the fused image. The Structural Similarity Index Metric (SSIM) is a measure of the structural similiarity between the source image and enhanced image, which has shown improvent too. It lies in the range of 0 and 1. High structural similiarity id indicated by unity or close to unity value, measured by comparing source image and fused image. Coefficient correlation, illumination and contrast of enhanced image and source image is made in term of UIQI. Figure 5 shows results for 5 Datasets. Table 2 tabulate the results for the various parameters. The proposed approach shows improvement in the results.
The only concern, we found with the new approach is reduction in PSNR, which is the ratio of the maximum pixel intensity to Mean Square Error(MSE). MSE is a measure of similiarity between the orginial image and the enhanced image. The proposed technique presents improved results for standard deviation, entropy, SSIM and UIQI. However, the PSNR and MSE values are not very promising and need attention. Our approach has shown a significant advance of 10.9 % and 9.68% for standard deviation and entropy for fused image. A considerable improvement in SSIM and UIQI is also observed with an 30.9% and 39.8% advancement in comparison to the other techniques.
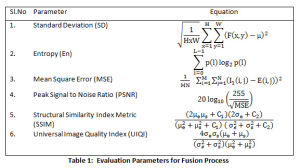 |
Table 1: Evaluation Parameters for Fusion Process |
Table 2: Results for 5 Datasets
| STD | Entropy | |||||||||
| Dataset | Fused | P1 | P2 | Proposed | Fused | P1 | P2 | Proposed | ||
| D1 | 74.42 | 80.23 | 77.42 | 81.91 | 5.299 | 5.7196 | 5.54 | 6.07 | ||
| D2 | 78.29 | 80.19 | 79.18 | 83.17 | 5.6008 | 6.19 | 6.11 | 6.33 | ||
| D3 | 73.77 | 81.88 | 81.499 | 85.811 | 6.1211 | 6.7315 | 6.67 | 6.4 | ||
| D4 | 77.49 | 79.722 | 79.66 | 80.96 | 6.19 | 6.79 | 6.612 | 6.36 | ||
| D5 | 69.74 | 78.84 | 69.5 | 81.89 | 5.6357 | 6.1051 | 5.6315 | 6.4 | ||
| PSNR | SSIM | |||||||||
| Dataset | Fused | P1 | P2 | Proposed | Fused | P1 | P2 | Proposed | ||
| D1 | 30.32 | 20.92 | 25.99 | 24.88 | 0.535 | 0.5734 | 0.7624 | 0.85 | ||
| D2 | 25.8 | 21.45 | 23.77 | 19.66 | 0.6444 | 0.5911 | 0.6563 | 0.84 | ||
| D3 | 23.66 | 18.32 | 18.75 | 20.35 | 0.4951 | 0.636 | 0.6588 | 0.72 | ||
| D4 | 10.36 | 21.34 | 22.77 | 15.83 | 0.8156 | 0.6623 | 0.7247 | 0.74 | ||
| D5 | 23.74 | 19.53 | 23.85 | 23.33 | 0.5728 | 0.5906 | 0.62 | 0.73 | ||
| UIQI | MSE | |||||||||
| Dataset | Fused | P1 | P2 | Proposed | P1 | P2 | Proposed | |||
| D1 | 0.4928 | 0.4747 | 0.4325 | 0.75 | 5.18E+02 | 163.66 | 211.38 | |||
| D2 | 0.6213 | 0.4653 | 0.587 | 0.74 | 465.56 | 272.78 | 701.84 | |||
| D3 | 0.4283 | 0.657 | 0.6404 | 0.7 | 956.23 | 865.58 | 599.84 | |||
| D4 | 0.6734 | 0.5307 | 0.6925 | 0.83 | 477.53 | 343.39 | 1.69E+03 | |||
| D5 | 0.5447 | 0.6882 | 0.622 | 0.77 | 723.37 | 267.58 | 301.62 | |||
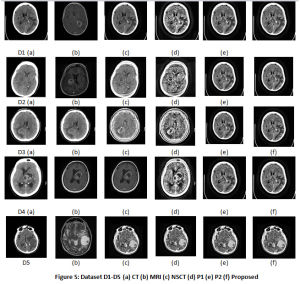 |
Figure 5: Dataset D1-D5 (a) CT (b) MRI (c) NSCT (d) P1 (e) P2 (f) Proposed |
Conclusion
A novel approach for combining CT and MRI images is proposed. By fusing enhanced CT and MRI images, the visual quality is greatly increased. The block size of 8×8 provides good results along with uniform distribution. The clip limit in range of 0-0.01 is adaptively chosen by PSO algorithm. Further, tumors can be conveniently segmented and classified efficiently, from the fused images. Experiments show superior results for contrast, structural information and entropy. Further, the technique can be applied for combining CT-PET images and MRI-PET images.
Acknowledgments
The authors would like to thank Dr.Sudhir Hegde, Dr. Rajesh and Medall Clumax, Bangalore for helping us in providing information about CT and MRI images.
Conflict of Interest
There is no conflict of interest.
Funding Source
The authors have not received any funding grant.
References
- Shuang Hu, Homan Kang, et al. Real Time Imaging of Brain for Image-Guided Surgery, Advanced Healthcare Materials, 2018.
- Brindle KM, Izquierdo-García JL, Lewis DY, Mair RJ, Wright AJ. Brain Tumor Imaging, Journal of Clinical Oncology: Official Journal of the American Society of Clinical Oncology,(2017), 35(21):2432-2438. DOI: 10.1200/jco.2017.72.7636.
- Miner, Robert C, Image-Guided Neurosurgery. Journal of Medical Imaging and Radiation Sciences, (2017), Vol. 48, Issue 4, pp.328 – 335.
- Rocha, L.G., & Júnior, E.A. Seeking tools for image fusion between computed tomography, structural and functional magnetic resonance methods for applications in neurosurgery, Einstein (São Paulo, Brazil).
- Leena Chandrashekar, A.Sreedevi. Assessment of Non-Linear Filters for MRI Images, Proceedings of Second IEEE International Conference on Electrical, Computer and Communication Technologies, 2017.
- Lu Tang, Chuangeng Tian, Kai Xu. Exploiting Quality- Guided Adaptive Optimization for Fusing Multimodal Medical Images, IEEE Access, 2019.
- K Zuiderveld. Contrast Limited Adaptive Histogram Equalization, in Graphics gems IV, pp474-485, San Diego, CA, USA, Academic Press Professional, Inc, 1994.
- Hardeep Kaur, Jyothi Rani. MRI brain image enhancement using Histogram equalization techniques, Proceedings of IEEE WISPNET, 2016.
- Luis G More, Macrcos A Brizuela et al. Parameter Tuning of CLAHE-based on Multi-Objective Optimization to Achieve Different Contrast Levels in Medical Images. Proceedings of IEEE International Conference on Image Processing (ICIP), 2015.
- James Kennedy and Russell Eberhart. Particle Swarm Optimization. Proceedings of International Conference on Neural Networks, 4, pp.1942-1948, 1995.
- Mehemet Zeki, Sarp Erturk. Enhancement of Ultrasound Images with Bilateral Filter and Rayleigh CLAHE. Proceedings of 23rd Signal Processing and Communications Applications Conference (SIU), Malatya, Turkey, 2015.
- Malik Braik, Alaa Sheta, Aladdin Ayesh. Image Enhancement Using Particle Swarm Optimization, Proceedings of World Congress on Engineering, Vol. 1, London, UK, 2007.
- Yin Fei, Gao Wei, Son Zongxi. Medical Image Fusion Based on Feature Extraction and Sparse Representation. Hindawi, International Journal of Biomedical Imaging, 2017.
- Kavitha, S., Thyagharajan, K.K. Efficient DWT-based fusion techniques using genetic algorithm for optimal parameter estimation. Soft Comput21, 3307–3316, 2017.
- Leena Chandrashekar, Sreedevi A, A Novel technique for fusing Multimodal and Multiresolution Brain Images. Proceedings of 7th International Conference on Advances in Computing and Communications, 2017.
- Huang, Hui, Xi’an Feng, and Jionghui Jiang. Medical image fusion algorithm based on nonlinear approximation of Contourlet transform and regional features. Journal of Electrical and Computer Engineering,
- Yadav, S.P., Yadav, S. Image fusion using hybrid methods in multimodality medical images, Med Biol Eng Comput,
- Dogra, A. & Patterh, M.S. CT and MRI brain images registration for clinical applications. Journal of Cancer Science and Therapy, Vol. 6, pp.18-26, 2014.
- Wan Rui and Li Minglu, An overview of medical image registration. Proceedings Fifth International Conference on Computational Intelligence and Multimedia Applications, ICCIMA, Xi’an, China, pp. 385-390, 2003.
- N. Do and M. Vetterli. The Contourlet transform: an efficient directional Multiresolution image representation. Trans. Img. Proc. Vol. 14, No.12, pp.2091–2106, 2005.
- da Cunha, Jianping Zhou, and M. N. Do. The Nonsubsampled Contourlet Transform: Theory, Design, and Applications. Trans. Img. Proc. Vol.15, No. 10, pp.3089–3101, 2006.
- Leena Chandrashekar, Sreedevi A. A Hybrid Multimodal Medical Image Fusion Technique for CT and MRI brain images. IGI Global International Journal of Computer Vision and Image Processing (IJCVIP), Vol. 8, Issue 3, 2018.
- Leena Chandrashekar, Sreedevi A. A Multimodal Image Fusion based on Non-Subsampled Contourlet Transform and Sparse Representation. STM Journal of Image Processing & Pattern Recognition Progress, Vol.5 (2). Pp.12-21, 2018.
- Leena Chandrashekar, A Sreedevi. A Multi Objective Enhancement Technique for Poor Contrast Magnetic Resonance Images of Brain Gliomablastomas. in Proceedings of Third International Conference on Computing and Network Communication, CoCoNet 2019.
- Prof Frank Gaillard et al. “Glioblastoma”,
- Clark K, Vendt B, Smith K, et al. The Cancer Imaging Archive (TCIA): maintaining and operating a public information repository. J Digit Imaging, Vol.26, No.6, pp.1045‐1057, 2013.

