
Manuscript accepted on :13-11-2019
Published online on: 25-12-2019
Plagiarism Check: Yes
Reviewed by: Dimitar Avtanski
Second Review by: Hassan Hassan Elsayyad
Final Approval by: Dr. Najam A Siddiqi
Inas R El- Alameey1*, Hanaa H Ahmed2, Rehab A Mahmoud3, Sahar A. Kairy4, and Eman A Medany5
1Child Health Department, National Research Centre, Egypt
2Hormones Department, National Research Centre, Egypt
3Medical Childhood Studies Department, College of Postgraduate Childhood Studies, Ain Shams University, Egypt
4Pediatric Department, National Nutrition Institute, Ministry of health, Egypt
5Pediatric Department, Aldoha Hospital, Ministry of health, Egypt
Corresponding Author E-mail: inasno@hotmail.com
DOI : https://dx.doi.org/10.13005/bpj/1795
Abstract
Obesity has become a serious health issue as it is associated with chronic low-grade inflammation and cardiovascular risk. Studies in adults proved that serum myeloperoxidase (MPO) is a potent mediator for cardiovascular diseases. This study was planned to assess serum MPO activity in obese children and adolescents to elucidate if MPO is linked with cardiovascular risk parameters. This research work was conducted on 90 subjects (50 obese and 40 controls of matched age and sex). Each group was classified into 2 subgroups according to tanner stage into prepubertal and pubertal. Clinical examination and anthropometric measures were performed for all subjects. Also serum MPO, glucose, insulin, CRP, and lipid panel were analyzed. Significant rise (P<0.05) in serum MPO, total cholesterol, triglycerides, LDL and a significant drop (P<0.01) in serum HDL values were recorded in the group of prepubertal, and pubertal obese individuals relative to controls. Serum MPO activity showed positive correlation with waist: hip ratio, body fat percentage, serum insulin, and HOMA-IR. While it revealed inverse correlation with basal metabolic rate. Linear regression indicated that serum MPO activity has a good association with cardiovascular risk parameters as BMI-z score, waist: hip ratio, serum insulin and HOMA-IR in both prepubertal, and pubertal obese subjects. The cut off value of MPO activity was 480 pg/ ml in pre-pubertal group with sensitivity of 85.8% and specificity of 71%, and 490 pg/ ml in pubertal group with sensitivity of 84.6 % and specificity of 59%. This study emphasized the elevated MPO activity in the serum of prepubertal, and pubertal obese individuals. Therefore, MPO could be considered as a potential link between obesity and cardiovascular complications in prepubertal, and pubertal population.
Keywords
Adolescents; Children; cardiovascular disease; Myeloperoxidase; Obesity
Download this article as:| Copy the following to cite this article: El- Alameey I. R, Ahmed H. H, Mahmoud R. A, Kairy S. A, Medany E. A. Significance of Myeloperoxidase in the Onset of Cardiovascular Disease among Obese Children and Adolescents. Biomed Pharmacol J 2019;12(4). |
| Copy the following to cite this URL: El- Alameey I. R, Ahmed H. H, Mahmoud R. A, Kairy S. A, Medany E. A. Significance of Myeloperoxidase in the Onset of Cardiovascular Disease among Obese Children and Adolescents. Biomed Pharmacol J 2019;12(4). Available from: https://bit.ly/34Wi2sz |
Introduction
Obesity in children has become a serious public health problem in many nations worldwide [1]. It is characterized by chronic inflammatory conditions as the visceral adipose tissue proinflammatory cells (macrophages) secrete various cytokines leading to accelerated development of atherosclerosis, hypertension, cardiovascular disease, insulin resistance and type II diabetes mellitus [2-4].
The link between obesity and chronic metabolic diseases is needed to be explained. Adipose tissue functions as an endocrine organ that secretes numerous biologically active substances, adipocytokines. The increase adipocytes number in the body of obese people leads to greater adipokines production and contributes to the development of metabolic syndrome [5-6]. Metabolic syndrome in the obese people is characterized by the presence of a number of related metabolic disorders such as dysregulation of lipid metabolism, hyperglycemia, insulin, hormone insensitivity, increased blood pressure and abdominal obesity. The mentioned metabolic disorders present significant risk factors for the occurrence of many complications. The constant increase in the number of obese people imposes the need for finding reliable biomarkers in routine diagnosis and also the assessment of the severity of metabolic disorders, as well as the possibility to predict the risks of any related complications [7-8].
Myeloperoxidase (MPO) is a member of the superfamily heme peroxidase contained in tissue macrophages and in azurophilic granules of leukocytes (mainly expressed in neutrophils and, to a lesser extent, in monocytes) [9]. It is an enzyme linked to oxidative stress, inflammation and cellular homeostasis. The MPO release by neutrophils and monocytes during inflammation plays essential role in the innate immune response as a bactericidal action, producing reactive oxygen species (ROS) which implicates the destruction of the engulfed pathogens [10]. In addition, myeloperoxidase plays an important role in the promotion and progression of cardiovascular diseases (CVD) and precipitates atherogenesis through oxidization of LDL (bad cholesterol), which then oxidizes HDL (good cholesterol) rendering it dysfunctional. This cascade of events ends up in inflammation linked to plaque formation within the artery wall [11].
MPO catalyzes the production of hypochlorous acid and other highly reactive species that may injury and reduce the elasticity of the arterial wall. Furthermore, by several mechanisms, MPO reduces the bioavailability of the endogenous vasodilator nitric oxide. These mechanisms may lead to hypertension [12]. Many studies have mentioned the elevated MPO activity in adults with obesity [13-14]. In addition, some research have displayed that MPO is increased in children with type I Diabetes mellitus [15] and hypercholesterolemia [16]. Therefore, this study was undertaken to assess serum MPO activity in obese children and adolescents, to clarify if MPO is associated with cardiovascular risk parameters.
Subjects and Methods
Subjects
Sample size
The sample size in this study was calculated to assess of the risk factors probably affecting serum activity of myeloperoxidase in obese children and adolescents. The sample size was calculated by Open Epi sample size calculator. The calculation based on a confidence interval of 95%, and power 80%.
Study design
This descriptive comparative case-control study included 90 Egyptian subjects; 50 obese (group Ι) who attended to the Pediatric Nutrition Outpatient Clinic, National Nutrition Institute, Ministry of Health, Cairo, Egypt and 40 healthy non-obese controls (group ΙΙ) of matched age and sex. Each group was further distributed into 2 subgroups according to Tanner stage into prepubertal and pubertal.
Criteria of selection
Obese patients were selected according to the inclusion and exclusion criteria. Inclusion criteria included children and adolescents with simple obesity. The age of our patients was between 8-15 years old. Exclusion criteria included chronic illness, endocrinal or genetic causes of obesity, and those used medications that affect blood pressure, lipid profile or glucose level, and thus their high-sensitivity C-reactive protein (hs-CRP) became not more than 5 mg/L.
Obese children were diagnosed as having metabolic syndrome if they met at least three of the conditions listed below: (1) triglycerides level >150 mg/dl; (2) HDL-cholesterol level <40 mg/dl; (3) fasting blood glucose >110 mg/dl; (4) waist circumference > 90th percentile for age and sex; and (5) systolic and diastolic blood pressures >90th percentile according to age, sex and height [17].
Standard protocol approval and consents
This study was approved by the Research Ethics Committee of Institute of Postgraduate Childhood Studies; Ain Shams University with ethical number 22.3.2015. Written consent was taken from the parents of the children and ascent from children after explanation of the aim of the study and its benefits according to Ethical Committee regulations.
Methods
All children and adolescents were subjected to full personal, past history for systemic diseases, and family history of obesity, diabetes, cardiovascular diseases, and hypertension. Detailed medical history and assessment, physical examination and anthropometric evaluations were performed to all subjects.
Anthropometric measurements
Anthropometric parameters were measured by a single examiner with the cases barefoot (18). Using standardized procedures, body weight, height, waist and hip circumference were evaluated (19-20). Weight was measured with an approved SECA scale with a precision of 50 g and periodic calibration. Children were weighed with a minimal dress and the weight was recorded to the last 100 g. Height (without shoes) was measured with a Holtain’s stadiometer with a precision of 0.1 cm and registered with an approximation of 0.5 cm. Waist circumference (WC) was measured midway between the superior border of the iliac crest and the lowermost margins of the ribs at the end of normal expiration.
BMI was calculated as weight (kg) divided by the square of the height (m2). Obesity was identified according to BMI, with the age-and sex-specific cutoff points proposed by the International Obesity Taskforce (linked to adult cutoffs of 30 kg/m2) (21). Percentage of body fat and basal metabolic rate were assessed by a body composition analyzer Model TBF-215 TANITA (TANITA Corporation of America, Arlington Heights, IL, USA). The pubertal stage was determined in each patient according to the Tanner criteria [22].
Blood pressure measurement
Subjects had rested for 5 minutes in a sitting position before the measurement of systolic (SBP) and diastolic (DBP) blood pressure. Both systolic and diastolic BP was measured three times by the same examiner with a mercury sphygmomanometer according to International Recommendations. Hypertension was defined as SBP >140 mm Hg or DBP > 90 mm Hg, according to criteria described in the 7th Report of the Joint National Committee on Prevention, Detection, Evaluation, and Treatment of High Blood Pressure [23].
Laboratory determinations
Routine analyses
Venous blood samples were withdrawn from all participants after an overnight fast, and the separated sera were stored at −20°C. Fasting serum glucose was measured by standard colorimetric procedures. Serum triglycerides, cholesterol, high-density lipoprotein (HDL), low-density lipoprotein (LDL) were measured by the colorimetric method using Bio-diagnostic kit (Cairo, Egypt). Serum insulin level was evaluated using an ELISA kit purchased from Glory Bioscience (USA) under the guidance of the manufacturer. The Homeostasis Model Assessment (HOMA) of insulin resistance (HOMA-IR) was calculated according to this equation: Fasting glucose (mg/dl) x fasting insulin (uIU/ml) /405 [24]. Children without type II diabetes were considered insulin resistant if they had a Homeostasis Model Assessment of Insulin Resistance (HOMA-IR) score, an estimate of insulin resistance determined from fasting insulin and glucose values, ≥3.99 [25].
Cardiovascular risk and inflammatory analyses
Quantitative determination of serum MPO enzyme activity was performed using ELISA kit obtained from Glory Bioscience, (USA), according to the manufacturer’s manual. High Sensitive-CRP (Hs-CRP) as a marker of systemic inflammation and future cardiovascular events was measured by turbidimetry (Biosystems). Its cut off point was 3 mg/l [26].
Statistical analysis
The results were analyzed using the statistical package for the social sciences (SPSS), version 23 computer program (SSPS Inc, Chicago, USA), and the data were presented as Tables and Figures. Normal distribution of variables was verified with a Kolmogorov– Smirnov test. The parametric variables were expressed as mean ± SD. To compare anthropometric measures and serum myeloperoxidase activity between groups, Student’s t-test was used. Categorical data were expressed as frequencies and percentages and analyzed using the two-tailed Chi-square test. Pearson’s correlation coefficient was used to assess the association between serum myeloperoxidase activity, anthropometric measures, and laboratory variables. As the activity of myeloperoxidase had a normal distribution, linear regression analysis was used to estimate the effects of different risk factors as age (years), anthropometric measures, lipid profiles, fasting glucose, and serum insulin in potentially changing of the serum myeloperoxidase activity. A receiver operating characteristic (ROC) curve analysis was carried out to estimate the cut off values of serum myeloperoxidase activity with the highest sensitivity, specificity and area under the curve (AUC) for early detection of cardiovascular and metabolic risk among the obese subjects. P<0.05 was considered significant and P<0.001 was considered highly significant.
Results
The case group consisted of 50 obese subjects (21 male and 29 female), with a mean age of 11.9±3.3 years (range 8 to 15 years). Acanthosis nigricans was present in 40% of cases. Positive family history of hypertension was present in 50% cases, diabetes mellitus in 42%, obesity in 22% and hypercholesterolemia and cardiovascular diseases in 16%. Table (1) showed a positive family history of chronic diseases and the presence of acanthosis nigricans in the case group.
Table 1: Descriptive clinical data of obese subjects and controls.
| Variables | Cases group
No (%) |
Control group
No (%) |
|
| Positive family history
|
Obesity
Type II diabetes Hypertension High cholesterol CV disease. |
11 (22%).
21 (42%). 25 (50%). 11 (22%) 8 (16%) |
0 (0%)
0 (0%) 0 (0%) 0 (0%) 0 (0%) |
| Acanthosis nigricans | 20 (40%) | 0 (0%) |
No significant difference was found between males and females obese individuals regarding blood pressure, weight for age, BMI for age z-scores, waist, and hip circumferences, and W/H ratio, serum levels of CRP, lipid profile, glucose, insulin, HOMA- IR and MPO activity (Table 2).
Table 2: Comparison between males and females in obese group regarding anthropometric measures, blood pressure, and laboratory markers.
| Variables | Total
(N=50) |
Male group
(N=21) |
Female group
(N=29) |
P |
| Height for age z-score | -0.23±0.87 | -0.53±0.74 | -0.01±0.90 | 0.034* |
| Weight for age z-score | 2.42±0.61 | 2.43±0.63 | 2.41±0.60 | 0.899 |
| BMI for age z-score | 2.61±0.47 | 2.67±0.47 | 2.56±0.48 | 0.399 |
| Waist circumferences | 99.8±11.3 | 98.7±12.0 | 100.6±10.9 | 0.576 |
| Hip circumferences | 118.1±12.4 | 115.1±14.0 | 120.2±10.8 | 0.147 |
| Waist :Hip ratio | 0.86±0.04 | 0.86±0.05 | 0.87±0.04 | 0.687 |
| SBP for age z-score | 0.44±0.59 | 0.39±0.63 | 0.48±0.57 | 0.587 |
| DBP for age z-score | 0.54±0.59 | 0.49±0.66 | 0.58±0.53 | 0.616 |
| Serum cholesterol (mg/dl) | 165.8±41.4 | 156.4±30.9 | 172.7±46.9 | 0.174 |
| Serum triglycerides (mg/dl) | 105.7±25.8 | 102.3±29.3 | 108.1±23.2 | 0.442 |
| Serum LDL (mg/dl) | 88.6±29.5 | 83.6±33.7 | 92.2±26.1 | 0.315 |
| Serum HDL (mg/dl) | 4e0.9±9.5 | 41.7±10.6 | 40.4±8.8 | 0.650 |
| Fasting glucose (mg/dl) | 85.2±12.8 | 85.0±13.8 | 85.3±12.3 | 0.941 |
| Serum insulin (mmol/l) | 21.6±5.5 | 22.5±4.3 | 21.0±6.2 | 0.357 |
| HOMA-IR | 4.63±1.46 | 4.76±1.08 | 4.54±1.70 | 0.601 |
| Serum MPO (pg/ml) | 535.3±16.2 | 535.8±16.8 | 535.0±16.0 | 0.858 |
| Serum CRP≥ 3.0 | 9 (18.0%) | 6 (28.6%) | 3 (10.3%) | 0.160 |
| Metabolic syndrome | 41 (82.0%) | 15 (71.4%) | 26 (89.7%) | 0.140 |
*Significant difference at P < 0.05.
Both systolic and diastolic blood pressures, anthropometric measures as weight, BMI for age z-score, waist, and hip circumferences, W/H ratio, and fat percentage were significantly higher, while basal metabolic rate was significantly lower in obese pubertal group and obese prepubertal group versus control group as shown in Table (3).
Table 3: Anthropometric parameters, and blood pressure among the studied groups.
|
Variables |
Control prepubertal
(N=13) |
Control
pubertal (N=12) |
Obese
prepubertal (N=25) |
Obese pubertal
(N=25) |
F value | P | |
| Height for age
z-score |
Mean±SD | -0.21±0.70 | -0.60±0.23 | -0.04±0.73 | -0.42±0.96 | 1.856 | 0.145 |
| Weight for age
z-score |
Mean±SD | -0.18±0.50 | -0.49±0.14 | 2.55±0.61 | 2.29±0.59 | 137.518 | <0.001** |
| BMI for age
z-score |
Mean±SD | -0.07±0.28 | -0.29±0.51 | 2.73±0.28 | 2.49±0.59 | 218.893 | <0.001** |
| Waist circumference
(cm) |
Mean±SD | 73.6±3.9 | 83.3±3.4 | 110.0±10.1 | 126.1±8.7 | 156.899 | <0.001** |
| Hip circumference
(cm) |
Mean±SD | 73.6±3.9 | 83.3±3.4 | 110.0±10.1 | 126.1±8.7 | 156.899 | <0.001** |
| W:H ratio | Mean±SD
|
0.75±0.03 | 0.76±0.02 | 0.85±0.05 | 0.87±0.03 | 52.649 | <0.001** |
| Fat percentage | Mean±SD
|
32.41±5.53 | 36.41±5.53 | 50.96±5.37 | 55.96±5.37 |
-7.57 |
<0.001** |
| Basal metabolic rate | Mean±SD | 1759±231.02 | 1659±221.0 | 1422±191 | 1322±191 |
-4.32 |
<0.001** |
| SBP
z-score |
Mean±SD | -0.32±0.59 | -0.11±0.23 | 0.48±0.62 | 0.40±0.57 | 8.153 | <0.001** |
| DBP
z-score |
Mean±SD | -0.15±0.42 | -0.12±0.39 | 0.58±0.66 | 0.51±0.52 | 8.901 | <0.001** |
ANOVA test with post hoc Tukey test. *Significant difference at P < 0.05, **highly significant difference at P ≤ 0.01
Serum MPO activity, and serum levels of cholesterol, triglycerides, LDL, insulin, and insulin resistance were significantly higher, while HDL was significantly lower in the obese pubertal group and obese prepubertal group versus the control group. No significant difference was found between the obese pubertal group and the obese prepubertal group as regards fasting glucose, and CRP levels as shown in (Table 4).
Table 4: Serum myeloperoxidase, hs-CRP, lipid profile, glucose, insulin, and insulin resistance values among the studied groups.
| Variables | Control Prepubertal group
(N=13) |
Control Pubertal group
(N=12) |
Obese Prepubertal
Group (N=25) |
Obese Pubertal
group (N=25) |
F | P | ||
| Serum cholesterol
(mg/dl) |
Mean±SD | 127.0±9.2 | 129.1±9.7 | 164.6±40.2 | 167.0±43.3 | 6.601 | <0.001** | |
| Range | 101.0–139.0 | 115.0–140.0 | 106.0–258.0 | 115.0–312.0 | ||||
| Serum triglyerides
(mg/dl) |
Mean±SD | 70.4±16.5 | 72.4±9.0 | 106.7±25.3 | 104.6±26.8 | 12.662 | <0.001** | |
| Range | 43.0–94.0 | 61.0–87.0 | 60.0–156.0 | 68.0–158.0 | ||||
| Serum LDL
(mg/dl) |
Mean±SD | 55.0±7.8 | 53.8±9.4 | 86.6±28.7 | 90.6±30.7 | 10.565 | <0.001** | |
| Range | 43.0–71.0 | 43.0–64.0 | 34.0–167.0 | 38.0–197.0 | ||||
| Serum HDL
(mg/dl) |
Mean±SD | 56.7±4.7 | 59.3±4.1 | 40.2±8.4 | 41.7±10.6 | 23.970 | <0.001** | |
| Range | 51.0–65.0 | 54.0–66.0 | 23.0–54.0 | 25.0–59.0 | ||||
| Serum glucose
(mg/dl) |
Mean±SD | 82.3±7.2 | 82.5±5.1 | 85.4±11.9 | 85.0±13.9 | 0.341 | <0.001** | |
| Range | 68.0–90.0 | 78.0–92.0 | 67.0–105.0 | 64.0–112.0 | ||||
| Serum insulin | Mean±SD | 15.6±1.0 | 15.2±0.7 | 20.8±2.7 | 22.5±7.2 | 11.199 | <0.001** | |
| Range | 13.0–16.7 | 13.6–16.0 | 18.0–28.0 | 12.8–36.0 | ||||
| HOMA-IR | Mean±SD | 3.21±0.32 | 3.12±0.24 | 4.44±0.88 | 4.83±1.88 | 8.488 | <0.001** | |
| Range | 2.67–3.62 | 2.90–3.60 | 3.35–6.58 | 2.24–9.09 | ||||
| Serum MPO
(pg/ml) |
Mean±SD | 431.4±27.7 | 439.4±14.4 | 526.9±13.6 | 543.8±14.2 | 195.018 | <0.001** | |
| Range | 350.0–460.0 | 425.0–465.0 | 500.0–560.0 | 514.0–569.0 | ||||
| Hs-CRP (mg/dl) | ≥ 3.0 | 0 (0.0%) | 0 (0.0%) | 4 (16.0%) | 6 (24.0%) | 0.906 | 0.098 | |
| < 3.0 | 13 (100.0%) | 12 (100.0%) | 21 (84.0%) | 19 (76.0%) | ||||
ANOVA test with post hoc Tukey test. *Significant difference at P < 0.05, **highly significant difference at P ≤ 0.01
Serum MPO activity, cholesterol, triglycerides, LDL, insulin, insulin resistance, and CRP levels were significantly higher, while HDL was significantly lower in cases with metabolic syndrome versus those without metabolic syndrome, and control group (Table 5).
Table 5: Comparison between the obese group with and without metabolic syndrome (MS) and control group as concerning age, anthropometric measures, blood pressure, and biochemical markers (ANOVA).
| Variables | MS obese group
(N=29) |
Non MS obese group
(N=21) |
Control
group (N=25) |
F | P | ||||
| Age (years) | 11.4±3.1 | 12.5±3.5 | 12.1±3.9 | 0.566 | 0.571 | ||||
| Anthropometric measures | |||||||||
| Height for age z-score | 0.00±0.75 | -0.54±0.94 | -0.40±0.56 | 3.497 | 0.036* | ||||
| Weight for age z-score | 2.54±0.59 | 2.25±0.60 | -0.33±0.47 | 203.681 | <0.001** | ||||
| BMI for age z-score | 2.69±0.46 | 2.49±0.48 | -0.18±0.41 | 318.610 | <0.001** | ||||
| Waist circumferences | 99.5±10.3 | 100.2±12.8 | 58.6±5.3 | 147.187 | <0.001** | ||||
| Hip circumferences | 118.7±11.3 | 117.2±14.0 | 78.3±6.1 | 113.594 | <0.001** | ||||
| Waist :Hip ratio | 0.87±0.05 | 0.86±0.04 | 0.75±0.02 | 73.670 | <0.001** | ||||
| Blood pressure | |||||||||
| SBP for age z-score | 0.37±0.60 | 0.54±0.58 | -0.22±0.46 | 12.538 | <0.001** | ||||
| DBP for age z-score | 0.44±0.54 | 0.69±0.63 | -0.14±0.40 | 15.308 | <0.001** | ||||
| Biochemical markers | |||||||||
| Serum Cholesterol (mg/dl) | 179.5±47.5 | 147.0±19.8 | 128.0±9.3 | 18.114 | <0.001** | ||||
| Serum triglycerides (mg/dl) | 113.2±28.1 | 95.2±18.2 | 71.4±13.2 | 25.742 | <0.001** | ||||
| Serum LDL (mg/dl) | 95.8±32.6 | 78.7±21.6 | 54.4±8.4 | 20.305 | <0.001** | ||||
| Serum HDL (mg/dl) | 37.4±9.7 | 45.9±6.7 | 58.0±4.5 | 50.919 | <0.001** | ||||
| Fasting blood glucose (mg/dl) | 86.9±14.3 | 82.8±10.3 | 82.4±6.1 | 1.376 | 0.259 | ||||
| Serum Insulin (mmol/l) | 21.0±5.6 | 22.6±5.2 | 15.4±0.9 | 16.801 | <0.001** | ||||
| HOMA-IR | 4.61±1.68 | 4.66±1.15 | 3.17±0.28 | 12.038 | <0.001** | ||||
| Serum MPO (pg/ml) | 533.4±16.4 | 538.1±15.9 | 435.2±22.2 | 246.679 | <0.001** | ||||
| Hs-CRP≥ 3.0 | 6 (20.7%) | 4 (19.0%) | 0 (0.0%) | 6.678 | 0.028* | ||||
ANOVA test with post hoc Tukey test. *Significant difference at P < 0.05, **highly significant difference at P≤ 0.01
Serum MPO activity is positively correlated with waist: hip ratio, fat percentage, serum insulin, and HOMA-IR, while it is negatively correlated with BMR in the obese group as shown in Table (6).
Table 6: Correlations of serum myeloperoxidase activity in obese groups.
| Anthropometric variables | Obese group | Laboratory variables | Obese group | ||
| r | p | r | p | ||
| Weight for age z-score | -0.239 | 0.095 | Serum cholesterol (mg/dl) | -0.059 | 0.683 |
| BMI for age z-score | -0.251 | 0.079 | Serum triglycerides (mg/dl) | -0.182 | 0.205 |
| Waist: hip ratio | 0.581 | <0.001* | Serum LDL (mg/dl) | -0.056 | 0.697 |
| Fat percentage | 0.842 | <0.001* | Serum HDL (mg/dl) | 0.138 | 0.341 |
| BMR | -0.557 | <0.001* | Fasting glucose (mg/dl) | -0.107 | 0.459 |
| SBP for age z-score | -0.192 | 0.182 | Serum insulin (mmol/l) | 0.662 | <0.001** |
| DBP for age z-score | -0.043 | 0.765 | HOMA-IR | 0.469 | <0.001** |
Pearson correlation, r: Correlation coefficient, *Significant. *Significant difference at P < 0.05, **highly significant difference at P≤ 0.01
According to the receiver-operating characteristics (ROC) curve, serum MPO activity revealed significant perfect diagnostic performance in differentiating prepubertal and pubertal obese groups from the control group. Cutoff points (480.0 and 490.0) can perfectly classify prepubertal and pubertal obese group respectively from the control group with a sensitivity of 85.8% and specificity of 71% in pre-pubertal group, and sensitivity of 84.6 % and specificity of 59% in pubertal group Tables (7, and 8) and Figure (1).
Table 7: Diagnostic performance of MPO activity in differentiating obese from non-obese in prepubertal and pubertal groups.
| Time | AUC | SE | P | 95% CI | Cutoff |
| Prepubertal | 1.000 | 0.000 | <0.001* | 0.500–1.000 | 480.0 |
| Pubertal | 1.000 | 0.000 | <0.001* | 0.500–1.00 | 490.0 |
AUC: Area under curve, SE: Standard error, CI: Confidence interval, *Significant difference at P < 0.05, **highly significant difference at P≤ 0.01
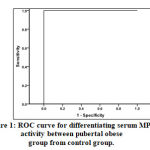 |
Figure 1: ROC curve for differentiating serum MPO activity between pubertal obese group from control group.
|
Table 8: Diagnostic characteristics of serum MPO cutoff points in differentiating obese groups from control group.
| Characters | Prepubertal group
(serum MPO≥480.0) |
Pubertal group
(serum MPO≥490.0) |
||
| Value | 95% CI | Value | 95% CI | |
| Sensitivity | 100.0% | 85.8%–100.0% | 100.0% | 84.6%–100.0% |
| Specificity | 100.0% | 71.5%–100.0% | 100.0% | 59.0%–100.0% |
| Diagnostic accuracy (DA) | 100.0% | 90.0%–100.0% | 100.0% | 88.1%–100.0% |
| Youden’s index | 100.0% | 100.0%–100.0% | 100.0% | 100.0%–100.0% |
| Positive predictive value (PPV) | 100.0% | 85.8%–100.0% | 100.0% | 84.6%–100.0% |
| Negative predictive value (NPV) | 100.0% | 71.5%–100.0% | 100.0% | 59.0%–100.0% |
| Kappa | 1.00 | 1.00–100.0% | 1.00 | 1.00–100.0% |
CI: Confidence interval
Linear regression analysis of MPO activity with the implicated risk factors was performed to evaluate whether these factors (BMI for age z-score, waist: hip ratio, fat percentage, BMR, lipid profile and serum HOMA- IR) were dependent on MPO or not. This analysis showed that BMI for age z score, waist/hip ratio, fat percentage, and serum HOMA-IR are dependently correlated with serum MPO and are considered as risk factors of high serum MPO activity in the obese group (Table 9).
Table 9: Linear regression for factors affecting serum MPO activity in obese group.
| Time | β | SE | Adjusted β | t | P | 95% CI |
| Constant | 388.435 | 37.948 | 10.236 | <0.001* | 311.854–465.017 | |
| BMI-z | -8.919 | 3.692 | -0.262 | -2.416 | 0.020* | -16.371–-1.468 |
| W/H ratio | 195.279 | 44.653 | 0.520 | 4.373 | <0.001** | 105.166–285.391 |
| Fat percentage | 1.077 | 0.66 | 0.782 | 6.415 | <0.001** | 31.854–45.017 |
| BMR | 0.019 | 0.47 | 0.79 | 0.413 | 0.684 | -0.238–0.079 |
| Serum Cholesterol (mg/dl) | 0.026 | 0.060 | 0.066 | 0.431 | 0.669 | -0.095–0.146 |
| Serum triglycerides (mg/dl) | -0.079 | 0.078 | -0.127 | -1.010 | 0.318 | -0.238–0.079 |
| Serum LDL (mg/dl) | -0.089 | 0.072 | -0.163 | -1.234 | 0.224 | -0.236–0.057 |
| Serum HDL (mg/dl) | -0.033 | 0.188 | -0.019 | -0.176 | 0.861 | -0.413–0.347 |
| HOMA-IR | 3.230 | 1.306 | 0.292 | 2.472 | 0.018 | 0.593–5.866 |
| R2 | 0.530 | |||||
Total=50, β: Area under curve, SE: Standard error, CI: Confidence interval, R2: Coefficient of determination, *Significant difference at P < 0.05, **highly significant difference at P≤ 0.01
Discussion
The prevalence of obesity in children has alarmingly increased globally. The United States carries the highest percentage of obese children at 13 percent (23-24). This compares to 10.2 percent in Egypt, according to the study reported by the Seattle-based Institute for Health Metrics and Evaluation (IHME) (25). This demands attention because obesity in children is more likely to develop into obesity in adulthood leading to the onset of cardiovascular risk factors, like changes in lipid panel (26) and aberrant glucose tolerance, which implicate in atheroma plaque development and result in the development of coronary heart disease in adult life (27-28).
Metabolic syndrome describes a collection of factors with a metabolic origin, such as obesity, hypertriglyceridemia, low HDL-cholesterol, arterial hypertension and glucose metabolism disorders, which are associated with cardiovascular diseases and type II diabetes mellitus (13), (29). In our present study, metabolic syndrome was present in 58% out of 50 cases. Thus, the link between obesity and chronic metabolic diseases is needed to be explained. This study was planned to assess serum MPO activity in obese children and adolescents to recognize if MPO activity is associated with cardiovascular risk parameters.
In the present study, the frequency of family history of obesity has been found in 22%. This finding showed a difference from the study of Wada et al. (30), who found that obese cases have a family history of obesity in 46.94%. Regarding the family history of chronic diseases, this study revealed that type II diabetes in 21 (42%), families, hypertension in 25 (50%), high cholesterol in 11 (22%) and cardiovascular diseases in 8 families (16%) of the studied patients. These findings showed similarity with Flegal et al. (31), and Wada et al. (30) who reported the strong association between family history of diabetes, hypertension and obesity. These investigators also commented on the importance of positive family history in the assessment of health risks in obese children.
Of note, on examination of the cases in the present study, acanthosis nigricans has been found in 20 obese cases (40%). It is the most common dermatologic manifestations of obesity and hyperinsulinism over the neck and axilla (32).
Our present study revealed that weight, and BMI for age z-scores, fat percentage, waist, and hip circumferences, and W/H ratio were significantly higher in obese pubertal and pre-pubertal groups versus control group. Whereas basal metabolic rate was significantly lower in obese pubertal and pre-pubertal groups versus the control group which is in agreement with Lazzer et al. (33) who reported lower resting metabolic rate of obese versus control children.
Both systolic and diastolic blood pressures were significantly higher in the obese groups (prepubertal and pubertal) when compared to the control counterparts. Similar results have been obtained by Sukhonthachit et al. (34), and Sangun et al. (35) who reported higher blood pressure in obese pubertal and pre-pubertal groups versus the control group. Therefore, attention should be given to monitoring blood pressure in obese children and adolescents.
Dyslipidemia is usually present in people with obesity, and it is represented by high serum triglycerides and LDL-cholesterol, and low HDL-cholesterol levels. It plays an important role in the development of atherosclerosis and cardiovascular diseases in obese children. Moreover, these children will suffer from hypercholesterolemia in adulthood (36). The drop in the serum level of HDL-cholesterol seems to be a risk factor for the development of the cardiovascular pathological changes as it has a key role in the cholesterol metabolism, besides its anti-inflammatory and atheroprotective effects (37).
Results of the current study showed that serum total cholesterol, triglycerides and LDL levels are significantly higher and the HDL-cholesterol level is significantly lower in obese pubertal and pre-pubertal groups relative to controls (38). This comes in line with the results of Friedemann et al. (39), who mentioned that the obese people have enhanced serum LDL, cholesterol, and triglycerides levels and suppressed serum HDL-cholesterol level compared with the lean children. The elevated serum levels of LDL-cholesterol and depressed levels of the HDL-cholesterol represent a higher risk for cardiovascular diseases.
Excess body fat causes insulin resistance which triggers the metabolic disorders that comprise metabolic syndrome (40). Insulin resistance is accounted for as a powerful predictor for metabolic syndrome. It is considered as the link between glucose metabolism and metabolic syndrome. Therefore of insulin resistance value provides an early indicator for the prediction of type II diabetes. Even in the absence of hyperglycemia or diabetes, insulin resistance represents a great risk factor for cardiovascular diseases and early death (41). In the current study, serum insulin, and HOMA-IR are significantly increased in obese pubertal and pre-pubertal groups relative to controls. These findings agree with Romualdo et al. (40), and Selim et al. (41) who stated that insulin resistance is significantly increased in the obese people compared with controls.
Children with obesity showed proinflammatory and proatherogenic alterations accompanied with cardiovascular diseases in adults, including elevated C-reactive protein (CRP) plasma levels (42- 43). Many research studies indicated that obesity is the main predictor of elevated hs-CRP blood levels. Ebrahimi et al. (44) cited that elevated hs-CRP levels constitute a predictive indicator for the development of the metabolic syndrome, while Maffeis et al. (45) proved increased serum CRP levels in children indicate future risks of coronary artery disease. Xu et al. (46) mentioned that there is a significant increase in CRP in prepubertal obese children. Our results revealed that the serum levels of CRP as the proinflammatory factor is significantly higher in obese pubertal and prepubertal groups versus controls.
Myeloperoxidase (MPO) enzyme activity has been found to be related to obesity and is an independent risk factor for atherosclerotic cardiovascular disease (47). It was used as an adjuvant marker for the inflammatory and oxidative status in obese women (48-49). The findings of the current study revealed increased serum MPO activity in the obese group with metabolic syndrome compared to the obese group without metabolic syndrome and control group, as well as in obese pubertal and prepubertal groups relative to controls. These findings fit those obtained by Zur et al. (9) who registered a significant increase in MPO activity in obese subjects with respect to those with optimal body weight. Andrade et al. (50) study recorded significant elevation in MPO activity in obese versus normal weight women. Olza et al. (47) examined normal and overweight weight children and concluded that MPO activity may be an early marker for the development of cardiovascular disease in prepubertal obese children.
The increased MPO activity in obese subjects indicates that an inflammatory condition is associated with obesity. The role of MPO in the stimulation of pathological changes implicated in the development of atherosclerotic alterations and coronary artery disease has been documented by many studies (51–52).
Monitored inflammatory markers in the blood of obese subjects MPO activity and hs-CRP levels may have a significant value in the prevention of the development of cardiovascular disease in these subjects (53). In particular, MPO is considered as a potent indicator for the promotion of new therapeutic modalities that would delay the appearance of cardiovascular complications in obese patients (54).
The present work proved a positive correlation between MPO and waist: hip ratio, fat percentage, serum insulin and insulin resistance among obese children (prepubertal and pubertal). Olza et al. (47) demonstrated significant correlations of MPO, HOMA-IR with the anthropometric, metabolic, inflammatory, and cardiovascular risk variables in prepubertal children. García et al. (55) also proved that serum insulin, HOMA-IR, and MPO are correlated in pubertal adolescents. In obese women, Zaki et al. (49) reported that MPO is positively associated with IR.
Our study didn’t prove the correlation between MPO, and fasting serum glucose level in obese children or significant statistical difference between obese and controls, which fit results reported by Agarwal et al. (56) who found normal glucose blood level in group with more body fat and normal group.
Linear regression analysis was done to evaluate whether these factors (BMI for age z-score, W/H ratio, body fat percentage, BMR, lipid profile and HOMA- IR) are dependent on MPO or not. This analysis showed that BMI for age z-score, W/H ratio and HOMA-IR are dependently associated with MPO, and are considered as risk factors of high serum MPO activity in obese children. This finding coincides with that of Agarwal et al. (56), who mentioned that the best predictor for MPO is HOMA-IR in adults.
According to the receiver-operating characteristics (ROC) curve, MPO is a good predictor of obesity as analysis of the ROC curve showed values 480.0 in the prepubertal group and 490.0 in the pubertal group. These values are considered to be higher than the study of Zaki et al. (49) which mentioned that MPO shows significant cutoff points values of 322 pmol/L in obese women.
In our present study, no significant difference is found between males and females obese children as regards blood pressure, anthropometric measures, serum levels of CRP, lipid profile, glucose, insulin, HOMA- IR and MPO activity. Up to our knowledge, no studies until now discuss the relation between serum MPO activity and gender in obese children.
Conclusions: The outcomes of the present study confirmed the elevated serum MPO activity of prepubertal, and pubertal obese individuals. The association linking the high serum MPO activity with high body fat percentage, increased BMI for age z- score, waist: hip ratio and low basal metabolic rate suggested the important role of MPO in inflammation, oxidative stress, initiation and progression of insulin resistance in obese subjects which in turn leads to the development of cardiovascular diseases. Therefore, MPO could be considered as a potential link between obesity and cardiovascular complications in the prepubertal, and pubertal population.
Conflict of Interest
The authors have declared that no existence of competing interests.
Funding source
There is no funding source
References
- Berrington de Gonzalez A, Hartge P, Cerhan JR, Flint AJ, Hannan L, MacInnis RJ: Body-mass index and mortality among 1.46 million white adults. N Engl J Med 2010; 363(23): 2211–9.
CrossRef - Gregor MF, Hotamisligil GS: Inflammatory mechanisms in obesity. Annu Rev Immunol 2011;29:415–445
CrossRef - Wensveen FM, Valenti S, [estan M, Turk Wensveen T, Poli B: The »Big Bang« in obese fat: Events initiating obesity-induced adipose tissue inflammation. Eur J Immunol 2015; 45(9): 2446–56.
CrossRef - Johnson AR, Milner JJ, Makowski L: The inflammation highway: metabolism accelerates inflammatory traffic in obesity. Imunol Rev 2012; 249(1): 2018–38.
CrossRef - van der Veen BS, de Winther MP, Heeringa P. Myeloperoxidase: molecular mechanisms of action and their relevance to human health and disease. Antioxid Redox Signal 2009;11:2899–2937
CrossRef - Lau D, Baldus S: Myeloperoxidase and its contributory role in inflammatory vascular disease. Pharmacol Ther 2006; 111:16–26
CrossRef - Nicholls SJ, Hazen SL: Myeloperoxidase and cardiovascular disease. Arterioscler Thromb Vasc Biol 2005; 25(6): 1102–11.
CrossRef - Schindhelm RK, Van der Zwan LP, Teerlink T, Scheffer PG: Myeloperoxidase: a useful biomarker for cardiovascular disease risk stratification? Clin Chem. 2009;55:1462–1470.
CrossRef - Zur B, Look M, Holdenrieder S, Stoffel- Wagner B: Elevated plasma myeloperoxidase concentration in adults with obesity. Clin Chim Acta 2011; 412:1891–1892
CrossRef - Andrade VL, Petruceli E, Belo VA, et al: Evaluation of plasmatic MMP-8, MMP-9, TIMP-1 and MPO levels in obese and lean women. Clin Biochem 2012;45: 412–415
CrossRef - Heilman K, Zilmer M, Zilmer K, et al: Arterial stiffness, carotid artery intima-media thickness and plasma myeloperoxidase level in children with type 1 diabetes. Diabetes Res Clin Pract 2009;84:168–173
CrossRef - Pignatelli P, Loffredo L, Martino F, et al: Myeloperoxidase overexpression in children with hypercholesterolemia. Atherosclerosis 2009; 205: 239–24.
CrossRef - Miranda PJ, De Fronzo RA, Califf RM, Guyton JR: Metabolic syndrome: Definition, pathophysiology, and mechanisms. Am Heart J 2015;149: 33-45.
CrossRef - Lohman, TG, Roche AF, Martorell R: Anthropometric standardization reference manual. Champaign, IL: Human kinetics Publishers, 1988.
CrossRef - Centers for Disease Control and Prevention. Weight, height, and BMI growth charts. Available from: http://www.cdc.gov/growthcharts/(cited 18 January 2009)
CrossRef - Panoulas VF, Ahmad N, Fazal AA, et al: The inter-operator variability in measuring waist circumference and its potential impact on the diagnosis of the metabolic syndrome. Postgrad Med J. 2008;84 (993):344-7.
CrossRef - Cole TJ, Bellizzi MC, Flegal KM, Dietz WH: Establishing a standard definition for child overweight and obesity worldwide: international survey. BMJ 2000;320: 1240–1243
CrossRef - Marshall W & Tanner J : Variations in the pattern of pubertal changes in boys. Archives of Disease in childhood; 1970; 45, 13–23.
CrossRef - McCrindle BW: Assessment and management of hypertension in children and adolescents. Nat Rev Cardiol. 2010; 7:155– 163
CrossRef - Matthews, D., Hosker, J., Rudenski A et al : Homeostasis model assessment: insulin resistance and beta-cell function from fasting plasma glucose and insulin concentrations in man. Diabetologia (1985) ; 28, 412–419.
CrossRef - Keskin M., Kurtoglu S, Kendirci M, Atabek M. E, and Yazici C: Homeostasis model assessment is more reliable than the fasting glucose/insulin ratio and quantitative insulin sensitivity check index for assessing insulin resistance among obese children and adolescents. Pediatrics, 2005; 115, (4), 500–503.
CrossRef - Saito M, Ishimitsu T, Minami J et al: Relations of plasma high-sensitivity c-reactive protein to traditional cardiovascular risk factors. Atherosclerosis 2003; 167: 73–79
CrossRef - Cynthia L. Ogden, Margaret D. Carroll, MSPH; Brian K. Kit, MD, MPH; Katherine M. Flegal: Prevalence of Childhood and Adult Obesity in the United States, 2011-2012. JAMA. 2014; 311(8):806-814. doi:10.1001/ jama.2014.732
CrossRef - Ng M, Fleming T, Robinson M, Thomson B, Graetz N, Margono C, et al. Global, regional, and national prevalence of overweight and obesity in children and adults during 1980–2013: a systematic analysis for the Global Burden of Disease Study 2013.
CrossRef - Seattle-based Institute for Health Metrics and Evaluation (IHME): Egypt most obese nation, new study reveals. 16 June, 2017.
- Rinaldi A, Elisa M, Erick P, Fernando M, Gleice F, Costa P, José Eduardo C , Roberto Carlos Burini : Dietary intake and blood lipid profile in overweight and obese schoolchildren. Rinaldi et al. BMC Research Notes 2012, 5:598 doi: http://www.biomedcentral.com/1756-0500/5/598
CrossRef - Herouvi D, Karanasios E, Karayianni C & Karavanaki K: Cardiovascular disease in childhood: the role of obesity. Eur J Pediatr 2013;172:721-732
CrossRef - Tirosh A, Shai I, Afek A, et al: Adolescent BMI trajectory and risk of diabetes versus coronary disease. N. Engl. J. Med. 2011;364:1315–1325. [PMC free article] [PubMed] CrossRef
- Grundy SM, Brewer HB Jr, Cleeman JI, Smith SC Jr & Lenfant C: National Heart, Lung, and Blood Institut . Definition of metabolic syndrome: report of the National Heart, Lung, and Blood Institute/American Heart Association conference on scientific issues related to definition. Arterioscler Thromb Vasc Biol.(2004); 24: 13-8.
CrossRef - Wada K, Tamakoshi K, Yatsuya H, Otsuka R, Murata C,Zhang H, Takefuji S, Matsushita K, Sugiura K, Toyoshima H: Association between parental histories of hypertension, diabetes and dyslipidemia and the clustering of these disorders in offspring. Prev Med 2006;42:358-363.
CrossRef - Flegal KM, Carroll MD, Ogden CL et al: Prevalence and trends in obesity among US adults, 1999–2008. JAMA 2010; 303(3):235–241.
CrossRef - Phiske MM: An approach to acanthosis nigrigans. Indian Dermatol Online Journal, 2014 ; 5 (3 ) 239-249. DOI: 10.4103/2229-5178.137765
CrossRef - Lazzer S, Patrizi A, De Col A, Saezza A, Sartorio A: Prediction of basal metabolic rate in obese children and adolescents considering pubertal stages and anthropometric characteristics or body composition. Eur J Clin Nutr. 2014 Jun; 68(6):695-9. doi: 10.1038/ejcn.2014.26. Epub 2014 Mar 5.
CrossRef - Sukhonthachit P, Aekplakorn W, Hudthagosol C , Sirikulchayanonta C: The association between obesity and blood pressure in Thai public school children. BMC Public Health 2014, 14:729.
CrossRef - Sangun O, Bumin Dundar, Muhammet Koflker, Ozgur Pirgon, Nihal Dundar: Prevalence of Metabolic Syndrome in Obese Children and Adolescents using Three Different Criteria and Evaluation of Risk Factors. J Clin Res Ped Endo 2011; 3(2):70-76. DOI: 10.4274/jcrpe.v3i2.15
CrossRef - Juliaty A, Dianti Maya Sari B, Dasril D, Johan SL: Relationship Between Blood Pressure and Lipid Profile on Obese Children. American Journal of Health Research 2015; 3(4): 198-202
CrossRef - Klop B, Elte JW, Cabezas MC: Dyslipidemia in obesity: mechanisms and potential targets. Nutrients 2013; 5(4): 1218–40.
CrossRef - Dullaart RP, Annema W, Tio RA, Tietge UJ: The HDL anti-inflammatory function is impaired in myocardial infarction and may predict new cardiac events independent of HDL cholesterol. Clin Chim Acta 2014; 433: 34–8.
CrossRef - Friedemann C, Heneghan C, Mahtani K, Thompson M, Perera R, Ward AM: Cardiovascular disease risk in healthy children and its association with body mass index: systematic review and meta-analysis. BMJ. 2012; 345:e4759. doi: 10.1136/bmj.e4759 PMID: 23015032
CrossRef - Romualdo MC, Nóbrega FJ, Escrivão MA:: Insulin resistance in obese children and adolescents. J Pediatr (Rio J). 2014 Nov-Dec;90(6):600-7. doi: 10.1016/j.jped.2014.03.005. Epub 2014 Jul 11.
CrossRef - Selim Kurtoğlu, Nihal Hatipoğlu, Mümtaz Mazıcıoğlu, Mustafa Kendirici, Mehmet Keskin, and Meda Kondolot: Insulin Resistance in Obese Children and Adolescents: HOMA−IR Cut−Off Levels in the Prepubertal and Pubertal Periods. J Clin Res Pediatr Endocrinol. 2010 Sep; 2(3): 100–106. doi: [10.4274/jcrpe.v2i3.100] PMCID: PMC3005684, PMID: 21274322
CrossRef - Chopra HK, Gupta P, Krishna CK, Aggarwal KK, Sambi RS: High Sensitivity C-reactive Protein: The Most Powerful Predictor of Occult Cardiovascular Disease in Patients of Metabolic Syndrome: A Hospital-based Study. In: Chopra HK, Ramakrishnan S, Pancholia AK and Bansal M (eds.). CSI Cardiology update, New Delhi; Jaypee Brothers Medical Publishers (P) Ltd: 2014, pp. 755-761.
- Inas R. El-Alameey, Nevein N. Fadl, Enas R. Abdel Hameed, Lobna S. Sherif, Hanaa H. Ahmed: Clinical Relevance of Transforming Growth Factor-β1, Interleukin-6 and Haptoglobin for Prediction of Obesity Complications in Prepubertal Egyptian Children. Macedonian Journal of Medical Sciences. 2015 Mar. 15; 3 (1): 105- 110.
CrossRef - Ebrahimi M, Heidari-Bakavoli AR, Shoeibi S, Mirhafez SR, Moohebati M, Esmaily H, Ghazavi H: Association of Serum hs-CRP Levels With the Presence of Obesity, Diabetes Mellitus, and Other Cardiovascular Risk Factors. J Clin Lab Anal 2016; 30(5): 672–6.
CrossRef - Maffeis C, Banzato C, Brambilla P, Cerutti F, Corciulo N, Cuccarolo G, et al: Insulin resistance is a risk factor for high blood pressure regardless of body size and fat distribution in obese children. Nutr Metab Cardiovasc Dis 2010; 20(4): 266–73.
CrossRef - Xu W, Li R, Zhang S, Gong L, Wang Z, Ren W, Xia C, Li Q. The relationship between high-sensitivity C-reactive protein and ApoB, ApoB/ApoA1 ratio in general population of China. Endocrine 2012; 42(1): 132–8.
CrossRef - Olza J, Aguilera CM, Gil-Campos M, Leis R, Bueno G, Martnez-Jiménez MD, Valle M, Caٌete R, Tojo R, Moreno LA, Gil A. Myeloperoxidase is an early biomarker of inflammation and cardiovascular risk in prepubertal obese children. Diabetes Care 2012; 35(11): 2373–6.
CrossRef - Sladoje, DP; Bojana K; Dijana B: The Monitoring of Protein Markers of Inflammation and Serum Lipid Concentration in Obese Subjects with Metabolic Syndrome. Journal of Medical Biochemistry; Belgrade Vol. 36, Iss. 4, (2017): 366-374. DOI:10.1515/jomb-2017-0009
CrossRef - Zaki M , Basha W,1 Hanaa Reyad,1 Ramy Mohamed, Naglaa Hassan, and Shams Kholousi : Association between Myeloperoxidase Levels and Risk of Insulin Resistance in Egyptian Obese Women. Open Access Maced J Med Sci. 2018 Apr 15; 6(4): 629–633. Published online 2018 Apr 6. doi: [10.3889/oamjms.2018.164] PMCID: PMC5927491, PMID: 29731928
- Andrade VL, Petruceli E, Belo VA, Andrade-Fernandes CM, Caetano Russi CV, Bosco AA, Tanus-Santos JE, Sandrim VC. Evaluation of plasmatic MMP-8, MMP-9, TIMP-1 and MPO levels in obese and lean women. Clin Biochem 2012; 45(6): 412–5.
CrossRef - Meuwese MC, Stroes ES, Hazen SL, van Miert JN, Kuivenhoven JA, Schaub RG. Serum myeloperoxidase levels are associated with the future risk of coronary artery disease in apparently healthy individuals: the EPIC Norfolk Prospective Population Study. J Am Coll Cardiol 2007; 50(2): 159–65
CrossRef - Düzgünçinar O, Yavuz B, Hazirolan T, Deniz A, Tok zoğlu SL, Akata D, Demirpençe E. Plasma myeloperoxidase is related to the severity of coronary artery disease. Acta Cardiol 2008; 63(2): 147–52.
CrossRef - Kumar AP, Reynolds WF. Statins downregulate myeloperoxidase gene expression in macrophages. Biochem Biophys Res Commun 2005; 331(2): 442–51.
CrossRef - Ruggeri RB, Buckbinder L, Bagley SW, Carpino PA, Conn EL, Dowling MS, et al.: A Highly Selective Mechanism-Based Myeloperoxidase Inhibitor for the Treatment of Cardiovascular Diseases. J Med Chem 2015; 58(21): 8513–28.
CrossRef - García AG , Rodríguez MR, Alonso CG, Yazmin D, Ochoa R, Aguilar CA: Myeloperoxidase Is Associated with Insulin Resistance and Inflammation in Overweight Subjects with First-Degree Relatives with Type 2 Diabetes Mellitus. Diabetes Metab J. 2015 Feb; 39(1): 59–65. Published online 2015 Feb 16. doi: [10.4093/ dmj. 2015. 39.1.59]. PMCID: PMC4342538, PMID: 25729714
CrossRef - Agarwal A, Hegde A, Yadav C, Ahmad A, Manjrekar PA, Srikantiah RM: Association of Interleukin-6 and Myeloperoxidase with Insulin Resistance in Impaired Fasting Glucose Subjects. Indian J Clin Biochem. 2017 Mar; 32(1):33-38. doi: 10.1007/s12291-016-0567-8. Epub 2016 May 3.
CrossRef

