
Manuscript accepted on :13-May-2019
Published online on: 07-06-2019
Plagiarism Check: Yes
Reviewed by: Salah Said
Second Review by: Pietro Scicchitano
P. Careena1, M. Mary Synthuja Jain Preetha2 and P. Arun3
1Department of Electronics and Communication Engineering, Amal Jyothi College of Engineering, 686518-Kanjirapally.
2Department of Electronics and Communication Engg., Noorul Islam University, 629180- Nagercoil.
3Department of Electronics and Communication Engineering, St. Joseph’s College of Engineering and Technology, 686579- Palai.
Corresponding Author E-mail: careenaarun@gmail.com
DOI : https://dx.doi.org/10.13005/bpj/1721
Abstract
Early diagnosis of heart diseases bears a major role in saving lives. Presence of spurious extra-frequency components, termed as murmurs within the phonocardiography record may be indicative of valvular disorders like stenosis, lesions or regurgitation. It is difficult to identify the subtitle spectral components of murmurs through subjective audition. In this paper, a technique is proposed to detect the presence of murmur from the heart signal by analyzing their non-stationarity behavior by using autocorrelation based features namely, Standard Error (SE) of Auto-Correlation Function (ACF) and absolute deviation of SE from the reciprocal of the square root of number of samples (β). The selected features corresponding to normal and murmur differ with a ‘P’ value of 1.80 x10⁻¹⁴ (dataset 1) and 2.20 x10-76 (dataset 2) for SE and β, respectively. It is found that SE and β could effectively distinguish normal and murmur with 100% accuracy, sensitivity, and specificity.
Keywords
Autocorrelation; Heart Abnormality; Murmur, Non-Stationarity; PCG Signal; Time Domain Features; Type of Heart Signal
Download this article as:| Copy the following to cite this article: Careena P, Preetha M. M. S. J, Arun P. Detection of Murmur from Non-Stationarity of Heart Sounds. Biomed Pharmacol J 2019;12(2). |
| Copy the following to cite this URL: Careena P, Preetha M. M. S. J, Arun P. Detection of Murmur from Non-Stationarity of Heart Sounds. Biomed Pharmacol J 2019;12(2). Available from: https://bit.ly/2QSGSEh |
Introduction
Cardiovascular diseases (CVDs) are one of the major causes of death worldwide. As per the report of world health organization, the annual death rate due to CVDs is more than from any other diseases.1 In 2015, around 17.7 million people died because of CVDs. Of these deaths, an estimated 7.4 million were due to coronary heart disease. Hence, early detection and diagnosis of heart diseases play a major role in saving lives. Presence of spurious extra-frequency components, termed as murmurs within the phonocardiography (PCG) records, or heard during the routine auscultation with steth, may be indicative of valvular disorders like stenosis, lesions or regurgitation. But it is difficult to detect the presence of murmur in the heart signal through subjective audition. Hence an automated method to detect the presence of murmur in the heart sound has its own importance to find out the heart abnormalities.
Few methods dealing with the computerized detection and characterization of heart murmurs are available in the literature.2-18 Kang et al.2 developed a system for automatic identification of Still’s murmur in children with a sensitivity of 84-94% and a specificity of 91-99%. They used time domain features (average Shannon energy and envelope detection) and frequency domain features (spectral width and peak frequency) of S1 and S2 heart sounds. These features were given as input to Support Vector Machine (SVM) classifier. S.W. Deng and J. Q. Han3 proposed a method based on the autocorrelation features like Sub-band autocorrelation function. These features were extracted from the sub-band envelopes derived from the sub-band coefficients of PCG signals obtained using Discrete Wavelet Transform (DWT). Finally using diffusion maps, these features were fused to get unified features and they were given into the SVM classifier (Accuracy 91 %).
Chen et al.4 used a continuous wavelet transform to distinguish organic and innocent murmurs. Singular value decomposition and QR (Q is an orthogonal matrix and R is an upper triangular matrix) decomposition were applied on the time-frequency matrix, obtained from continuous wavelet transforms for feature extraction. Shannon entropy and the Gini index were further computed on the decomposition results and were taken as features. To reduce the number of features and the computational complexity, Sequential Forward Floating Selection (SFFS) was used as a feature selection algorithm. Classification accuracy of 90% was reported for regression tree based classification scheme.
Safara et al.5 used wavelet packet entropy to discern stenosis and regurgitation of mitral and aortic valves (Bay’s Net classifier 96% accuracy). Choi et al.6 used features like maximum peak frequency, the position index of the wavelet packet coefficient corresponding to the maximum peak frequency and the ratios of the wavelet energy and entropy of PCG signal (99.78% specificity and 99.43% sensitivity). In the method suggested by V. N. Varghees and K. I. Ramachandran,7 initially the PCG signal was decomposed by Empirical Wavelet Transform (EWT). The heart sound/murmur detection was done by Shannon entropy and instantaneous phase after discriminating them using mode boundary frequency and maximum absolute amplitude. The evaluation results showed that the system had an accuracy of 91.92%. To extract S1 and S2 heart sounds G. Eslamizadeh and R. Barati8 applied Continuous Wavelet Transform (CWT) with Morlet wavelet function to PCG signal. To detect the murmur, an algorithm was also proposed to extract features such as maximum amplitude values from consecutive S1 and S2 and vice versa. These features were normalized and input into Artificial Neural Network (ANN) classifier (average success rate of 94 %.). Guillermo et al.9 introduced a system based on radial wavelet neural network with Kalman learning. At first, by using CWT, the PCG signal was segmented to get S1 and S2 heart sounds. As a feature extraction method, a total of 9 relative divisions made recursively upon each division generated on a symmetric way by considering previous S1’s and S2’s. From each division, a maximum and minimum amplitude point were taken and considered a feature. Thus a total of 18 features were obtained. These selected features were input into a Radial Wavelet Neural Network (RWNN) with Kalman learning. The system was able to differentiate normal and murmur with a success rate of 98.04%.
Safara et al.10 proposed a technique termed as Multi-Level Basis Selection (MLBS) to preserve the most informative bases of a wavelet packet decomposition tree by removing less informative bases by applying three exclusion criteria: frequency range, noise frequency, and energy threshold. MLBS achieved an accuracy of 97.56%. Hamidi et al.11 suggested two methods for heart abnormality detection using PCG signal. In the first method curve fitting of the heart, signal was performed after preprocessing and filtering. The power spectrum of the curve fitted signal was computed and used it as a feature. In the second method, the signal was divided into equal parts and fractal dimension was computed for each part. The resultant signal was considered as the second feature. These two features were input into K-Nearest Neighbors (KNN) classifier.Average accuracy of 90 % was reported. Bozkurt et al.12 proposed a system using Mel-frequency Cepstral Coefficient (MFCC), Mel-spectrogram and sub-band envelopes of the PCG signal for paediatric heart abnormality detection with 84.5% sensitivity, 78.50% specificity, and 81.5% accuracy. The features were directly inputted into the Convolutional Neural Network (CNN) classifier. Thiyagaraja et al.13 prototyped a smartphone based electronic stethoscope that can record, process and detect heart sounds. In their system, S1 and S2 heart sounds were extracted using peak detection method after preprocessing. By using this S1 and S2 heart sounds, a classification model utilizing the MFCC and Hidden Markov Model (HMM) were introduced to detect normal/murmur (Accuracy of 92.68%).
The features used by Zheng et al.14 include the energy fraction of the first and the second heart sounds (S1–S2EF), energy fraction of heart murmur (HMEF), the maximum energy fraction of heart sound frequency sub-band (HSEFmax), sample entropy of the first and the second heart sound component (S1–S2sampen) and sample entropy of heart murmur component (HMsampen). The heart sounds after denoising, normalized signals were decomposed into wavelet packets. The features were calculated from the reconstructed selective frequency components of the signals. It was reported that the SVM classifier discriminated heart murmurs with an accuracy of 97.17%, a specificity of 98.55% and a sensitivity of 93.48%.
Choi et al.15 illustrated a method based on a multi-Gaussian fitting algorithm of the cardiac spectral curve. The spectral autoregressive Power Spectral Density (aPSD) curve was estimated from the cardiac sounds noise-canceled by the wavelet decomposition. 5-GaPSD was approximated by a five-Gaussian model consisting of five Gaussian peaks, P1 to P5. The spectral profiles, the maximum frequency, the amplitude, the half-width, the area portion and the loss of area, of five Gaussian peaks, were investigated and compared for segmenting the spectral information of normal heart sound and regurgitation murmurs. Redlarski et al.16 used Linear Predictive Coding (LPC) Coefficients as feature input to a composite classifier made of SVM and modified cuckoo search, to separate innocent murmur (S1, S2, S3, and S4) and organic murmur (Accuracy 93%). Zhang et al.17 used scaled spectrogram after dimensionality reduction with partial least squares regression as feature input to SVM classifier to distinguish heart murmur from extrasystole and controls (Precision 91%). Another method proposed by Zhang et al.,18 spectrograms of the heart signal were scaled to a fixed size after preprocessing and dimensionality reduction. Then the scaled spectrograms were concatenated as a three-way tensor and decomposed using Tuckar-2 decomposition method. The decomposed information has given in to SVM (Accuracy 76 %).
In most of the literature, the statistical significance, separability and the inter-class variability of the features were not investigated or tested. To distinguish the normal/murmur, most of the literature used various classifiers along with various features rather than using the fundamental time, frequency or time-frequency domain features. Neural networks or classifiers are essential in conditions, where in feature space, the features are less statistically significant. Moreover, a system with classifiers may deteriorate the system performance and also the system complexity will be increased. The works presented in literature failed to differentiate the normal and murmur with cent percentage sensitivity, septicity, and accuracy. Usually, the pattern of the heart signal of a normal heart is stationary. When extra frequency components like murmurs is interfered in the heart sound, the non-stationarity of the resultant signal will be increased. That means PCG measurements of an abnormal heart will be highly nonstationary. Moreover, the normal heart signal is less stationary than the heart signal interfered with a murmur.
Hence, the objective of this paper is to design a technique by using the time domain features such as the autocorrelation based features such as Standard Error (SE) of Auto-Correlation Function (ACF) and absolute deviation of SE from the reciprocal of the square root of number of samples (β) to detect the Murmurs from Non-Stationarity of heart sound. The highlights of the proposed technique are i) The method is able to identify the presence of murmur in the heart signal with 100 % sensitivity, septicity, and accuracy. ii) It is quite simple as the method used only fundamental time domain features. Moreover, the computational complexity of the technique is also very less.
The analysis, mathematical formulation of features and the details of the dataset used are furnished in section 2. In section 3, the statistical significance and separability offered by the features to distinguish normal or murmur is analyzed. In section 4, discussion with the existing methods is included.
Methodology
The methodology adopted in the method to detect the presence of murmur from the non-stationarity of the heart sound is discussed in this section.
The schematic of the stages involved in the computation of autocorrelation based features and feature evaluation is presented in fig.1.
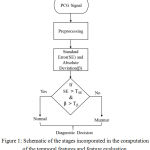 |
Figure 1: Schematic of the stages incorporated in the computation of the temporal features and feature evaluation.
|
Before computing the autocorrelation based features, the PCG signal is preprocessed. The block schematic of the steps involved in the preprocessing is illustrated in fig.2. After extracting the autocorrelation based features like SE and β, a threshold is set up for accurately classifying the heart signal. If SE is greater than the threshold TSE and β is greater than that of Tβ, the heart signal belongs to normal else it is murmur. Where TSE and Tβ are the threshold for SE and β, respectively.
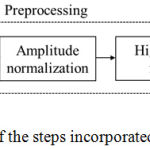 |
Figure 2: Schematic of the steps incorporated in the preprocessing.
|
The preprocessing (fig.2) of the PCG signal includes upsampling of the signal by a factor 2 to achieve adequate sampling rate, the amplitude normalization between -1 and +1 and the high pass filter to remove the frequency components below 10 Hz. The time domain features like SE and β of the preprocessed signal is estimated to test their ability to differentiate normal heart sound and murmur. Besides, their statistical significance is also evaluated.
The upsampled PCG signal after normalization is given as
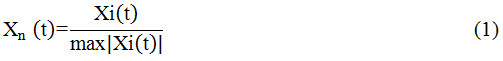
where ‘Xi(t)’ is the PCG signal, sampled at a rate ‘1/fs’ and contains ‘N’ samples, 1≤n≤N.To regulate the amplitude of heart signal, the samples are normalized to a range between -1 and +1 as in (1).
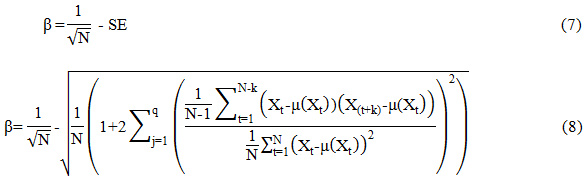
As already stated, PCG measurements of an abnormal heart will be highly nonstationary. That means the murmur may more non-stationary than the normal heart signal. The properties of the autocorrelation of heart signal are employed in this paper. Autocorrelation is extensively used to measure non-stationarity of a signal. The autocorrelation based features can be used to quantify the change in non-stationarity of the heart signal. Box et.al,19 proposed that SE of the ACF can be used to estimate the randomness or non-stationarity behavior of a signal. It was also stated that, as the signal becomes more random, the value of SE moves nearer to the reciprocal of the square root of the number of samples in the signal. The SE of the sample autocorrelation function can be denoted as
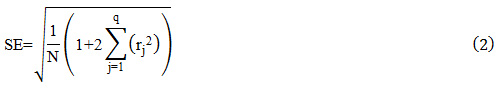
where ‘N’ is the total number of samples, ‘q’ is the lag beyond which the theoretical ACF is effectually become 0 and ‘rj’ is the SACF function. When the series becomes completely random, SE reduces to 1/√N19
The SACF ‘rk’ at lag ‘k’ is
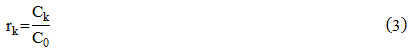
where ‘C0’ and ‘Ck’ are the variance (with zero shift) and covariance of the signal, respectively.
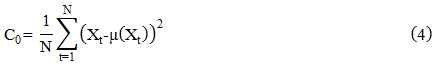
Where ‘Xt’ is the heart signal after preprocessing and it’s mean is given by ‘μ (Xt)’
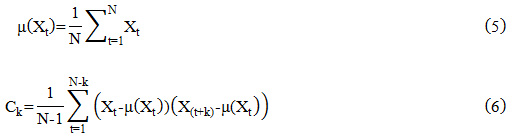
where ‘X (t+k)’is the shifted version of the signal ‘Xt’ and given k=0,1,2 … …K.
The mathematical representation of the absolute deviation of SE from the reciprocal of the square root of the number of samples (β) is given as,
The proposed technique used two common public heart sound databases namely pascal heart sounds challenge database (Pascal HSDB)20 and physionet heart sound database (Physionet HSDB).21 The Pascal HSDB consists of dataset A and dataset B. The former has been collected from the general public using the iStethoscope Pro iPhone app and later from a clinical trial in hospitals via digital stethoscope DigiScope. The duration of recorded ‘.wav’ files (sampling frequency 4 KHz) in the dataset B varies from 1 second to 30 seconds. The Physionet HSDB recordings were collected from various contributors around the globe, gathered at either a medical or nonmedical environment, from both healthy people and pathological patients. This data set consists of five training databases (A to E) comprising a total heart sound recording of 3,126 samples with a duration from 5 to 120 seconds. All records were resampled to 2 KHz and hold only one PCG lead. All the recordings were provided as .wav format.
The proposed method is tested on 400 records. Out of these, 60 records from dataset B of Pascal HSDB (dataset 1) and 340 records from dataset E of Physionet HSDB (dataset 2). Out of the 60 records of dataset 1, 30 records are normal and 30 records are murmur. The 340 records of dataset 2 consist of 170 records each from normal and murmur category. The signals are selected in such a way that each record have sample length more than 8 seconds and are upsampled by a factor 2 ie; the sampling frequency ‘fs’ of the first dataset is 8 KHz and that of the second dataset is 4 KHz. The frequency components less than 10 Hz are eliminated by a high pass filter with a cut off frequency 10 Hz.
The wave shape of heart signal corresponding to normal and murmur acquired from two data set are shown in fig. 3 (a) – fig. 3. (d).
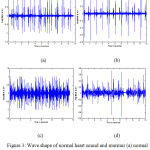 |
Figure 3: Wave shape of normal heart sound and murmur (a) normal heart sound (dataset 1) (b) normal heart sound (dataset 2) (c) Murmur (dataset 1) (d) Murmur (dataset 2).
|
The wave pattern of normal heart sound and murmur are entirely different from each other. They differ in terms of their amplitude and randomness characteristics. For example, the wave pattern of heart signal corresponding to murmur is more random and their average amplitude is comparatively higher than the wave pattern of the normal heart sound. By observing fig.3 (a) and (c), the average amplitude of normal heart signal (fig.3 (a)) is comparatively smaller than that of the murmur (fig.3 (c)).
The statistical significance of the features is tested for their ability to distinguish normal and murmur via Kolmogorov–Smirnov test. The Histogram is used to qualitatively evaluate the separability offered by the features. Both feature extraction and their statistical evaluation are performed in Matlab®.
Results
As stated earlier, Standard Error (SE) of Auto-Correlation Function and absolute deviation of SE from the reciprocal of the square root of a number of samples (β) of the preprocessed signal are utilized as features. The wave pattern of the PCG signal after preprocessing is presented in fig.4 (a – d).
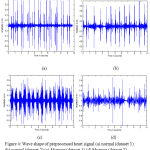 |
Figure 4: Wave shape of preprocessed heart signal (a) normal (dataset 1) (b) normal (dataset 2) (c) Murmur (dataset 1) (d) Murmur (dataset 2).
|
The wave shape of normal heart sound (fig.4 (a-b)) and murmur (fig.4(c-d)) shows certain dissimilarity in their pattern. They vary in terms of their amplitude and randomness. That means, the wave shape of preprocessed heart signal corresponding to normal (fig.4 (a-b)) is less random and their average amplitude is comparatively lesser than the wave shape of murmur. By observing fig.4 (a) and (c), the average amplitude of murmur (fig.4 (c)) is comparatively larger than that of normal heart signal (fig.4 (a)).
The pattern of normalized ACF of normal heart sound and murmur of dataset 1 and dataset 2 is shown in fig. 5(a)–(d).
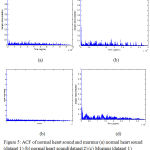 |
Figure 5: ACF of normal heart sound and murmur (a) normal heart sound (dataset 1) (b) normal heart sound(dataset 2) (c) Murmur (dataset 1) (d) Murmur (dataset 2).
|
It is clear that the pattern of the autocorrelation of the normal heart signal (fig. 5 a-b) and that of the murmur (fig. 5 c-d) of dataset 1 and dataset 2 differ significantly. This highlights the possibility of ACF of heart signal to be used to distinguish the type of heart signal like normal and murmur. In this paper, the time domain features like SE of Auto-Correlation Function and β are estimated on the PCG signal collected from dataset 1 and dataset 2 to evaluate their ability to differentiate normal and murmur. The range and numerical values of SE and β extracted from the signal corresponding to normal and the murmur is presented in Table 1.
From Table 1 it is observed that, for dataset1, the standard error and absolute deviation of normal signal ranging from 0.0701 to 0.0878 and 0.0674 to 0.0851, respectively. The SE and β of dataset 2 of normal signal ranging from 0.2384 to 0.351 and 0.2371 to 0.3467, respectively. For murmur, the feature ranging from 0.0262 to 0.0439 and 0.0233 to 0.0402 for SE and β, respectively for dataset 1 and 0.0303 to 0.2124 and 0.0253 to 0.2074 for SE and β, respectively for dataset 2.
Table 1: Numerical values and Range of features of Normal heart sound and Murmur.
| Sl No | Features | Type of Heart Signal | Dataset 1 | Dataset 2 | ||
| Range | Numerical value | Range | Numerical value | |||
| 1 | Standard Error (SE) | Normal | 0.0701 to 0.0878 | 0.0776 ± 0.0042 | 0.2384 to 0.351 | 0.2677 ± 0.0120 |
| Murmur | 0.0262 to 0.0439 | 0.0337 ± 0.0042 | 0.0303 to 0.2124 | 0.0481 ± 0.0173 | ||
| 2 | Absolute deviation ( β) | Normal | 0.0674 to 0.0851 | 0.0749 ± 0.0042 | 0.2371 to 0.3467 | 0.2634 ± 0.0120 |
| Murmur | 0.0233 to 0.0402 | 0.0301 ± 0.0040 | 0.0253 to 0.2074 | 0.0431 ± 0.0173 | ||
The numerical value of SE of dataset 1 is 0.0776 ± 0.0042 (normal), 0.0337 ± 0.0042 (murmur) and that of dataset 2 is 0.2677 ± 0.0120 (normal) and 0.0481 ± 0.0173 (murmur), respectively. In the case of β of dataset 2, its numerical value is 0.2634 ± 0.0120 (normal) and 0.0431 ± 0.0173 (murmur), respectively. It can be inferred that the numerical values of SE and β of PCG signal corresponding to normal heart sound are significantly greater than that of murmur for both datasets.
As far as the range of features of murmur is considered, they are confined to a narrow range compared to that of the normal heart sound. As mentioned earlier, the heart signal of an abnormal heart will be highly nonstationary. That is, when the signal becomes more random (murmur), the value of SE moves closer to the reciprocal of the square root of the number of samples in the signal. As the signal becomes more random, the value of SE moves nearer to the reciprocal of the square root of the number of samples of the signal. These clearly apparent distinctions between the magnitude and the range of feature values extracted from the signal corresponding to normal as well as murmur justify the potential of the time domain features, particularly the autocorrelation based features.
The statistical significance of SE and β are tested for their capability to differentiate normal and murmur using Kolmogorov–Smirnov test. The ‘H’ and ‘P’ values of these features of dataset 1 and 2 are presented in Table 2.
Table 2: Kolmogorov-Smirnov Test – ‘H’ and ‘P’ values of features of heart signal corresponding to Normal and Murmur.
| Sl No | Features | Dataset 1 | Dataset 2 | ||
| Chi-Square value (H) |
Probability value (P) |
Chi-Square value (H) |
Probability value (P) |
||
| 1 | Standard Error (SE) | 1 | 1.80 x10⁻¹⁴ | 1 | 2.20 x10-76 |
| 2 | Absolute deviation ( β) | 1 | 1.80 x10⁻¹⁴ | 1 | 2.20 x10-76 |
The Chi-Square values (H) obtained from the Kolmogorov-Smirnov Test (table 1) is ‘1’ for both SE and β. The ‘H’ values are computed for a default significance level of 5%. SE and β corresponding to normal and murmur of both dataset 1 and dataset 2 differ with a ‘P’ value of 1.80 x10⁻¹⁴ and 2.20 x10-76, respectively. It can be inferred that; the above two features are statistically more significant.
The histogram of features specifically SE and β of normal heart sound and murmur of dataset 1 and dataset 2 are shown in fig. 6(a)-(d).
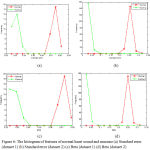 |
Figure 6: The histogram of features of normal heart sound and murmur (a) Standard error (dataset 1) (b) Standard error (dataset 2) (c) Beta (dataset 1) (d) Beta (dataset 2).
|
In the histogram of SE of dataset 1(fig. 6(a)) and that of dataset 2 (fig. 6(b)), there is no overlap exists among the histogram of normal and murmur. Similarly, in the histogram of β of dataset 1(fig. 6(c)) and that of dataset 2 (fig. 6(c), there is no overlap occurs between the histogram of normal and murmur. Besides, the histogram of SE (fig. 6(a)-(b)) and that of β (fig. 6 (c)-(d)), the histogram corresponding to normal heart signal is lying sufficiently apart spatially from the histogram corresponding to murmur. That means, there is no overlap between the features of normal and murmur and also they offer very good separability among them. Hence, SE and β can be used to effectively distinguish normal and abnormal heart signal.
The range of features of normal heart sound and murmur are given in Table.3. The range of SE of dataset 1 of the normal signal is 0.0701 to 0.0878 and that murmur is 0.0262 to 0.0439. In the case of absolute deviation, the normal signal ranges from 0.0674 to 0.0851 and murmur from 0.0233 to 0.0402. For the second dataset, the normal signal is varying from 0.2384 to 0.351 and murmur from 0.0303 to 0.2124 for the feature SE. For the same dataset, the absolute deviation (β) of the normal signal ranging from 0.2371 to 0.3467 and that of murmur is lies between 0.0253 to 0.2074.
Table 3: Range of features of Normal heart sound and Murmur.
| Sl. No | Features | Type of Signal | Dataset 1 | Dataset 2 |
| 1 | Standard Error (SE) | Normal | 0.0701 to 0.0878 | 0.2384 to 0.351 |
| Murmur | 0.0262 to 0.0439 | 0.0303 to 0.2124 | ||
| 2 | Absolute deviation ( β) | Normal | 0.0674 to 0.0851 | 0.2371 to 0.3467 |
| Murmur | 0.0233 to 0.0402 | 0.0253 to 0.2074 |
As stated earlier, there is no overlap exists among the range of normal and murmur of two features (SE and β) of dataset 1 and dataset 2. Therefore, these two features are useful to effectively classify the normal and murmur. Using the range values of the selected feature of normal and murmur, a threshold (TSE and Tβ) is set for dataset 1 and dataset 2. Where TSE and Tβ are the threshold for SE and β, respectively. To get better classification accuracy, the threshold level is selected in such a way that, it is the average of the minimum value of murmur and the maximum value of the normal signal. Hence the threshold levels obtained by using the range shown in Table.3 is listed as follows. For first dataset, the thresholds are 0.057(TSE) and 0.054 (Tβ), respectively. For second dataset the thresholds are 0.1322(TSE) and 0.2254 (Tβ), respectively. That means for the first dataset if TSE specifically above 0.057, the signal is normal and if it goes just below 0.057, the signal is murmur. If Tβ is exactly below 0.054, the signal is murmur and if it is just above 0.054, the signal is normal. For the second dataset, if TSE above 0.2254 the signal is normal and if it is below 0.2254, the signal is murmur. When Tβ goes just above 0.1322, the signal is normal and if it is just below 0.1322 the signal is murmur. So it can be inferred that the features namely, standard error and absolute deviation of SE from the reciprocal of the square root of a number of samples of the heart signal can be effectively useful to differentiate the normal and murmur signal.
The performance parameters like sensitivity, specificity, Positive Predictive Value (PPV), Negative Predictive Value (NPV) and accuracy of the features (SE and β) to distinguish the normal/murmur are also computed for the two datasets and are presented in Table.4.
Table 4: Performance parameters of SE and β.
| Parameters | Standard Error (SE) | Absolute deviation ( β) | ||
| Dataset 1 | Dataset 2 | Dataset 1 | Dataset 2 | |
| Sensitivity | 100% | 100% | 100% | 100% |
| Specificity | 100% | 100% | 100% | 100% |
| Accuracy | 100% | 100% | 100% | 100% |
| PPV | 100% | 100% | 100% | 100% |
| NPV | 100% | 100% | 100% | 100% |
For both dataset, the two features namely, SE and β are capable to discriminate normal or murmur heart signal with 100 % sensitivity, specificity, PPV, NPV, and accuracy.
Discussions
Table 5 presents several related studies formerly reported on the detection of murmur from the PCG records (arranged by publication year). As already discussed, most of the literature presented in the table. 5 failed to address the heart signal discrimination by using fundamental features. Most of the methods used either combination of fundamental features or used classifiers. Moreover, in all the below reported cases, 100% sensitivity, specificity, and accuracy was not achieved for categorizing normal or murmur.
Compared to the methods presented in table 5, we proposed a technique to detect heart sound and also to differentiate them as normal or murmur by using time domain features, exclusively autocorrelation features such as SE and β by utilizing the PCG records collected from two publicly available databases namely, Pascal HSDB and Physionet HSDB. The two features are successfully tested on the two datasets, statistically evaluated and separability among the features is examined. The technique offered an efficient performance (100% sensitivity, specificity, PPV, NPV, and accuracy) to differentiate normal/murmur heart signal. Hence, the proposed technique could be an effective study for the state-of-the-art methods available in the literature.
Table 5: List of certain previously reported studies on detection of a murmur.
| Sl No | Method used (Reporter & Year) | Features Used | Classifier | Dataset | Se (%) | Sp (%) | Acc (%) |
| 1 | Time Frequency
Bozkurt et al.,2018 |
Mel-frequency cepstral coefficient
(MFCC), mel-spectrogram |
SVM | University of Crete HSDB
and Physionet HSDB |
84.5 | 78.5 | 81.5 |
| 2 | Frequency Domain
Hamidi et al. ,2018 |
Curve fitting and power spectrum | KNN | Pascal HSDB and
Physionet HSDB |
_ | _ | 90 |
| 3 | Time Domain
Thiyagaraja et al.,2018 |
Peak detection | Not Used | Experimental setup | _ | _ | 92.6 |
| 4 | Time and Frequency
Varghees et al. ,2017 |
Mode boundary frequency and
maximum absolute amplitude |
Not Used | Pascal HSDB and
Physionet HSDB |
_ | _ | 91.9 |
| 5 | Time Frequency
Eslamizadeh et al.,2017 |
CWT and maximum amplitude |
ANN | Pascal HSDB | _ | _ | 94 |
| 6 | Time and Frequency
Kang et al. ,2017 |
Average Shannon energy and envelope
detection width and peak frequency |
SVM | The murmur library | 94 | 99 | _ |
| 7 | Time-Frequency
Zhang et al. ,2017 |
Scaled spectrogram with
tensor decomposition |
SVM | Pascal HSDB | _ | _ | 76 |
| 8 | Time-Frequency
Zhang et al. ,2017 |
Scaled spectrogram and partial
least squares regression |
SVM | Pascal HSDB | _ | _ | 90 |
| 9 | Time Domain
Deng et al. ,2016 |
Autocorrelation (Sub-band
ACF feature) |
SVM | Pacsal HSDB | _ | _ | 91 |
| 10 | Time and Time-Frequency
Zheng et al.,2015 |
Energy fraction, sample
entropy and wavelet packets |
SVM | unknown | 93.5 | 98.6 | 97.1 |
| 11 | Time-Frequency
Guillermo et al.,2015 |
Maximum and minimum amplitude | RWNN | Experimental setup | _ | _ | 98 |
| 12 | Frequency Domain
Choi et al.,2014 |
Wavelet decomposition | Not Used | Not mentioned | _ | _ | _ |
| 13 | Frequency Domain
Redlarski et al.,2014 |
Linear Predictive Coding
(LPC) Coefficients |
SVM | Littmann HSDB | _ | _ | 93 |
| 14 | Time-Frequency
Safara et al.,2013 |
Wavelet packet decomposition | SVM | Experimental setup | _ | _ | 97.5 |
| 15 | Time Frequency
(Chen et al.,2012) |
CWT, Shannon entropy
and the Gini index |
SFFS | Earson HSDB | 94 | 83 | 90 |
| 16 | Time-Frequency
(Safara et al.,2012) |
Wavelet packet entropy | Bay’s net | unknown | _ | _ | 96 |
| 17 | Time-Frequency
Choi et al.,2011 |
Wavelet packet coefficient | Not Used | unknown | 99.4 | 99.7 | _ |
| 18 | Time Domain
Proposed System |
SE and absolute deviation | Not Used | Pascal HSDB and
Physionet HSDB |
100 | 100 | 100 |
Conclusion
A technique for the detection of heart murmur from the non-stationarity of the heart signal, via autocorrelation based features like Standard Error (SE) of Auto-Correlation Function (ACF) and absolute deviation of SE from the reciprocal of the square root of a number of samples (β), was proposed in this paper. It was inferred that PCG measurements of murmur is highly nonstationary than that of normal heart signal. The features were statistically evaluated and the separability offered them was assessed on the PCG records collected from Pascal HSDB and Physionet HSDB.
The proposed system by using the fundamental time domain features was able to detect the murmur with 100% accuracy, sensitivity and specificity without incorporating any complex classifiers. The method overcomes the problems associated with manual auscultation. The scope of the methods to characterize the Phenotypes of the murmur can be investigated as a future deviation.
Conflict of Interest
There is no conflicts of interest.
Funding
This research received no specific grant from any funding agency in the public, commercial, or not-for-profit sectors.
Acknowledgements
The authors would like to thank the people behind the Pascal heart sound database and Physionet heart sound database for providing the required PCG signals to test the proposed system.
References
- HEARTS Technical package for cardiovascular disease management in primary health care: healthy-lifestyle counselling; Geneva: World Health Organization; 2018, (WHO/NMH/NVI/18.1). Licence: CC BY-NC-SA 3.0 IGO, http://apps.who.int/iris/bitstream/handle/10665/260422/WHO-NMH-NVI-18.1-eng.pdf?sequence=1&isAllowed=y.
- S. Kang, R. Doroshow, J. McConnaughey and R. Shekhar, Automated Identification of Innocent Still’s Murmur in Children, IEEE Transactions on Biomedical Engineering, Vol. 64, pp. 1326-1334, June 2017.
- S.W. Deng and J. Q. Han, Towards heart sound classification without segmentation via autocorrelation feature and diffusion maps, Future Generation Computer Systems, Vol.60, pp.13-21, Jan.2016.
- Y. Chen, S. Wang, C.H. Shen and F.K. Choy, Matrix decomposition based feature extraction for murmur classification, Medical Engineering & Physics, Vol. 34, pp. 756-761,July 2012.
- F. Safara, S. Doraisamy, A. Azman, A. Jantan, and S. Ranga, Wavelet Packet Entropy for Heart Murmurs Classification, Advances in Bioinformatics, Vol. 2012, pp.1-6, Oct.2012.
- S. Choi, Y. Shin and H.K. Park, Selection of wavelet packet measures for insufficiency murmur identification, Expert Systems with Applications, Vol. 38, pp. 4264-4271,April 2011.
- V. N. Varghees and K. I. Ramachandran, “Effective Heart Sound Segmentation and Murmur Classification Using Empirical Wavelet Transform and Instantaneous Phase for Electronic Stethoscope, IEEE Sensors Journal, Vol. 17, pp. 3861-3872, June 2017.
- G. Eslamizadeh and R .Barati, Heart murmur detection based on wavelet transformation and a synergy between artificial neural network and modified neighbor annealing methods, Artificial Intelligence in Medicine,Vol.78,pp.23-40, May 2017.
- J. E. Guillermo, L. J. R. Castellanos, E. N. Sanchez and A. Y. Alanis, Detection of heart murmurs based on radial wavelet neural network with Kalman learning, Neurocomputing, Vol.164, pp.307-317, Sept.2015.
- F. Safara, S. Doraisamy, A. Azman, A. Jantan, A. Ranga and A. Ramaiah, Multi-level basis selection of wavelet packet decomposition tree for heart sound classification, Computers in Biology and Medicine, Vol. 43, pp. 4264-4271, Oct. 2013.
- M. Hamidi, H. Ghassemian and M. Imani, Classification of heart sound signal using curve fitting and fractal dimension, Biomedical Signal Processing and Control, Vol.39, pp.351-359, Jan.2018.
- B. Bozkurt, I. Germanakis and Y. Stylianou, A study of time-frequency features for CNN-based automatic heart sound classification for pathology detection, Computers in Biology and Medicine, Vol.100, pp.132-143, Sept. 2018.
- S. R. Thiyagaraja, R. Dantu, P. L. Shrestha and A. Chitnis, Mark A. Thompson, Pruthvi T. Anumandla, Tom Sarma and Siva Dantu, A novel heart-mobile interface for detection and classification of heart sounds, Biomedical Signal Processing and Control, Vol.45, pp.313-324, Aug. 2018.
- Y. Zheng, X. Guo and X. Ding, A novel hybrid energy fraction and entropy-based approach for systolic heart murmurs identification, Expert Systems with Applications, Vol. 42, pp. 2710-2721, April 2015.
- S. Choi, G.B. Jung and H.K Park, A novel cardiac spectral segmentation based on a multi-Gaussian fitting method for regurgitation murmur identification, Signal Processing, Vol. 104, pp. 339-345, Nov. 2014.
- G. Redlarski, D. Gradolewski and A. Palkowski, A System for Heart Sounds Classification. PLoS ONE, Vol. 9, issue 11, Nov.2014.
- W. Zhang, J. Han and S. Deng, Heart sound classification based on scaled spectrogram and partial least squares regression, Biomedical Signal Processing and Control, Vol. 32, pp. 20-28, Feb. 2017.
- W. Zhang, J. Han and S. Deng, Heart sound classification based on scaled spectrogram and tensor decomposition, Expert Systems with Applications, Vol. 84, pp.220-231, Oct.2017.
- G. E. P. Box, G. M. Jenkins and G. C. Reinsel, “Time series analysis: forecasting and control,” 3rd ed. Englewood Cliffs, NJ: Prentice Hall, 1994.
- P. Bentley, G. Nordehn, M. Coimbra, S. Mannor, G. Rita, The pascal classifying heart sounds challenge, sponsored by PASCAL, (2011), http://www.peterjbentley.com/heartchallenge/index.html.
- Classification of Normal/Abnormal Heart Sound Recordings, the PhysioNet/Computing in Cardiology Challenge (2016), https://www.physionet.org/challenge/2016/#challenge-data.

