
Manuscript accepted on :December 15, 2017
Published online on: --
Plagiarism Check: Yes
Taghreed Uloom Mohammed
Chemistry Department- College of Education for Pure Science (Ibn Al-haitham), Baghdad University.
Corresponding Author E-mail: tagreedaloom@gmail.com
DOI : https://dx.doi.org/10.13005/bpj/1333
Abstract
Acromegaly is a disease characterized by growth hormone and insulin like growth factor hypersecretion due mostly to pituitary somatotropic adenoma. The diagnosis of Acromegaly is typically deferred for years exposing patients to slowly progressing chronic complications. The present study consist of two parts, the part one was aim to study the lipid, lipoprotein profiles, insulin resistance and enzymes (alanine aminotransferase, aspartate aminotransferase, alkaline phosphatase) of 30 patients with actively secreting growth hormone (15 female and 15 male; aged 30-50 years). The other part is intended to analysis the GH1 gene mutation in Iraqi patients with growth hormone-producing pituitary tumors causing acromegaly. Genomic DNA was insulated from the patient and 10 healthy controls, and arranged for polymerase chain reaction analysis. Several pairs of primers were intended to amplify exons 1-5 of the growth hormone 1 gene and the polymerase chain reaction produced were sequenced to detect mutation.
Keywords
Gentic Study; Acromegaly; Lipid Profile; Insulin like Growth Factor-1
Download this article as:| Copy the following to cite this article: Mohammed T. U. Gene Expression and Clinical Manifestations in Iraqi Patients with Acromegaly. Biomed Pharmacol J 2017;10(4). |
| Copy the following to cite this URL: Mohammed T. U. Gene Expression and Clinical Manifestations in Iraqi Patients with Acromegaly. Biomed Pharmacol J 2017;10(4). Available from: http://biomedpharmajournal.org/?p=18222 |
Introduction
Acromegaly is initiated by extreme growth hormone (GH) secretion and secondary elevation of insulin-like growth factor-1 (IGF-1). The occurrence of acromegaly is deliberate to be 3 to 4 cases per million for every year.1 Because GH secretion is pulsatile, elevated serum IGF-1 levels are a useful screening tool for acromegaly.2
The extra GH has essential metabolic possessions; the two most important possessions of GH on metabolism in adipose tissue are insulin resistance (IR) and lipolysis. Insulin resistance, presenting as impaired glucose tolerance or diabetes, is initiate in most acromegaly patients and donates to the improved morbidity. Growth hormone convinces the expression and secretion of IGF-1, so phenotypes related with acromegaly may be owed to either GH signaling, IGF-1 signaling or a mixture of both.3,4
Treatment of acromegaly includes surgery, radiotherapy, administration of somatostatin analogs, as octreotide, or of dopamine agonists.5
Changes in IR and lipid metabolism, both current in acromegaly, have been defined as significant influences in the progress of the atherosclerosis and coronary heart disease.6,7
Limited studies addressing the influence of GH exactly on the subcutaneous adipose tissue. Induction of STAT5 tyrosine phosphorylation and IGF1 mRNA expression has been identified in human subcutaneous adipose tissue biopsies taken after acute GH administration.8 Subcutaneous adipocytes extracted from acromegalic patients are insulin resistant ex vivo and after a glucose tolerance test there was 50% less insulin binding to its receptor and significantly decreased insulin related anti-lipolytic activity.9 In vivo measurement in humans distinguished GH tempted lipolysis in subcutaneous adipose tissue.10 Pharmacologic inhibition of lipolysis reduced GH-induced IR, suggesting that some of this resistance is dependent on abundance of free acids.11 Microarray of gene expression has been published for subcutaneous adipose tissue biopsies before and after one year of treatment in GH deficient patients.12
The aim of this study was to evaluate and characterize the prevalence of elevated fasting blood glucose, uric acid, urea, creatinine, total bilirubin, lipid profile, alanine aminotransferase (ALT), aspartate aminotransferase (AST), alkaline phosphatase (ALP), and identification of definite gene for GPCR using specific primers and identification of difference in PCR analysis in patients with acromegaly and compared them with the healthy group.
Materials and Methods
Thirty patients were studied (15 female and 15 males), aged (30-50) years and 30 controls (16 female and 14 male) aged (30-50) years were recruited at the National Diabetic Center/ Al-Mustansiria University between December 2015 and the end of December 2016. In all the patients a preceding diagnosis of acromegaly had been definitely established by their distinctive clinical features and biochemical results.
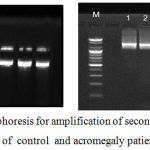 |
Figure 1: Agarose gel electrophoresis for amplification of second, third and four exon GH1 gene of control and acromegaly patients
|
Five milliliters of blood samples were drawn from every subjects after 12 hours overnight fast and after centrifugation, the serum was stored at -20oC until the assay time and genomic DNA extraction.
Serum GH and IGF-1 levels were measured using immunoradiometric assay for the in vitro determination in human serum and plasma (GH IRMA kit, a Beckman Coulter Company, English). Fasting serum glucose (FSG) level was determined after enzymatic oxidation in the presence of glucose oxidase as described by Trinder using the enzymatic method,13 blood urea (B.U) was determined by the urease-hypochlorite method using the Berthelot method,14 serum creatinine (S.Cr) was determined using the kinetic method, uric acid by the uricase-peroxidase method 15 and total bilirubin were determined using colorimetric methods (Abbott, USA) kit.
Lipid profile including total cholesterol (TC), triacylglycerol (TAG), high density lipoprotein cholesterol (HDL-C), and low density lipoprotein cholesterol (LDL-C), were measured by the enzymatic colorimetric methods (Abbott, USA) kit.
Serum enzyme activities were measured according to the specific reaction of each enzyme using basic standard techniques. Therefore, the ALT and AST activities were measured according to the colorimetric method 16 and ALP were determined using enzymatic methods 17.
Genetic Studies
Genomic DNA of whole blood was extracted from buffy coat handbook protocol using Bioneer- kit. The eluted genomic DNA is stable and can be used immediately, or stored for later analysis at -20oC. Concentration and purity of DNA solution were assessed by using nano-drop spectrophotometer, by adding 2 µL of DNA solution in to the photocell of the apparatus. The concentration and purity (ng/mL) of DNA were deliberate by the following equation:
DNA concentration (ng/ml) = Absorbance (260 nm) x (50 mg/ml)
DNA purity= Abs at 260 nm/ Abs at 280
Amplification of GH1 Gene Using PCR
The reaction components were collected on ice and added in order with final volume of 25 µl as follows:
| Components | Reaction mixture (µl) | Final Concentration |
| PCR master mix | 5 | 2X |
| Forward Primer | 2 | 10 Pmol/ml |
| Reverse Ward Primer | 2 | 10 Pmol/ml |
| DNA Template | 5 | < 250 ng |
| Nuclease-Free Water | 11 |
The reaction components were mixed gently and spin quickly.
The PCR tube was transferred from ice to PCR machine amplification procedure was achieved conferring to the following program:
| Steps | Temperature (ºC) | Time | Cycle |
| Initial denaturation | 95 | 5 min | 1 |
| Denaturation | 95 | 30 sec | 35 |
| Annealing | 60 | 30sec | 35 |
| Extension | 72 | 1 min | 35 |
| Final extension | 72 | 5 min | 1 |
Stock primer (100 pmol) used to prepared dilution primer (10 pmol) by adding Nuclease-Free Water (1:10) and stored at -20°C.
Primers were used in this study, as shown in table (1), primers were intended depending on the sequence of the gene accountable for the production of GPCR on the chromosome.17
Table 1: Primers designed for GH1 gene amplification.
| Oligonucleotide primer | Sequence ( 5 — 3 ) | Size |
| GHF
GHR |
GACAGCTCACCTAGCTGCAA GCAGCCCGTAGTTCTTGAGT |
20 20 |
Horizontal electrophoresis unit was used in analyzed PCR product, agarose gel (1%) was prepared in 1X TBE buffer, gel was left to solidify in the tray, which transferred to the electrophoresis tank of the device and immersed with TBE buffer, the DNA samples was loaded into the wells. Electrophoresis was implemented at 5V/cm for 60 minute. The gel was stained with ethidium bromide stock solution for 15 min. The DNA bands were visualized on a UV trans-illuminator and photographed by using Gel Imaging System. DNA ladder (100bp) (BIONEER) was used to assess the molecular weight of DNA band.
Statistical Analysis
Data are represented by mean± standard error (SEM) and evaluated by analysis of variance (ANOVA). The statistical significant of comparisons was assessed by Dennett. The level of significant of P ≤ 0.05 was adopted.18
Results
Biochemical and hormonal parameters in acromegaly group and their control are demonstrated in table (2). There was significant increase in FSG in acromegaly as compared to control, (P >0.05) while, there was a significant decrease in S.Cr, uric acid and total bilirubin in acromegaly as compared to control, (P >0.0001) and total bilirubin. Also, there was a decrease in B.U in acromegaly as compared to control, but it was not significant.
Table 2: Biochemical and hormonal parameters in acromegaly group and their control (mean±SE)
| Clinical data | Acromegaly | Control |
| GH (ng/ml) | 25.76±1.22** | 2.77±0.67 |
| IGF-1(ng/ml) | 817.00±153.9**0 | 319.60±78.31 |
| FSG (mg/dl) | 151.40±13.01** | 82.77±1.35 |
| B.U (mg/dl) | 26.43±1.56 (NS) | 29.20±1.55 |
| Creatinin (mg/dl) | 0.67±0.03** | 0.72±0.07 |
| Uric acid (mg/dl) | 4.20±1.09** | 5.29±0.25 |
| Total bilirubin (mg/dl) | 0.36±0.04** | 0.67±0.06 |
| TC (mg/dl) | 164.90 ± 7.769** | 122.0 ± 3.807 |
| TAG (mg/dl) | 206 .63 ± 6.08** | 138.90 ± 4.797 |
| HDL-C (mg/dl) | 38.63 ± 1.23** | 49.48 ± 1.55 |
| LDL-C (mg/dl) | 119.40 ± 6.25** | 86.30 ± 2.44 |
| VLDL (mg/dl) | 28.20 ± 1.86** | 20.93 ± 0.97 |
As shown in table 3, statistically significant differences in TC, TAG, LDL, and VLDL were found in acromegaly patients as compared to control,( P>0.001). While, mean of HDL levels was significantly ( P>0.001) lower in patients with acromegaly than in control.
Table 3: Enzymes activity of acromegaly and their control (mean ± SE) in U/L
| Activity of enzyme | Acromegaly | Control |
| ALP | 173.0 ± 7.95** | 179 ± 11.52 |
| ALT | 12.73 ± 0.41** | 19.60 ± 1.59 |
| AST | 19.84 ± 0.79 (NS) | 19.30 ± 1.004 |
*P ˂ 0.05, **P ˂ 0.001, NS ( P < 0.05)
As presented in the table 4, ALP, and ALT serum levels were significantly lower in acromegaly patients as compared to control, (P>0.001). While no statistically significant differences in AST.
Genetic Analysis
Growth hormone gene (GH1) contain five exons which shielded with one primer to identify a defect in gene sequence among. Results of gel electrophoresis are revealed that primer intended to amplify GH gene gave one band for control but lacking amplified band in the patient 4 , 9, and 10 with molecular weight of this band is 800 bp. The sequence of the second, third and four exon was identity standard sequence found on the NCBI web site for case (4,9,10). The results illustrated that the case 4 presented some mutation (27 transition, 16 transversion) and (8 transition, 7 transversion) for case 9 the results, also, demonstrated that the case 10 presented some mutation (18 transition, 9 transversion).
Discussion
Acromegaly is caused by excessive secretion of (GH), and a resultant persistent elevation of (IGF-1) levels. The delay in diagnosis may exacerbate complications due to GH hyper secretion. Thus, the timely diagnosis of acromegaly is crucial. The diagnosis of acromegaly is based on both clinical and biochemical evidence. Once acromegaly is suspected, serum IGF-1 levels should be measured because a high degree of correlation has been noted between serum IGF-1 and acromegaly-associated factors.19 The random levels of GH are usually not helpful in diagnosis acromegaly because GH is secreted in a pulsatile fashion. Acromegaly in the absence of high IGF-1 levels is extremely rare. This relationship makes IGF-1 an ideal screening test.20
The present study in agree with the study of Hyaa,3 has observed that patients with acromegaly had elevated glucose and insulin levels with greater IR score this is due to decrease in insulin sensitivity in acromegaly patients, which is consistent with previous clinical findings.8
Some researchers have described levels of serum TC in acromegaly patients while the great majority of the results in the literature are not suggestive of significant variations as compared with suitable controls. The similar is accurate with the TAG levels; some researchers have not established significant variances in contrast to the control whereas others demonstrated hypertriglyceridemia in all acromegaly patients or in preponderance of them.20,21
Few studies have been implemented to analyze the lipoprotein profile in patients with acromegaly and the data have been inconsistent. The HDL-C has been defined to be compact in active acromegaly in specific reports but not in others.22
The mean of LDL-C and VLDL-C levels are significantly higher in the acromegaly patients than in control. These results are in agreement with the results by other authors.23
The mean of TG levels were significantly higher in the group of studied patients. These results are in agreement with those by other authors.24 However, Nikkila and Pelkonen found an occurrence 3 times higher of hypertriglyceridemia in acromegalics in relative to the general population. It has been recommended that the increase of the TAG levels in the acromegaly could be mediated, at least partly, by the reduced activity of the lipoprotein lipase and, possibly, of the hepatic lipase induced by the high levels of GH found in acromegaly.25 Thus, TC, LDL-C, and TAG levels were elevated in patients with acromegaly as contrasting to the control group, while HDL-C was reduced.
Patients with acromegaly had higher levels of glucose, higher insulin, and greater HOMA-IR score. It has been observed that several formerly described transcriptional change (IGF1, IGFBP3, CISH, SOCS2) that are known to be convinced by GH/IGF-1 in liver but are also convinced in adipose tissue. Also, identified several novel transcriptional modifications, some of which may be important for GH/IGF responses (PTPN3 and PTPN4) and the influences of acromegaly on growth and proliferation. Numerous differentially expressed transcripts may be essential in GH/IGF-1 convinced metabolic changes. Specifically, induction of LPL, ABHD5, and NRIP1 can donate to improved lipolysis and may explain the prominent adipose tissue lipolysis in acromegalic patients.8
The present study agreement with previous studies in a significant decreased of ALP activity .Some studies dependent on bone ALP as an parameter of acromegaly.26
Some previous studies contradicted the present data as designated a significant elevated in the level of enzymatic activity (AST, ALT, and ALP) in the serum. Others studies refers to pituitary surgery in patients with acromegaly led to a marked significant decrease in ALT activity.27 The results accessible here approve some preceding studies representing that active acromegaly is related with low serum levels of hepatic enzymes.
The protein encoded by GH gene is a affiliate of the somatotropin- prolactin family of hormones which play a vital role in growth control. The gene, along with four other associated genes, parsed in the same is located at the GH locus on chromosome 17 where they are interposed in the some transcriptional orientation an arrangement which is thought to have progressed by a series of gene duplications. The five genes share a abnormally high degree of sequence identity. Another splicing produces additional isoforms of each of the five GH, leading to further diversity and potential for specialization. This certain family affiliate is expressed in the pituitary but not in placental tissue as is the event for the other four genes in the GH locus. Mutations in or deletions of the gene lead to GH insufficiency and short stature.28
In over 90 percent of acromegaly patients, the overproduction of GH is initiated by a benign tumor of the pituitary gland, called an adenoma.29 Most pituitary tumors elevate instinctively and are not inherited. Many pituitary tumors elevate from a genetic modification in a single pituitary cell which leads to elevated cell division and tumor formation. This genetic modification, or mutation, is not found at birth, but is acquired through lifetime. The mutation happens in a gene that controls the transmission of chemical signs within pituitary cells; it perpetually switches on the sign that tells the cell to division and secrete GH. The proceedings within the cell that origin disordered pituitary cell growth and GH over secretion.30
Conclusions
This study have identified the acromegaly gene expression signature in human adipose tissue. The significance of improved expression of definite transcripts will improve this understanding of the metabolic and proliferative alterations related with acromegaly.
Acknowledgement
I would like to thank the University of Baghdad- Faculty of Education (Ibn Al-Haitham- Department of Chemistry to help me for complete this article.
Conflict of Interest
There is no conflict of interest.
Funding Source
The author.
References
- Khaleed J. K., Sabih Al-Shawk R., Mahdi A. R., Talib S. Hematological profile of patients with Acromegaly in Iraq. Iraqi Journal of Hematology. 2015;4(2):64-72.
- Narendra B. S., Dharmalingam M., Kalra P. Acromegaloidism Associated with Pituitary Incidentaloma. Journal of The Association of Physicians of India. 2015; 36:79.
- Hyaa M. L., Sun H. L., In-Ho Y., In Kyoung H and Ch H. Y. Acromegaly with Normal Insulin-Like growth Factor-1 Levels and Congestive Heart Failure as the First Clinical Manifestation.Endocrinology and Metabolism. 2015;30(3):395-401.
CrossRef - Vijayakuma A., Novosyadlyy R.,Wu Y., Yakar S., LeRoith D. Biological effect of growth hormone on carbohydrate and lipid metabolism. Growth Horm IGF Res. 2010;20:1-7.
CrossRef - Ayuk J., Sheppard M. C. Growth hormone and its disorders. Posrgrad Med J. 2006;82:24-30.
CrossRef - Keller U., Miles J. M. Horm Res. 1991;36(1):36-40.
CrossRef - Ifigenia K., Anastasios G., Ioannis K., Eleni X., Fotini C . H and Philippos K. Lipid levels in acromegaly. Endocrine Abstract. 2013;32:172.
- Hochberg I., Tran Q. T., Barkan A. L., Saltiel A. R., Chandler W. F., Bridges D. Gene Expression Signature in Adipose Tissue of Acromegaly Patients. PLOS ONE. 2015;10(6):e0129359.
CrossRef - Jørgensen J. O. L., Jessen N., Pedersen S. B., Vestergaard E., Gormsen L., Lund S. A., et al. GH receptor signaling in skeletal muscle and adipose tissue in human subjects following exposure to an intravenous GH bolus. Am J Physiol Endocrinol Metab. 2006;291:899–905.
- Bolinder J., Ostman J., Werner S., Arner P. Insulin action in human adipose tissue in acromegaly. J Clin Invest. 77:1201–1206.
- Gravhølt C. H., Schmitz O., Simonsen L., Bülow J., Christiansen J. S., Møller N., et al. Effects of a physiological GH pulse on interstitial glycerol in abdominal and femoral adipose tissue. Am J Physiol. 1986;277:848–854.
- Nielsen S., Møller N., Christiansen J. S., Jørgensen J. O. Pharmacological antilipolysis restores insulin sensitivity during growth hormone exposure. Diabetes. 2001;50:2301–2308.
CrossRef - Trinder P. Ann.Clin.Biochem. 1969;6:24.
CrossRef - Patton J. K and Crouch S. R. Anal. Chem. 1977;46:464-469.
CrossRef - Bartles H and Bohmer M. Clin. Chem. Acta. 1978; 37:193
CrossRef - Reitman S and Frankel S. A colorimetric method for the determination of serum glutamic Pyruvic . Am . J. Clin. Path. 1957;28:56.
CrossRef - Friedman R. B and Young D. S. Effects of Disease on Clinical Laboratory Tests, 3rd Edition, AACC Press .1997.
- Statical Analysis System . User’s Guide . statistical version 1th Ed . SAS . Inst . Inc .Cary . N.C .USA. 2012;9.
- Dong J., Hyuk S., J. A. E. H and et al. Acromegaly Associated with Type 2 Diabetes Showing Normal IGF-1 Levels under Poorly controlled Glycemia. Endocrine Journal. 2007;54(4):537-541.
CrossRef - Vilar L., et al., Increase of classic and nonclassic cardiovascular risk factors in patients with acromegaly. Endocr Pract. 2007;13(4):363-372.
CrossRef - Kenneth F., Eliot A. B., FAHA F and Carl G. The Effect of Endocrine Disorders on Lipids and Lipoproteins, NCBI. 2017.
CrossRef - Colao A., et al., Determinants of cardiac disease in newly diagnosed patients with acromegaly: results of a 10 year survey study. Eur J Endocrinol. 2011;165(5):713-721.
CrossRef - Boero L., et al., GH levels and insulin sensitivity are differently associated with biomarkers of cardiovascular disease in active acromegaly. Clin Endocrinol (Oxf). 2012;77(4):579-585.
CrossRef - Ciresi A., et al., The metabolic profile in active acromegaly is gender-specific. J Clin Endocrinol Metab. 2013;98(1):51-59.
- Nikkila E. A., Pelkonen R. Serum lipids in acromegaly. Metabolism. 1975;24:829-838.
CrossRef - Peter W., Rene B., Michael B and et al. Effect of pituitary surgery in patients with acromegaly serum concentrations and alanine aminotransferase activity. Clinica Chimica Acta. 2005;352(1-2):175-181.
CrossRef - Hampel R., Rose H. J., Jahreis G., Krabbe S., Meng W and Hesse V. Bone alkaline phosphatase as an activity parameter of acromegaly. Dtsch Med Wochenschr. 1990;115(10):363-366.
CrossRef - Barsh G. S., Seeburg P. H., Gelinas R. E. The human growth hormone gene family: structure and evolution of the chromosomal locus. Nucleic Acids Res. 1983;11(12):3939–3958.
CrossRef - Fieffe S., Morange I and Petrossians P. Diabetes in acromegaly prevalence,risk factors and evolution. Data from the French acromegaly registry. European Journal of Endocrinology. 2011;164:877-884.
CrossRef - Tamburrano G.,Durante C and Baldelli R. Therapy of diabetes and Dyslipidemia in acromegaly. Pituitary. 2002;5(1):27-31.
CrossRef

