
Manuscript accepted on :14-06-2021
Published online on: 24-06-2021
Plagiarism Check: Yes
Reviewed by: Dr. Dini Sri Damayanti
Second Review by: Dr. Salman Ahmed Pharmacognosy
Final Approval by: Dr Patorn Piromchai
Tiwuk Susantiningsih1,2, Feda A. Makkiyah1, Maria S. Thadeus1, Retno Yulianti1 and Sutopo Hadi3*
1Department of Medicine, Universitas Pembangunan Nasional Veteran Jakarta, 12450, Indonesia.
2Faculty of Medicine, Universitas Indonesia, Jakarta, Indonesia.
3Department of Chemistry, Universitas Lampung, Bandar Lampung, 35145, Indonesia.
Corresponding Author E-mail: tiwuksusantiningsih@upnvj.ac.id
DOI : https://dx.doi.org/10.13005/bpj/2172
Abstract
Obesity is linked to more deaths worldwide. In obesity, there will be a dysregulation of growth signals such as tumorigenesis. Despite the fact that obesity is tend to progress to acute liver damage, not many study using 2-nitropropane (2NP) as a hepatoxicity agent are undertaken especially in obese mice.This study aimed to determine the regime of 2NP that causes acute liver damage. This is an experimental research using a post-test control design group only, with 3 groups of mice ie O1 (obesity), O2+2-NP1x (induced by 2NP 100 mg/kg BW once), and O2+2-NP2x (induced by 2NP 100 mg/kgBW twice). At 10 weeks, rats were sacrificed and 100 mg liver tissue were collected for MDA, GSH, MnSOD and CAT enzymes analysis. Analysis statistics were performed by SPSS by one-way Anova and post hoc Tukey.MDA levels of mice were found to be increased in 2NP group than control (3.768 ± 0.407 nmol/mg) (p < 0,01). Liver GSH, MnSOD and CAT levels of both single injection 2-NP and repeated injection 2-NP groups decreased compared to those of controls (p<0,01). Repeated injection of 2-NP worsen the acute liver damage in obese mice.
Keywords
CAT; GSH; MDA; 2-NP; MnSOD; Obesity
Download this article as:| Copy the following to cite this article: Susantiningsih T, Makkiyah F. A, Thadeus M. S, Yulianti1 R, Hadi S. Progressive Acute Liver Damage Induced by Repeated 2-Nitropropane:Focused on Obese Mice. Biomed Pharmacol J 2021;14(2).. |
| Copy the following to cite this URL: Susantiningsih T, Makkiyah F. A, Thadeus M. S, Yulianti1 R, Hadi S. Progressive Acute Liver Damage Induced by Repeated 2-Nitropropane:Focused on Obese Mice. Biomed Pharmacol J 2021;14(2). Available from: https://bit.ly/3w1EVZf |
Introduction
The prevalence of obesity has increased tremendously in the late 50 years and now reached more than 250 million people world wide.1 Many consistent studies results show the strong correlation between obesity and cancer. Dysregulation of growth signals and also chronic inflammation that persist for long-duration lead to cancer in obese patients.2One of the cancers that occur most oftenin obese people is hepatocellular carcinoma(HCC) which is the most common liver cancer. A study done by Hassan et al. reveals a link between early-onset obesity and subsequent risk of HCC.3
As well as many other cancers, liver cancer is regarded an “inflammatory cancer”, arising from a context of inflammation, and identifiedby inflammation-related mechanisms that oblige survival of tumorcell, proliferation, and invasion. Molecular mechanisms associate inflammation and neoplasia have been widely studied, and it has been well determined that inflammatory cells engaged at these sites with ongoing inflammatory activityliberatechemokines that amplify the production of reactive oxygen species.2
During carcinogenesis, there is an increase in ROS levels and a decrease in antioxidant levels that lead to oxidative stress. Following this process, cells and tissue degradation occur.3 Oxidative stress is characterized by an increase in the production of malondialdehyde (MDA) and a decrease in cellular enzyme activity, such as glutathione (GSH), MnSOD (manangese superoxide dismutase), and catalase(CAT).4
Hepatocellular carcinoma is a liver cancer originatesfrom hepatocyte [2].Many organic and and synthetic chemicals have been shown to produce liver cancer in animal models. One of the chemicals is 2-nitropropane (2-NP). This odorless solvent induce hepatocellular carcinoma in rats.5, 6
Although there have been numerous studies report about hepatocellular carcinoma, only a few that denote early occurrence of hepatocellular carcinomas induced by 2-NP in obese mice.7 This study demonstrated the obesity enhances acute liver damage and exposure more to the 2-NP increases the oxidative stress in obese liver mice.
Materials and Methods
Animals and Experimental Groups
A total number of 24 male, Swiss strain mice,60-80gram (obese), 6-8 weeks were enrolled in this study. Animals were assigned randomly to the following experimental groups (@ 8 mice): O1 (obesity control), O2+2NP 1x (obesity, induction of 2-Nitropropane 20mg/kg BW i.p once for 10 weeks), and O3+2NP 2x (obesity, induction of 2-Nitropropane 20mg/kg BWi.p twice for 10 weeks). (Figure 1) Mice were maintained by following with the guidelines of the NIH (Guide for the Care and Use of Laboratory Animals, 1976). All protocols were approved by the Animal Care and Use Committee of School of Medicine Universitas Pembangunan Nasional Veteran Jakarta. All mice were given free access to food and water throughout the study.
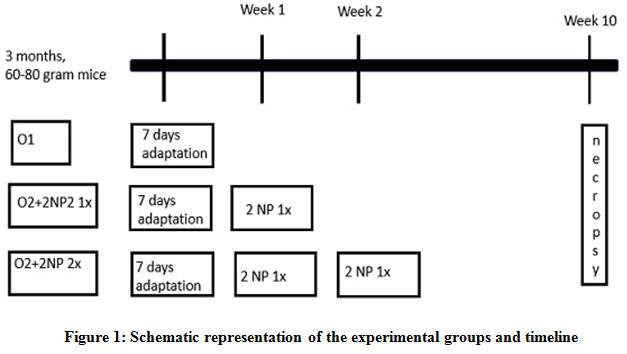 |
Figure 1: Schematic representation of the experimental groups and timeline |
Induction of 2-NP
Induction was done intraperitoneally. Because of its toxicity, meticolous attention to harmful agent induction was performed during injection of 2-NP. The injection was performed twice in the beginning of first week and second week in O2 +2-NP2x group. After induction, the alcohol wipe was applied to the skin. The study sample was determined according to the Federer formula for a completely randomized experimental design test.In order to avoid drop-out or died mice along the procedures, each group was added one mouse as a sample. Before the experiment, mice were adapted for 1 week in the Laboratory.
Harvesting Procedure
After 10 weeks, mice were anasthetized with ketamine-xylazine dose of 75-100mg/kg BW + 5-10mg/kg BW intraperitoneal. Cervical dislocation method was performed as a euthanasia procedure. Following a dislocation, incision and dissection of mice abdomen were performed to collect the liver. The liver was measured in weight by a digital weight scale and cut for 100mg. Thenext step was to put the liver in 1 mL PBS for every of 100mg liver tissue. The liver tissue was put in the tube and processed in homogenizer for 90 second and transferred to the centrifuge tube for 3500 rotation for 10 minutes. The supernatant was collected and inserted in different tubes. Tubes were kept for the following night in -20oC.
Examination ofMDA, GSH, MnSOD, CAT liver levels
Examination of liver MDA, GSH, Mn SOD,and CAT liver levels were carried out at the Laboratory of Department of Biochemistry, Faculty of Medicine, University of Indonesia. MDA levelswere examined using the will’s method. Reagents used in MDA standards were: Tetraethoxypropane (TEP), TCA 20% and TBA 0.67%. The liver sample was diluted four times, then measured by absorption readings using a 530 nm spectrophotometer. The results of sample concentration were obtained by plotting the sample absorbance data into a standard curve.
Measurement of GSH liver levels by Ellman methods. 50 µL homogenate supernatant was transferred to Eppendorf tube 1.5 mL and add TCA 5% 200 µL. Mixed in vortex 3-5second. Centrifuge at 5000 rpm for 10 minutes and collect the supernatant and put in 2 mL eppendorf tube. Add pH 8.0 PBS and mix until homogenous. Combine with 25 µLDTNB reagan until turns yellow because tionitro benzoate was formed after collection of SH by DTNB. Incubatefor an hour in dark room and read by a spectrophotometer in (λ)= 412 nm. All sample was measured twice to avoid mistakes in data collection.
Measurement of specific activity of MnSOD liver level was carried out using the RanSOD® Kit on the mice liver homogenate tissue. For each |measurement, a standard curve was also made using various concentrations according to the RanSOD kit used. The obtained equation was used to calculate the MnSOD levels of the sample. The specific activity of MnSOD liver level was calculated using units/mgs of protein so that the liver protein levels were also measured. Protein standard curves were created each time a protein level was measured using a standard solution of BSA protein (Bovine Serum Albumin). Standard uptake and samples were read by using a spectrophotometer at 280 nm wavelength. The equation obtained was used to calculate the protein content of the sample.
Measurement of CAT liver levels. 100 mg/mL homogenates after kept for one night were mixed by Buffer Phospate for 50 x dilution. 50 μL homogenate and mixed by 950 μL H2O2reagent 27,2 M. The formula was read by a spectophotometer at 210 nm. Record the data at 30th second (T0) and 150th second (T1). The measurement was done twice. The measurement was performed as well by PBS dilution.
Statistical Analysis
SPSS 22 statistical software was used to analyzed all data. MDA, mnSOD, GSH and Catalyse data were analyzed by one way a nova and post hoc Tukey. All data were presented with Graphprism software as mean±SD.The asterisk symbol (*) indicates a statistical difference. p<0.05 and p< 0.01 were considered significant.
Results and Discussions
Results and comparisons of MDA, GSH, MnSOD and CAT liver levels of the three groups were given in Figure2. MDA levels of mice were found to be increased in 2-nitropropane group than control (3.768 ± 0.407 nmol/mg). However, MDA liver levels of repeated injection of 2-nitropropane (4.986 ± 1.054 nmol/mg) were higher than both control and single injection of 2-nitropropane group (4.482 ± 0.687nmol/mg) (p<0.01).
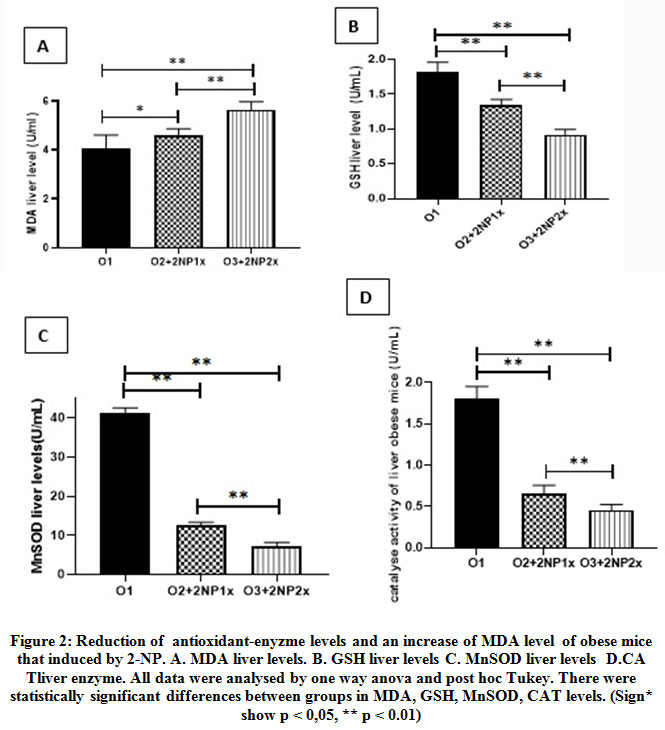 |
Figure 2: Reduction of antioxidant-enyzme levels and an increase of MDA level of obese mice that induced by 2-NP. A. MDA liver levels. B. GSH liver levels C. MnSOD liver levels D.CA Tliver enzyme.All data were analysed by one way anova and post hoc Tukey. There were statistically significant differences between groups in MDA, GSH, MnSOD, CAT levels. |
Figure 2 B, C, D, illustrates the results and comparisons of liver GSH, MnSOD and CAT levels of three groups. Liver GSH, MnSOD and CAT levels of both once 2-nitropropane and twice 2-nitropropane administered groups decreased compared to those of controls (p<0,01). In addition, the decreased pattern of MnSOD and CAT level was almost similar, the 2/3-3/4 reduction occurred in the treatment group. However, the 1/3-1/2 reduction occurred in GSH liver level in the treatment group compared to thecontrol group. Repeated injection 2-NP group had higher level of MDA and lower levels GSH, MnSOD and CAT liver leves (p<0.01) as shown in Figure 3.
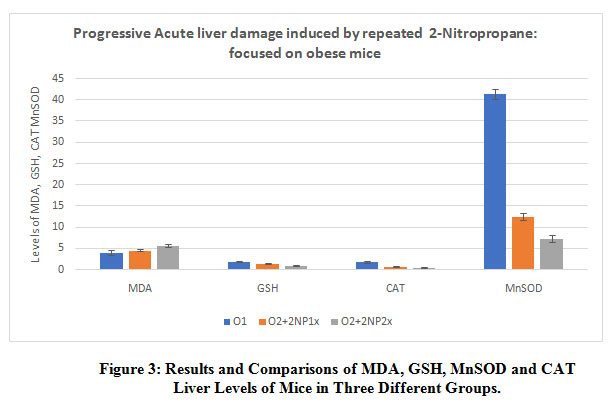 |
Figure 3: Results and Comparisons of MDA, GSH, MnSOD and CAT Liver Levels of Mice in Three Different Groups. |
In this present study, 2-nitropropane was able to show its toxicity in mice livers. This study showed there was significant increases in liver MDA levels of 2-NP group compared to the control group. Contrast to MDA levels, GSH,MnSOD and CAT of liver levels were decreased remarkably in both the 2-NP group than control group. Repeated injection of 2-NP showed the worsening of acute liver damage than a single injection of 2-NP.
In this study, a100mg/kg BW2-NP as a single or repeated injection increased hepatic lipid peroxide levels, an index of oxidative stress. In addition to LPO induction in the liver, we also confirmed its hepatotoxicity by measuring the decreaselevels of GSH, MnSOD and CAT activity, known to be oxidative markers of liver damage. The decrease in GSH, MnSOD, and CAT liver levels activity, as well as thenotably rise in hepatic LPO, suggests that a single or repeated injection of 2-NP exerted the hepatoxicity effects.The mechanism how 2-NP demonstrates its hepatotoxicity is not totally comprehended, but many authors drawed a conclusion that the metabolism of 2-NP may enhance ROS levels and cause cellular damage.8-10
2-NP, as a well-known hepatocarcinogen, damages hepatic DNA and RNA and causes the induction of modified bases such as 8-OHG and 8-oxo-7,8-dihydro-2’-deoxyguanosine (8-oxodG).11Recently, Each of these metabolites either directly or after their subsequent metabolism accounts for the induction of DNA damage. While these intermediates are well-known as oxidants capable of inducing DNA and RNA damage, they also have been shown to induce LPO.12
Obesity can increase the development of liver cancer through the accumulation of lipids in liver cells which will cause mitochondrial dysfunction resulting in an imbalance between the antioxidant and oxidant mechanisms. An imbalance between the two mechanisms causes an increase in ROS, causing chronic low-level inflammation of the liver. Obesity and inflammation are often manifested by an increase in oxidative stress markers such as MDA, as well as the use of endogenous antioxidants such as GSH, catalase, and MnSOD.5, 13Obesity is associated with a low-level chronic inflammatory condition with progressive infiltration of immune cells in adipose obesity tissue. Cytokines secreted by immune cells and adipokines of adipose tissue promote tissue inflammation. Adipokines induce the production of reactive oxygen species (ROS), producing a process known as oxidative stress (OS). One marker of cellular damage due to oxidative stress is malondialdehide (MDA).5
When obesity persists for a long time, the source of endogenous antioxidants may decline, such as enzyme activity such as Glutathione (GSH), superoxide dismutase (MnSOD) and catalase (CAT). SOD and glutathione peroxidase (GPx) activity in individuals with obesity was significantly lower than in healthy people.The mechanisms responsible for the high state of oxidative stress in obesity are not yet known, but clearlyand inflammatory stress mediators as it contributes to the production of free radicals.14
In the present study induction 2-nitropropane causes damage to lipid peroxidation, subsequently the number of antioxidants increased. Sabah showed there was a decrease of glutathione peroxidase in obese children.15Important thing to note thatsusceptible individuals, including obese subjects, increased levels of oxidative stress and inflammation may contribute to an increased risk of developing solid and haematological cancers. Susantiningsihet al.examined the effect of treadmill exercise on oxidative stress markers and endogenous antioxidants in obese mice, showed a decrease in GSH levels in obese mice, presumably minimal chronic inflammation happened in hepatocytes.16
Regarding the regime of 2-NP, repeated dose of 100mg/kg BW of 2-nitropropane enhanced membrane damage than a single dose given. A similar result were shown by Lodovici who gave 100 mg/kg BW 2-NP and there was an increase of lipoperoxidationand levels of liver MDA in rats.6
Conclusion
Induction of single injection of 2-nitropropane 100 mg/kg BWand repeated injection affected the oxidative status and antioxidant liver levels of obesity mice. Repeated injection of 2-NP worsen the acute liver damage in obese mice.
Acknowledgement
The authors appreciated the help of Ministry of Higher Education for Internasional Journal Writing Workshop that held on September 2019. The authors thank the Dean, Vice Dean of Medical Faculty of Universitas Pembangunan Nasional Veteran Jakarta.
Conflict of Interest
The authors declare no conflict of interest to other parties.
References
- Organization WHO, Development WHOJDoS, June10 HEAfhwswiendmncdofpa: Obesity and overweight fact sheet. 2016. 2018.
- Cardin R, Piciocchi M, Bortolami M, Kotsafti A, Barzon L, Lavezzo E, Sinigaglia A, Rodriguez-Castro KI, Rugge M, Farinati F.Oxidative damage in the progression of chronic liver disease to hepatocellular carcinoma: an intricate pathway. World J. Gastroenterol.2014; 20(12):3078-3086.PMID: 2469659
- Hassan MH, Abdel-Wahab R, Kaseb A, Shalaby A, Phan AT, El-Serag HB, Hawk E, Morris J, Raghav KPS, Lee JS, Vauthey JN, Bortus G, Torres HA, Amos CI, Wolff RA, Li D. Obesity early in adulthood increases risk but does not affect outcomes of hepatocellular carcinoma.Gastroenterol.2015; 149(1):119-129.PMID: 25836985
CrossRef - Caldwell SH, Crespo DM, Kang HS, Al-Osaimi AMS. Obesity and hepatocellular carcinoma.Gastroenterology2004; 127(5):S97-S103.PMID: 15508109
CrossRef - Larsson S, Wolk A. Overweight, obesity and risk of liver cancer: a meta-analysis of cohort studies. Br. J. Cancer2007; 97(7):1005-1008.PMID: 17700568
CrossRef - CDC, The Effects of Obesity and Overweight on Health. https://www.cdc.gov/healthyweight/effects/index.html (Accessed on December 26, 2020)
- Dimyan MA, Cohen LG. Neuroplasticity in the context of motor rehabilitation after stroke.Nat. Rev. Neurol.2011; 7(2):76-85.PMID: 21243015
CrossRef - Kohl C, Morgan P, Gescher,A. Metabolism of the genotoxicant 2-nitropropane to a nitric oxide species.Chem. Biol. Interac.1995; 97(2):175-184.PMID: 7606815
CrossRef - Fiala ES, Conaway CC, Mathis JE. Oxidative DNA and RNA damage in the livers of Sprague-Dawley rats treated with the hepatocarcinogen 2-nitropropane.Cancer Res.1989; 49(20):5518-5522.PMID: 2477143
- Haas-Jobelius M, Coulston F, Korte F. Effects of short-term inhalation exposure to 1-nitropropane and 2-nitropropane on rat liver enzymes.Ecotoxicol. Environ. Safety1992; 23(3):253-259. https://doi.org/10.1016/0147-6513(92)90075-E
CrossRef - Lodovici M, Bigagli E, Luceri C, Manni EM, Zaid M. Protective effect of resveratrol against oxidation stress induced by 2-nitropropane in rat liver.Pharmacol. Pharm.2011; 2:127-135.https://doi.org/10.4236/pp.2011.23017
CrossRef - Kim SJ, Reiter RJ, Garay MVR, Qi W, El-Sokkary GH, Tan DX. 2-Nitropropane-induced lipid peroxidation: antitoxic effects of melatonin.Toxicology1998; 130(2-3):183-190.PMID: 9865485
CrossRef - Winarsi H, Wijayanti SPM, Purwanto A. Superoxide dismutase, catalase, and glutathione peroxidase enzymes activity in women with metabolic syndrome. Maj. Kedok. Band.2012; 44(1):8-12. (in Indonesian). http://dx.doi.org/10.15395/mkb.v44n1.75
CrossRef - Fernández-Sánchez A, Madrigal-Santillán E, Bautista M, Esquivel-Soto J, Morales-González Á, Esquivel-Chirino C, Durante-Montiel I, Sanchez-Rivera G, Valadez-Vega C, Morales-Gonzalez JA.Inflammation, oxidative stress, and obesity.Int. J. Mol. Sci.2011; 12(5):3117-3132.PMID: 21686173
CrossRef - Albuali WH. Evaluation of oxidant-antioxidant status in overweight and morbidly obese Saudi children. World J. Clin. Pediatr.2014; 3(1): 6-13.PMID: 25254179
CrossRef - Susantiningsih T, Perdani RRW, Berawi K, Hadi S. The Effect of Treadmill Treatment on Oxidative Stress Markers and Endogenous Antioxidant Status in Obesity Mice. Open Access Macedon. J. Med. Sci.2018; 6(10):1803-1808.PMID: 30455752
CrossRef

