
Manuscript accepted on :05 December 2018
Published online on: 20-06-2018
Plagiarism Check: Yes
Sapana Singh Yadav and Usha Chouhan
Department of Bioinformatics, Maulana Azad National Institute of Technology Bhopal, India.
Corresponding Author E-mail: sapanasy9@gmail.com
DOI : https://dx.doi.org/10.13005/bpj/1470
Abstract
Laminopathy is a group of rare genetic disorders, including EDMD, HGPS, Leukodystrophy and Lipodystrophy, caused by mutations in genes, encoding proteins of the nuclear lamina. Analysis of protein interaction network in the cell can be the key to understand; how complex processes, lead to diseases. Protein-protein interaction (PPI) in network analysis provides the possibility to quantify the hub proteins in large networks as well as their interacting partners. A comprehensive genes/proteins dataset related to Laminopathy is created by analysing public proteomic data and text mining of scientific literature. From this dataset the associated PPI network is acquired to understand the relationships between topology and functionality of the PPI network. The extended network of seed proteins including one giant network consisted of 381 nodes connected via 1594 edges (Fusion) and 390 nodes connected via 1645 edges (Coexpression), targeted for analysis. 20 proteins with high BC and large degree have been identified. LMNB1 and LMNA with highest BC and Closeness centrality located in the centre of the network. The backbone network derived from giant network with high BC proteins presents a clear and visual overview which shows all important proteins of Laminopathy and the crosstalk between them. Finally, the robustness of central proteins and accuracy of backbone are validated by 248 test networks. Based on the network topological parameters such as degree, closeness centrality, betweenness centrality we found out that integrated PPIN is centred on LMNB1 and LMNA. Although finding of other interacting partners strongly represented as novel drug targets for Laminopathy.
Keywords
Betweenness Centrality; Closeness Centrality; Laminopathy; Protein-protein Interaction network (PPIN)
Download this article as:| Copy the following to cite this article: Yadav S. S, Chouhan U. Analysis of Protein-Protein Interaction Network of Laminopathy Based on Topological Properties. Biomed Pharmacol J 2018;11(2). |
| Copy the following to cite this URL: Yadav S. S, Chouhan U. Analysis of Protein-Protein Interaction Network of Laminopathy Based on Topological Properties. Biomed Pharmacol J 2018;11(2). Available from: http://biomedpharmajournal.org/?p=20800 |
Introduction
Laminopathies, a group of rare genetic disorders caused by mutations in genes, encoding proteins of the nuclear lamina. Patients with classical laminopathy have mutations in the gene coding for lamin A/C (LMNA gene). Mutations in lamin B (LMNB2 gene) reported recently.1 In addition to providing structural support to the nucleus, lamins also contributes to nucleo-cytoskeletal coupling, cell cycle regulation, cell apoptosis, chromatin organization, DNA replication, transcriptional regulation and responses to oxidative stress.2 The nuclear envelope entered the medical area in the mid-1990s, when mutations in emerin were identified in patients with Emery-Dreifuss muscular dystrophy.3 The LMNA gene, encoding all A-type nuclear lamins, was linked to EDMD a few years later4,5 and links between nuclear structure and human disease have been studied extensively since then in labs throughout the world.
Biological networks can be used to describe biological interactions such as the atomic interactions occurring between protein structures, the interactions of metabolites and proteins during specific cellular events such as the cell cycle and, on a macroscopic level, the interrelationships between organisms in an ecosystem.6,7 Systems approaches aim to develop an understanding of the inter-relationships between proteins, metabolites or other molecules across organisms.8 Modern high-throughput techniques, taking measurements on a system-wide level, are well suited to the global analysis and modelling of networks for different diseases.9,10,11 In comparison to wet lab techniques, computational methods have the potential to reduce noise and systematic errors.12 Protein complexes are remarkable for understanding principles of cellular organization and function.8 High throughput experimental techniques have generated a large amount of protein interactions, which makes it doable to uncover protein complexes from protein protein interaction networks.13,14 A PPI network (PPIN) can be modelled as an undirected graph, where vertices stand for proteins and edges represent interactions between proteins.15 Protein complexes are set of proteins that interact with one another, typically dense subgraphs in PPI networks.14,16 To reveal the significance of the laminopathy disease, insilico based methodology have been used to identify the key proteins and their interactor. The integration of proteins interface structure into interaction graph models gives a better explanation of hub proteins, and builds up the relationship between the role of the hubs in the cell and their topological properties.17,18 In this study, the interactions among the proteins have been implemented to produce and analyse a giant network by the topological analysis of the PPIN derived from the genes/proteins related to Emery-Dreifuss muscular dystrophy(EDMD),4,19 Hutchinson-Gilford Progeria Syndrome (HGPS),20-22 Leukodystrophy23 and Lipodystrophy.24 Different bioinformatics tools related to the proposed methodology are implemented to construct the PPI network of candidate genes and analyzed the topological properties like degree, betweenness centrality (BC) and closeness centrality (CC).17
Method
Research methods used in this study mainly included five steps, first step: Extraction of candidate genes, second step: Construction of PPIN of the seed proteins, third step: Merging of all PPIN scanned from seed proteins, fourth step: Analysis of the giant PPIN according to topological properties, fifth step: Acquiring backbone network.
Extraction of the Candidate Genes
Extraction of the candidate genes related to EDMD, HGPS, Leukodystrophy and Lipodystrophy disease done by PolySearch text mining systems25 and NCBI database, which are web-based text mining system for extracting relationships between human diseases, genes, mutations, drugs and metabolites system and produce relevant information regarding individual query. As a result, 245 candidate genes associated with examining diseases obtained. To check the accuracy, the association of genes with disease is manually confirmed, and sorted the genes on the basis of Z score. The threshold for candidate genes set as Z score > 0. Finally, total 88 candidate genes are obtained, Table 1.
Table 1: The list of genes extracted from NCBI and PolySearch Text mining system database showing association with Progeria, EDMD, Leukodystrophy and Lipodystrophy
| S.No. | Symbol | Description | S.No. | Symbol | Description |
| HGPS | |||||
| 1 | BANF1 | Barrier To Autointegration Factor 1 | 45 | LMNB1 | Lamin B1 |
| 2 | C myc | Avian Myelocytomatosis | 46 | MAG | Myelin associated glycoprotein |
| 3 | DDX12 | DEAD/H (Asp-Glu-Ala-Asp/His) box polypeptide 12, pseudogene | 47 | MT-ND5 | Mitochondrially encoded NADH dehydrogenase 5 |
| 4 | ELN | Elastin | 48 | NDUFAF2 | NADH dehydrogenase (ubiquinone) complex I, assembly factor 2 |
| 5 | EMD | Emerin | 49 | NDUFAF4 | NADH dehydrogenase (ubiquinone) complex I, assembly factor 4 |
| 6 | ERCC1 | Excision repair cross-complementing rodent repair deficiency, complementation group 1 | 50 | NDUFS1 | NADH dehydrogenase (ubiquinone) Fe-S protein 1, |
| 7 | ERCC4 | Excision repair cross-complementing rodent repair deficiency, complementation group 4 | 51 | NDUFS2 | NADH dehydrogenase (ubiquinone) Fe-S protein 2, |
| 8 | ROBO3 | Roundabout, Axon Guidance Receptor, Homolog 3 | 52 | NDUFS7 | NADH dehydrogenase (ubiquinone) Fe-S protein 7, |
| 9 | LMNA | Lamin A/C | 53 | NDUFV1 | NADH dehydrogenase (ubiquinone) flavoprotein 1, 51kDa |
| 10 | MMP20 | Matrix Metallopeptidase 20 | 54 | NUBPL | Nucleotide binding protein-like |
| 11 | SIRT1 | Sirtuin 1 | 55 | PLP1 | Proteolipid protein 1 |
| 12 | SUN2 | Sad1 and UNC84 domain containing 2 | 56 | POLR3A | Polymerase (RNA) III (DNA directed) polypeptide A |
| 13 | WRN | Werner syndrome,RecQ helicase-like | 57 | POLR3B | Polymerase (RNA) III (DNA directed) polypeptide B |
| 14 | ZMPSTE24 | Zinc metallopeptidase STE24 | 58 | POU2F1 | POU class 2 homeobox 1 |
| EDMD | 59 | ||||
| 15 | BCLAF1 | BCL2-associated transcription factor 1 | 60 | SOX10 | SRY (sex determining region Y)-box 10 |
| 16 | EMD | Emerin | 61 | ST8SIA4 | ST8 alpha-N-acetyl-neuraminide alpha-2,8-sialyltransferase 4 |
| 17 | LMNA | Lamin A/C | 62 | SUMF1 | Sulfatase modifying factor 1 |
| 18 | SUN2 | Sad1 and UNC84 domain containing 2 | 63 | TREX1 | Three prime repair exonuclease 1 |
| 19 | SYN1 | Synapsin I | 64 | TUBB4 | Tubulin, beta 4A class Iva |
| 20 | SYN2 | Synapsin 2 | LIPODYSTROPHY | ||
| 21 | TMEM43 | Transmembrane protein 43 | 65 | AGPAT2 | 1-acylglycerol-3-phosphate O-acyltransferase 2 |
| 22 | TMPO | Thymopoietin | 66 | BANF1 | Barrier to autointegration factor 1 |
| 23 | YTHDC1 | YTH domain containing 1 | 67 | BSCL2 | Berardinelli-Seip congenital lipodystrophy 2 (seipin) |
| LEUKODYSTROPHY | 68 | CAV1 | Cavolin 1, Cavolae protein | ||
| 24 | ACOX1 | Acyl-CoA oxidase 1, palmitoyl | 69 | CIDEC | Cell death-inducing DFFA-like effector c |
| 25 | AIMP1 | Aminoacyl tRNA synthetase complex-interacting multifunctional
protein 1 |
70 | ENSG0000235715 | – |
| 26 | ARSA | Arylsulfatase A | 71 | FBN1 | Fibrillin 1 |
| 27 | ARSB | Arylsulfatase B | 72 | FOS | FBJ murine osteosarcoma viral oncogene homolog |
| 28 | ASPA | Aspartoacylase | 73 | GLMN | Glomulin, FKBP associated protein |
| 29 | C8orf38 | Chromosome 8 Open Reading Frame 38 | 74 | LMF1 | Lipase maturation factor 1 |
| 30 | C17orf68 | Chromosome 17 Open Reading Frame 68 | 75 | LMNA | Lamin A |
| 31 | C20orf7 | Chromosome 20 Open Reading Frame 7 | 76 | LMNB2 | Lamin B2 |
| 32 | CLCN2 | Chloride channel, voltage-sensitive 2 | 77 | LPIN1 | Lipin1 |
| 33 | EIF2B1 | Eukaryotic translation initiation factor 2B, subunit 1 alpha | 78 | LPIN2 | Lipin2 |
| 34 | EIF2B2 | Eukaryotic translation initiation factor 2B, subunit 2 beta | 79 | LPIN3 | Lipin3 |
| 35 | EIF2B3 | Eukaryotic translation initiation factor 2B, subunit 3 gamma | 80 | PIK3R1 | Phosphoinositide-3-kinase, regulatory subunit 1 |
| 36 | EIF2B4 | Eukaryotic translation initiation factor 2B, subunit 4 delta | 81 | PLIN1 | Perilipin1 |
| 37 | EIF2B5 | Eukaryotic translation initiation factor 2B, subunit 5 epsilon | 82 | POLD1 | Polymerase (DNA directed), delta 1, catalytic subuni1 |
| 38 | FA2H | Fatty acid 2-hydroxylase | 83 | PPARG | Peroxisome proliferator-activated receptor gamma |
| 39 | FAM126A | Family with sequence similarity 126, member A | 84 | PTRF | Polymerase I and transcript release factor |
| 40 | FOLR1 | Folate receptor 1 | 85 | RXRG | Retinoid X receptor, gamma |
| 41 | FOXRED1 | FAD-dependent oxidoreductase domain containing 1 | 86 | STAR | Steroidogenic acute regulatory protein |
| 42 | GALC | Galactosylceramidase | 87 | WRN | Werner syndrome,RecQ helicase-like |
| 43 | GFAP | Glial fibrillary acidic protein | 88 | ZMPSTE24 | Zinc metallopeptidase STE24 |
| 44 | GJC2 | Gap junction protein, gamma 2 | |||
Construction of PPI Network of the Seed Proteins
Candidate genes are converted to seed proteins, for each protein a PPIN extracted from the STRING database.26 Interactions in STRING are provided with a confidence score, and accessory information such as protein domains and 3D structures is made available, all within a stable and consistent identifier space. Fusion and coexpression attributes are fixed to construct the PPIN. Finally, we obtained different PPIN for different seed proteins.
Merging of all PPI Network Scanned from Seed Proteins
To merge all the PPIN of seed proteins within a single network called as extended network, Cytoscape v3.0.2 has been used,27,28 it provides a platform to analyze and visualize the extended network Figure 1 (a,b). Extended network included different distinct sub network, according to clustering of the seed proteins. Among them, only one network has been considered with the highest existing nodes and edges for further analysis. Such network consists of maximum interactions among the seed proteins and termed as a giant network shown in Figure 2 (a,b). Other sub localized networks are to be ignored as they have less interaction.
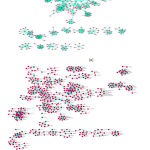 |
Figure 1: Overview of the extended network. (a) Fusion: 581 nodes and 2270 edges. (b) Coexpression: 585 nodes and 2340 edges, includes one giant network and thirteen separated small networks
|
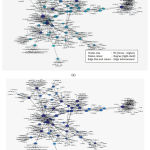 |
Figure 2: Topology of giant network (a) Fusion: 381 nodes and 1594 edges (b) Coexpression: 390 nodes, 1645 edges.
|
Analysis of the Giant PPI Network According to Topological Properties
PPI Network of relevant disease represented by an undirected graph G(V, E), where V represents the set of vertices in the graph G and E represents the set of edges.29 NetworkAnalyzer, was used to compute various network parameters.30 To predict and study the key nodes or hub proteins of the giant network topological parameters have been calculated. Therefore, after analyzing the giant network, according to each distinct attribute degree, BC and CC values for each node have been calculated. That helps in finding the proteins of central positions in the network, as they can be highly important from a functional point of view too. In undirected networks, the node degree of a node n is the number of edges linked to n.29,31 The number of links of a node was observed to follow a power law distribution, that is, the probability of a node having degree k is proportional to k−γ, and the distribution is independent of the number of nodes; hence these networks are called scale free. Scale-free networks have many nodes with small degrees and allow nodes with high degrees (hubs) with decreasing probability.31 Betweenness measures how often nodes occur on the shortest paths between other nodes.32 For a graph G(V, E), with n vertices, the betweenness centrality CB(v) a vertex v is defined as,
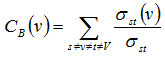
Where σst is the number of shortest paths from s to t, and σst(v) is the number of shortest paths from s to t that passes through a vertex v. Closeness centrality33 Cc(n) of a node n is defined as the reciprocal of the average shortest path length and is computed as,
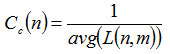
Where L(n,m) is the length of the shortest path between two nodes n and m. The closeness centrality of each node is a number between 0 and 1. In the PPIN the nodes with high degree defined as hub proteins and the nodes with high betweenness defined as bottleneck proteins.18
Acquiring Backbone Network
The proteins with high BC and degree should be profoundly used intersections, these proteins and links between them extracted from giant network, are called backbone network. To evolve a high BC range particular threshold fixed at 15% of the total nodes set of the network.34,35 As the founding of Backbone Network by both fusion and coexpression attribute is almost similar, so fusion attribute has been chosen for further analysis. Total number of nodes in the giant network is 381(fusion) among them 20 proteins with high BC value have been chosen which are LMNB1, TERF2, LMNA, CAV1, NDUFAF2, TP53, INS, MYC, PPARG, PCNA, KAT5, EMD, EP300, KAT2B, PLIN1, AIMP1, AGPAT2, TGFB1, SRC, PPARGC1A to form backbone network Figure 3.
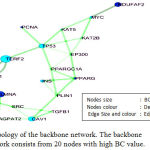 |
Figure 3: Topology of the backbone network. The backbone network consists from 20 nodes with high BC value.
|
Results and Discussion
In this study, the effects and important role of individual protein/gene of related disease has been illustrated. The analysis depends on the kind of methodology applied to construct the merged network. The aim is to find out the contribution of these proteins to the pathogenesis of Laminopathy and discover other key proteins cooperating with them by topological analyses.
PPI Network
Using PolySearch Text mining tools and NCBI database, 14 candidate genes related to HGPS, 9 to EDMD, 41 to the Leukodystrophy and 24 to the Lipodystrophy have been obtained, Table 1. These candidate genes are converted to seed proteins and obtained their interacting partners from STRING database, a precomputed database for the exploration of PPI. Coexpression and fusion attributes of PPI have been chosen to analyse the merged network, so two different merged networks are generated. Fusion attribute has been considered first, as it is the most relevant attribute described in, for the analysis of disease PPIN. In this case the merged network with 581 nodes and 2270 edges shown in Figure 1(a), is a combination of thirteen different sub networks. LMNB1, DDX12, SIRT1, ROBO3, TGFB3, ELN, MMP20, ERCC1, TMEM43, YTHDC1, ARSA, EIF2B3, GALC, PLP1 are the seed proteins while playing the central role in each fourteen sub networks. These nodes are distributed in fourteen different clusters according to interaction possibility. The large network among them, in which LMNB1 playing the role of central protein, consists of 381 nodes and 1594 edges extracted as giant network shown in Figure 2(a). Similarly, considering the coexpression attribute the merged network consists of 585 nodes and 2340 edges and 14 subnetworks shown in Figure 1(b). It is notified that in all two cases foresaid seed proteins are playing the key role in each sub network. The giant network consists of 390 nodes and 1645 edges, according to coexpression attribute shown in Figure 2(b). Similar to fusion attributes in case of coexpression attribute LMNB1 is found as central protein of the giant network.
Key Nodes in the PPI Network
To predict and study the key nodes or hub proteins of the giant network, Topological parameters have been calculated with NetWorkAnalyzer. Three topological properties are essential to find out the key nodes of any network. Therefore, after getting the giant network, according to each distinct attribute the BC value of each node has to be measured and comparison can be made to find out the ascending order of the BC values. After calculation twenty proteins have been selected by a large BC value in case of fusion attributes they are LMNB1, TERF2, LMNA, CAV1, NDUFAF2, TP53, INS, MYC, PPARG, PCNA, KAT5, EMD, EP300, KAT2B, PLIN1, AIMP1, AGPAT2, TGFB1, SRC, PPARGC1A and these proteins form a backbone network. Among these proteins LMNB1 has highest BC value 0.287. TERF2, LMNA, CAV1, NDUFAF2, TP53, INS, MYC, PPARG, PCNA, KAT5, EMD, EP300, KAT2B, PLIN1, AIMP1, AGPAT2, TGFB1, SRC, PPARGC1A are other proteins with high BC and CC value, described in Table 2. The most interesting fact is that though TERF2, TP53, INS, PCNA, KAT5, EP300, KAT2B, TGFB1, SRC, PPARGC1A are having the high BC value but these proteins are not in the list of 88 seed proteins. Therefore, only ten proteins of the backbone network are in the list of seed proteins while having the highest BC value.
Table 2: List of high BC nodes and their CC values in giant network of (FUSION)
| SN | NODE | BC | CC |
| 1 | LMNB1 | 0.287009 | 0.291562 |
| 2 | TERF2 | 0.264808 | 0.236192 |
| 3 | LMNA | 0.26648 | 0.211383 |
| 4 | CAV1 | 0.252828 | 0.185034 |
| 5 | NDUFAF2 | 0.166011 | 0.181954 |
| 6 | TP53 | 0.255548 | 0.179216 |
| 7 | INS | 0.246593 | 0.143685 |
| 8 | MYC | 0.191243 | 0.134733 |
| 9 | PPARG | 0.240202 | 0.131876 |
| 10 | PCNA | 0.211228 | 0.12723 |
| 11 | KAT5 | 0.223136 | 0.11442 |
| 12 | EMD | 0.257627 | 0.110797 |
| 13 | EP300 | 0.240964 | 0.11072 |
| 14 | KAT2B | 0.223925 | 0.106568 |
| 15 | PLIN1 | 0.248204 | 0.104925 |
| 16 | AIMP1 | 0.233846 | 0.102976 |
| 17 | AGPAT2 | 0.247235 | 0.102683 |
| 18 | TGFB1 | 0.21814 | 0.090545 |
| 19 | SRC | 0.237204 | 0.082378 |
| 20 | PPARGC1A | 0.246914 | 0.080442 |
Similarly for the giant network of coexpression attribute the topological result is obtained and summarized in Table 3, in which LMNB1 and LMNA are the highest BC value 0.28 and 0.26 proteins among the twenty proteins TERF2, CAV, NDUFAF2, TP53, INS, MYC, PPARG, PCNA, KAT5, UBC, EP300, PLIN1, KAT2B, AIMP1, AGPAT2, EMD, TGFB1, PPARGC1A with high BC according to threshold. While in both cases if we consider degree and CC parameter, then we observed that LMNB1 had a larger degree 60 and CC 0.287009, 56 and CC 0.288362 for fusion and coexpression attribute respectively, Table 4 and Table 5. These results are in agreement with experimental results obtained by earlier research workers.2,3,5
Table 3: List of high BC nodes and their CC Values in giant network (COEXPRESSION)
| SN | NODE | BC | CC |
| 1 | LMNB1 | 0.288362 | 0.28601 |
| 2 | LMNA | 0.271648 | 0.235578 |
| 3 | TERF2 | 0.264806 | 0.23418 |
| 4 | CAV1 | 0.255753 | 0.184785 |
| 5 | NDUFAF2 | 0.164761 | 0.178153 |
| 6 | TP53 | 0.253916 | 0.173889 |
| 7 | INS | 0.246671 | 0.139105 |
| 8 | MYC | 0.189756 | 0.131964 |
| 9 | PPARG | 0.24042 | 0.128324 |
| 10 | PCNA | 0.20993 | 0.124217 |
| 11 | KAT5 | 0.2214 | 0.112157 |
| 12 | UBC | 0.245581 | 0.110331 |
| 13 | EP300 | 0.239827 | 0.107364 |
| 14 | PLIN1 | 0.249679 | 0.105244 |
| 15 | KAT2B | 0.222159 | 0.104436 |
| 16 | AIMP1 | 0.234479 | 0.100686 |
| 17 | AGPAT2 | 0.248721 | 0.09985 |
| 18 | EMD | 0.258988 | 0.097815 |
| 19 | TGFB1 | 0.219898 | 0.088545 |
| 20 | PPARGC1A | 0.246984 | 0.077938 |
Table 4: List of large Degree nodes and their CC values (FUSION)
| SN | NODE | DEGREE | CC |
| 1 | LMNB1 | 60 | 0.287009 |
| 2 | NDUFS7 | 44 | 0.144597 |
| 3 | NDUFS8 | 37 | 0.144542 |
| 4 | NDUFAF2 | 36 | 0.166011 |
| 5 | LMNA | 34 | 0.26648 |
| 6 | PPARG | 33 | 0.240202 |
| 7 | PCNA | 33 | 0.211228 |
| 8 | C20orf7 | 33 | 0.144377 |
| 9 | AGPAT2 | 29 | 0.247235 |
| 10 | SYNE1 | 29 | 0.265549 |
| 11 | SYNE2 | 28 | 0.264993 |
| 12 | BRCA1 | 27 | 0.24532 |
| 13 | NDUFS2 | 27 | 0.144432 |
| 14 | NDUFAF3 | 27 | 0.144103 |
| 15 | NDUFA1 | 26 | 0.143939 |
| 16 | AIMP1 | 25 | 0.233846 |
| 17 | NDUFAF4 | 25 | 0.144049 |
| 18 | FOXRED1 | 25 | 0.144049 |
| 19 | EMD | 24 | 0.257627 |
| 20 | NDUFS1 | 23 | 0.144213 |
Table 5: List of large Degree nodes and their CC values (COEXPRESSION)
| S.N. | NODE | DEGREE | CC |
| 1 | LMNB1 | 56 | 0.288362 |
| 2 | NDUFS7 | 49 | 0.143595 |
| 3 | LMNA | 41 | 0.271648 |
| 4 | NDUFS8 | 41 | 0.143542 |
| 5 | NDUFAF2 | 37 | 0.164761 |
| 6 | C20orf7 | 35 | 0.143384 |
| 7 | PPARG | 33 | 0.24042 |
| 8 | PCNA | 33 | 0.20993 |
| 9 | NDUFS2 | 32 | 0.143437 |
| 10 | NDUFV2 | 32 | 0.143278 |
| 11 | NDUFA2 | 31 | 0.143067 |
| 12 | FOXRED1 | 30 | 0.143067 |
| 13 | AGPAT2 | 29 | 0.248721 |
| 14 | NDUFV1 | 28 | 0.143225 |
| 15 | NDUFS1 | 28 | 0.143225 |
| 16 | AIMP1 | 26 | 0.234479 |
| 17 | EMD | 25 | 0.258988 |
| 18 | NDUFAF4 | 25 | 0.143067 |
| 19 | NDUFA1 | 25 | 0.142962 |
| 20 | MT-ND1 | 25 | 0.126217 |
Sub-Network Consisting of All Shortest Paths Between the Candidate Genes
In general, for any arbitrary network, it is not necessary that each node can be connected to each other. But in case of PPIN of any disease the giant network consists of those nodes which can be connected directly or indirectly to each node. So the interaction between the nodes significantly depends on the shortest path length between these two nodes, the shortest path length gives a description about active interactions among the nodes. Again the high BC value of any node depends on the number of shortest paths passing through a specific node. Therefore the high BC value of any nodes implies, having more number of shortest paths.
The Robustness of the Backbone Network and LMNA as A Central Protein
As a result twenty proteins with the largest BC value in the test networks acquired are LMNB1, TERF2, LMNA, CAV1, NDUFAF2, TP53, INS, MYC, PPARG, PCNA, KAT5, EMD, EP300, KAT2B, PLIN1, AIMP1, AGPAT2, TGFB1, SRC, PPARGC1A. The occurrence of LMNB1 and LMNA is more frequent than the other nodes which have high BC value. Among the total of 248 test network, the number of frequency of LMNB1 in test network is 210. The accuracy of the backbone network is 0.75807. It is examined that whenever the number of omitting genes is larger than 3 then the accuracy of backbone networks and frequency of the LMNB1 and LMNA are decreased continuously. Accuracy of backbone network (Fusion attribute) given in Table 6.
Table 6: Frequency of nodes with the largest BC value and accuracy of backbone in the 248 test networks
| Number of omitted genes | Frequency of nodes with the largest BC value in the test networks | Accuracy of the backbone |
Number of the test networks |
||||||
| LMNB1 | LMNA | TERF2 | CAV1 | NDUFAF2 | TP53 | INS | |||
| 1 | 88 | 0 | 0 | 0 | 0 | 0 | 0 | 0.78478 | 88 |
| 2 | 59 | 1 | 0 | 0 | 0 | 0 | 0 | 0.78206 | 60 |
| 3 | 14 | 4 | 1 | 0 | 1 | 0 | 0 | 0.76458 | 20 |
| 4 | 13 | 4 | 2 | 0 | 0 | 0 | 1 | 0.74654 | 20 |
| 5 | 13 | 4 | 1 | 1 | 0 | 0 | 1 | 0.74452 | 20 |
| 6 | 11 | 3 | 2 | 1 | 1 | 1 | 1 | 0.74255 | 20 |
| 7 | 12 | 4 | 3 | 0 | 1 | 0 | 0 | 0.74147 | 20 |
| Summary | 210 | 20 | 9 | 2 | 3 | 1 | 3 | 0.75807 | 248 |
Comparative Network Statics for Fusion and Coexpression
In this attempt the comparative analysis of the network was also performed, according to fusion and coexpression attributes to understand how the attributes can make an effect on our experimental disease network, is summarized in Table 7. The result of all the parameters has the same numeric value, only shortest path in case of coexpression is slightly higher which does not affect other parameters like BC value, CC value, clustering coefficient etc. in both cases we get LMNB1 as a central protein and same hub proteins.
Table 7: Comparative Network Statics For Fusion And Coexpression
| S.N. | Network statics | Fusion | Coexpression |
| 1 | Clustering Coefficient | 0.727 | 0.726 |
| 2 | Network diameter | 12 | 12 |
| 3 | Network radius | 6 | 6 |
| 4 | Network centralization | 0.072 | 0.071 |
| 5 | Shortest paths | 144780 | 151710 |
| 6 | Characteristic path length | 5.426 | 5.400 |
| 7 | Avg. No.of neighbours | 7.617 | 7.595 |
| 8 | Number of nodes | 381 | 390 |
| 9 | Network density | 0.02 | 0.02 |
| 10 | Network heterogeneity | 0.713 | 0.712 |
Graphical results of different topological parameters shown Figure 4 (a,b), explains the highest betweenness centrality in the giant network is approximate 0.3 and in that case the number of nodes is 60. This implies, the node having the highest betweenness value also having the highest number of neighbors which signifies evidences of the key node of the network. If we compare the second highest beetweenness value of the network, it is 0.25 (approx.) and consists of around 25 neighbors. Therefore the node having the first position in both cases of BC value and neighborhood, proving better candidature for the key role in extended merged giant network rather than the node having second position. NetworkAnalyzer can fit a power law to some topological parameters and follow the least squares method,36 and only points with positive coordinate values are considered for the fit, gives the correlation between the given data points and the corresponding points on the fitted curve. In addition, the R-squared value (also known as coefficient of determination) is reported. This coefficient gives the proportion of variability in a data set, which is explained by a fitted linear model. Therefore, the R-squared value is computed on logarithmized data, where the power-law curve: y = β xα is transformed into linear model: ln y = ln β + α ln x., here correlation between the data points and corresponding points on the line is approximately 0.528 and 0.480, R-squared value is 0.258 and 0.257 respectively for fusion and coexpression.
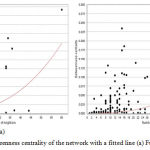 |
Figure 4: Betweenness centrality of the network with a fitted line (a) Fusion (b) Coexpression
|
Figure 5 (a,b), Graphical representation of the number of nodes in a giant network, according to degrees, graph shows the distribution of those nodes which are following minimum number of connectivity i.e. nodes are connected by at least one edge. Here we identified that when the number of nodes are 70 then the degree of such nodes is 10. Also, we observed that in some cases where the number of degrees was high, the number of nodes were less. This implies such nodes are not part of giant network and they made subnetwork which contains less nodes. Therefore the connectivity is high, but the node is less. NetworkAnalyzer provides another useful feature – fitting a line on the data points of some complex parameters. The method applied is the least squares method for linear regression.37 Fitting a line can be used to identify linear dependencies between the values of the x and y coordinates in a complex parameter. Figure 5 shows the fitted line on degree, having correlation between the data points and corresponding points on the line is approximately 0.607 and 0.463, R-squared value is 0.719 and 0.700 respectively for fusion and coexpression.
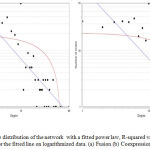 |
Figure 5: Node Degree distribution of the network with a fitted power law, R-squared value reported is the R-squared value for the fitted line on logarithmized data. (a) Fusion (b) Coexpression
|
Figure 6 (a,b), explains the value of closeness centrality of each node of the giant network, according to the number of neighbors. Clearly, it shows that only single node consists of highest CC value which is 0.28 approximate worth having 38 neighbors and graph also fitted to power law having corelation between data points and corresponding point on the line is approximately 0.237 and 0.238, R-squared value is 0.430 and 0.423. From similar concept, it is possible to conclude that this particular node can play the key role in the network.
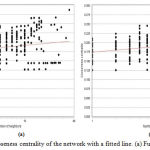 |
Figure 6: Closeness centrality of the network with a fitted line. (a) Fusion (b) Coexpression
|
Conclusion
In present study, we created a comprehensive initial dataset of genes statistically related to Laminopathy and a further expansion through the construction of related PPIN. Here we studies relationships between interacting proteins according to topological properties. We show that a protein or a hub of proteins can play an important role to interact with other proteins and also extend the PPI disease network. Again, it is possible to find out the key proteins, which are main mediator for two or more disease networks. Identifying such hub of proteins can help to understand the mechanism of pathways also it might be possible to emphasize that they have high functional importance in the cell. Most of seed proteins associated with Laminopathy and their PPI neighbors are connected to a giant network, which is analyzed by using different centrality indexes for hubs detection. Our findings suggested that Laminopathy disease mechanism and pathway is organized by an integrated PPI network centered on LAMIN gene product LMNA and LMNB1 proteins, while other proteins TERF2, LMNA, CAV1, NDUFAF2, TP53, INS, MYC, PPARG, PCNA, KAT5, EMD, EP300, KAT2B, PLIN1, AIMP1, AGPAT2, TGFB1, SRC, PPARGC1A with high BC values predict their significant role in a network. Also the analysis of backbone network presented a clear overview of all important genes, their related regulatory pathways for Laminopathy. The backbone network is robust against the changes of initial seed genes. The results may provide a basis for further experimental investigations to study PPI networks associated with Laminopathy and other relevant disease.
Acknowledgements
The authors are cordially thankful to the Madhya Pradesh Council of Science and Technology, Bhopal for providing financial support to carry out this work.
Conflict of Interest
There is no conflicts of interest
References
- Davidson PM, Lammerding J. Broken nuclei – lamins, nuclear mechanics and disease. Trends in cell biology. 2014. doi:10.1016/j.tcb.2013.11.004.
CrossRef - Burke B, Stewart CL. The laminopathies: the functional architecture of the nucleus and its contribution to disease. Annu Rev Genomics Hum Genet. 2006;7:369-405.
CrossRef - Bione S, Maestrini E, Rivella S, Mancini M, Regis S, Romeo G, and Toniolo D. Identification of a novel X-linked gene responsible for Emery-Dreifuss muscular dystrophy. Nat. Genet. 1994;8, 323–327.
CrossRef - Bonne G, Di Barletta M.R, Varnous S, Be cane H.M, Hammouda E H, Merlini L, Muntoni F, Greenberg, C. R, Gary F, Urtizberea J A, et al., Mutations in the gene encoding lamin A/C cause autosomal dominant Emery-Dreifuss muscular dystrophy. Nat. Genet. 1999;21,285–288.
CrossRef - Schreiber K, Kennedy B. When Lamins Go Bad: Nuclear Structure and Disease.Cell. 2013;152:1365–1375
CrossRef - Bruggeman FJ and Westerhoff HV. The nature of systems biology. Trends in Microbiology. 2007;15:45–50.
CrossRef - Alm E and Arkin A. Biological networks. Current Opinion in Structural Biology. 2003;13:193–202.
CrossRef - Barabasi AL and Oltvai Z. Network biology: understanding the cell’s functional organization. Nature Reviews Genetics. 2004;5:101–113.
CrossRef - Shruti Mishra and Debahuti Mishra. An Overview of Biological Networks: Mechanisms, Methodologies And Applications. Int J Pharm Bio Sci. 2016;7(3):979 –988.
- Ran J, Li H, Fu J, Liu L Xing YLi X , Shen H, Chen Y, Jiang X, Li Y and Li H. Construction and Analysis of the Protein Protein Interaction Network Related to Essential Hypertension. BMC Systems Biology. 2013;7(32):1752-0509.
CrossRef - LaCount DJ, Vignali M, Chettier R, Phansalkar A, Bell R, et al., A protein interaction network of the malaria parasite Plasmodium falciparum. Nature. 2005;438:103–107
CrossRef - Gilchrist M A, Salter L A, and Wagner A. A statistical framework for combining and interpreting proteomic datasets. Bioinformatics.2004;20:689–700.
CrossRef - Raman K. Construction and analysis of protein-protein interaction networks. Autom Exp, 2010;2:2.
CrossRef - Zhang Y, Lin H, Yang Z, Wang J. Integrating experimental and literature protein-protein interaction data for protein complex prediction. 2015;2:4. doi: 10.1186/1471-2164-16-S2-S4.
CrossRef - Ryan DP, Matthews JM. Protein-protein interactions in human disease. Curr Opin Struct Biol. 2005;15(4):441-446.
CrossRef - Sam L, Liu Y, Li J, Friedman C, Lussier YADiscovery of protein interaction networks shared by diseases. Pacific Symposium on Biocomputing. 2007;12:76-87.
- Doncheva N T, Assenov Y, Domingues S F and Albercht M. Topological Analysis and Visualization of Biological Networks and Protein Structures. Nature Protocols. 2012;7,670–685 doi:10.1038/nprot.2012.004.
CrossRef - Xu J, Li Y. Discovering disease-genes by topological features in human protein-protein interaction network. Bioinformatics. 2006;22:2800-2805.
CrossRef - Anne Helbling-Leclerc, Gisele Bonne and Ketty Schwartz. Emery-Dreifuss muscular dystrophy. European Journal of Human Genetics. 2002;10,157-161.
CrossRef - Eriksson M, Brown T W, Gordon L B, Glynn M W, Singer J, ScottL, Erdos M R, Robbins C M, Moses T Y, Berglund P, Dutra A, Pa E, Drukin S, Csoka A B, Boehnke M, Glover T W, and Collins F S. Recurrent De Novo Point Mutations In Lamin A Cause Hutchinson-Gilford Progeria Syndrome. Nature. 2003;423,293-298.
CrossRef - Scaffidi P, and Misteli T. Reversal of the cellular phenotype in the premature aging disease Hutchinson-Gilford progeria syndrome. Nature Medicine. 2005;11(4);440-445.
CrossRef - Goldman R. D, Shumaker D. K, Erdos M. R, Eriksson M, Goldman A. E, Gordon L. B, Gruenbaum Y, Khuon S, Mendez M and Collins F. S. Accumulation of mutant lamin A causes progressive changes in nuclear architecture in Hutchinson-Gilford progeria syndrome. Proc. Natl. Acad. Sci. 2008;101(24);8963-8968.
CrossRef - Quasar S. Padiath, Kazumasa Saigoh, Raphael Schiffmann, Hideaki Asahara, et al., Lamin B1 duplications cause autosomal dominant leukodystrophy. 2006; doi:10.1038/ng1872.
CrossRef - Huang I, Sleigh A, Rochford J. J and Savage D. B. Lipodystrophy: metabolic insights from a rare disorder. J Endocrinol. 2010; 207245-255.
- Cheng D, Knox C, Young N, Stothard P, Damaraju S, Wishart D. PolySearch: a web-based text mining system for extracting relationships between human diseases, genes, mutations, drugs and metabolites. 2008; doi: 10.1093/nar/gkn296.
CrossRef - Mering C, Jensen LJ, Snel B, Hooper SD, Krupp M, Foglierini M, Jouffre N, Huynen MA, Bork P. STRING: known and predicted protein protein associations, integrated and transferred across organisms. Nucleic Acids Res. 2005;433-437.
- Shannon P, Markiel A, Ozier O, Baliga NS, Wang JT, Ramage D, Amin N, Schwikowski B, Ideker T. Cytoscape: A Software Environment for Integrated Models of Biomolecular Interaction Networks. Genome Res. 2003;13(11):2498-2504.
CrossRef - Cline MS, Smoot M, Cerami E, Kuchinsky A, Landys N, Workman C, et al., Integration of biological networks and gene expression data using Cytoscape. 2007; doi:10.1038/nprot.2007.324
CrossRef - A K Dwivedi and Usha Chouhan. Simulated Annealing Model For Reticulate Evolution In Molecular Sequences. Int J Pharm Bio Sci. 2013;4(4):497-503.
- N T Doncheva, Y Assenov, F S Domingues, M lbrecht. Topological analysis and interactive visualization of biological networks and protein structures Nature Protocols. 2012;7:670–685. doi:10.1038/nprot.2012.004.
CrossRef - Diestel R. Graph theory. Springer-Verlag. Heidelberg. 2005;3-540-26182-6.
- Barabasi A.L and Albert R. Emergence of scaling in random networks. Science. 1999;286:509–512.
CrossRef - Brandes U.A faster algorithm for betweenness centrality. J Math Sociol. 2001;25:163-177.
CrossRef - Newman M. EJA measure of betweenness centrality based on random walks. arXiv condmat/0309045, 2003.
- Goni J, Esteban FJ, de Mendizabal NV, Sepulcre J, Ardanza-Trevijano S, Agirrezabal I, Villoslada P. A computational analysis of protein-protein interaction networks in neurodegenerative diseases. BMC Syst Biol. 2008;2:52.
CrossRef - Kim KK, Kim HB. Protein interaction network related to Helicobacter pylori infection response. World J Gastroenterol. 2009;15:4518–4528.
CrossRef - Weisstein E. W. Least Squares Fitting-Power Law. MathWorld – A Wolfram Web Resource.(http://mathworld.wolfram.com/LeastSquaresFittingPowerLaw.html).

