
Manoj Diwakar , Sumita Lamba and Himanshu Gupta
CSE Department, UIT, Uttaranchal University, Dehradun, India.
Corresponding Author E-mail: manoj.diwakar@gmail.com
DOI : https://dx.doi.org/10.13005/bpj/1420
Abstract
Computed tomography (CT) is a powerful tool for medical diagnosis. Due to acquisition and transmission in CT imaging, the noise appears that leads to poor image quality. Noise reduction technique is applied in CT images where noise is reduced with preserving all clinical information. In this paper, original noisy CT images are thresholded using bayes shrinkage rule in Shearlet domain. The proposed framework is compared with existing methods and it is observed that performance of proposed method is superior to existing methods in terms of visual quality, Image Quality Index (IQI) and Peak Signal-to-noise Ratio (PSNR).
Keywords
Computed Tomography; Shearlet; Thresholding Transform
Download this article as:| Copy the following to cite this article: Diwakar M, Lamba S, Gupta H. CT Image denoising Based on Thresholding in Shearlet Domain. Biomed Pharmacol J 2018;11(2). |
| Copy the following to cite this URL: Diwakar M, Lamba S, Gupta H. CT Image denoising Based on Thresholding in Shearlet Domain. Biomed Pharmacol J 2018;11(2). Available from: http://biomedpharmajournal.org/?p=20087 |
Introduction
In medical science, Computed tomography (CT) is one of the important tools which provide the view in the form of digital image of the human body’s internal structure for diagnosis purpose. In computed tomography, X-rays are projected with different-different angels over the human body where soft and hard tissues of human body are observed and other side, a detector is used to collect the observed data (raw data). Using Radon transform, these raw data are further mathematically computed and CT images are generated. Because of acquisition, transmission and mathematical computation, the reconstructed CT images may be degraded in terms of noise.
With the invention of CT, the research on noise reduction in CT has come into existence. The first articles1 and,2 of CT image denoising were published shortly after the invention of CT, where the concept of low-pass filtering was used. Authors concluded that the noise is effectively reduced and also enhanced the detectability of big objects from the noisy CT image. However, these methods have major problems such as over-smoothing of edges and decreasing the detectability of small structures.
Various techniques were investigated for controlling the noise in CT scan imaging. Projection based techniques in CT works on raw data or sinogram which comes through Radon transform where noise filtering was applied on raw data using linear or non-linear filters followed by filtered back-projection (FBP).3 Many iterative reconstruction approaches for noise suppression in CT were also investigated,4 by optimizing statistical objective functions. Iterative reconstruction techniques have the advantage that the noise statistics in the projections can directly be taken into account during the reconstruction process. The disadvantage, however, is the high computational cost of iterative methods. The other popular techniques are based on post-processing approaches. The main goal of these techniques are the structure preserving reduction of pixel noise in reconstructed CT images and improved signal-to-noise ratio (SNR) without increasing the radiation dose. A very important requirement for any noise reduction in CT images is that all clinically relevant image contents must be preserved. Especially, edges and small structures should not be affected.
Generally, images can be denoised into two domains:
(i) Spatial and (ii) transform domains.
Initially, in spatial domain, linear filters were used to denoised the images but it was not successful for preserving details over the images. Mean filtering was used to reduce the Gaussian noise but for high noise it produces blurry images. To overcome that, bilateral filtering,5 was further used. With non-linear filters in spatial domain, the noise is removed without any attempt to explicitly identify it. Spatial filters employ a low pass filtering on group of pixels with the assumption that the noise occupies the higher region of frequency spectrum. Generally, linear filters are used to remove noise but blurring problem may occur.
Naidich et al.6 analyzed the effect of low dose on CT images and found that low dose can help to provide CT images for diagnosis purpose. However, the quality of CT images was not as good as conducted by high dose CT images. Mayo et al.7 also tested on low dose CT images and observed that the photon detectors adapting less data will create the visual noise in the reconstructed CT images. They concluded that low dose CT images also meet with diagnostic requirements and further image processing algorithms would help to improve the quality of CT images.
In transform-domain denoising techniques, the input data is decomposed into its scale-space representation and have a property of energy compaction. It is observed from multi resolution based denoising techniques that (i) the noise and clean signal behave differently. (ii) Noise is detected on geometrical components and sharp transitions of images, and (iii) Most of the noise can be de detected from low resolution images.
In another approach, Shih et al.8 proposed a method to reduce the noise from the low-dose computed tomography (LDCT) images using multiresolution total variation minimization (MRTV) method. Here, discrete wavelet transform was performed over the CT images to decompose low and high frequency wavelet coefficients. These high frequency wavelet coefficients were further processed using total variation minimization with suitable tuning parameters. The CT image reconstructed by inverse wavelet transform is the denoised CT image. The results were tested on the Shepp-Logan phantom added with Gaussian white noise and also real head CT images. They concluded that results were improved in terms of signal-to-noise ratio in compare to total variation minimization methods. In another hybrid approach, Shao et al.9 proposed a new approach where two or more denoising methods were combined together. They analyzed two methods named: constrained least square filter algorithm and Lucy-Richardson algorithm. In analysis, they concluded that both methods were good and effective for image resolution but not efficient for denoising. Similarly, they perform denoising using Non-local Means filter algorithm and wavelet filter. Here, both approaches work effectively for noise suppression but have less impact to enhance resolution.
Skiadopoulos et al,10 analyzed a comparative study between multi-scale platelet denoising methods. They applied a Butterworth filter at the stage of pre and postprocessing on image reconstruction. The authors concluded that denoising by platelet and Butterworth postprocessing methods for without noise attenuation conditions outperformed on Butterworth pre-processing for large size defects. In another approach, Vandeghinste et al,11 proposed an alternative TV minimization based on split-Bregman based algorithm to perform iterative CT reconstruction using shearlet regularization. Shearlet model contained the structure in image using a non-piecewise constant image model which leads to different artifacts than in the case of TV. However, on acquired CT data, the textures are more similar to the reference texture than TV.
Silva et al.12 presented denoising techniques on high-determination processed tomography (HRCT) images where denoising is performed for tumor discrimination. Here, authors performed Wiener filtering, geometric mean filtering and Wavelet based thresholding. After analysis of this work, the authors concluded that wavelet denoising performs well for denoising, but it is difficult to say that wavelet denoising works well for all CT reconstructed images.
In transform domain, wavelet transform is used where images are decomposed into low and high frequency subbands. The noise has a tendency that it affects over the edges or detail parts in most of the cases. Thresholding is one of the popular ways to denoised the images in transform domain. Before thresholding, a threshold value is estimated which helps to denoised the images. To overcome that, many other transforms are used such as, dual-tree complex wavelet transform, curvelet, tetrolet, shearlet and so on. Recently many methods13,15 have been proposed based on the shearlet transform. These methods give better results in terms of noise reduction and edge preservation. However, thresholding concepts,16,20 have been differently performed via various transforms. Many image denoising methods,21,30 have been performed with the combination of spatial domain and transform domain methods. Some of the methods,31,34 follow the approaches by estimating similarity from neighborhood pixels. Each denoising method has their drawback. The major drawback of previous denoising methods is to missing the edges for higher noise.
In CT images, every small detail has their own significance and may be used for diagnosis purpose. With this consideration, a new scheme has been proposed for reduction of pixel noise with structure preserving in shearlet domain, which combines the advantages of Bilateral filter and Bayes shrinkage rule in shearlet domain. Experiment results demonstrated that the proposed method produces good denoising and improved signal-to-noise ratio (SNR) without increased dose. The paper is organized as follows. Section 2 gives a brief overview of Shearlet transform. In section, 3 the proposed method is presented in details. Experimental results, including a comparison with other denoising methods, are given in section.4 Finally, conclusions are summarized in section.5
Nonsubsampled Shearlet Transform (NSST)
The nonsubsampled shearlet transform (NSST) is an extended version of wavelet transform with a high directional sensitivity by inheriting the advantages of the classical theory of affine system. It contains five major properties: well localizing, spatial localizing, and highly directional sensitivity, parabolic scaling and optimally sparse. In NSST, the features of multi-dimensional and multi-directional are enhanced by combining the multi-scale and directional analysis. The low and high frequency components in NSST are obtained by using nonsubsampled Laplacian pyramid (NSLP). While, different subbands and direction shearlet coefficients are obtained using directional filtering. The shear matrix is generally used to perform the directional filtering which helps to provide the many more directions. The discrete shearlet transform can be represented effectively due to its mathematical framework. The discrete version of shearlets transform has an ability to deal with multi-dimensional functions.
Proposed Methodology
With the assumption, the CT images are corrupted by Gaussian noise with zero mean and different variances, the noisy CT image can be expressed as:
X (m,n) = Y (m,n) + η(m,n) (1)
Where, η(m,n) is a noise coefficient, X (m,n) and X (m,n) are noiseless and noisy images respectively.
In our proposed algorithm, two parallel approaches have been processed using bilateral filter and thresholding in shearlet domain.
To denoise high frequency subbands, a locally adaptive thresholding is performed using Bayes shrinkage function. By selecting small threshold value, the resultant image may be noisy. For large threshold value, the resultant image may blur on the edges. The selection of optimal threshold value is necessary and important task for preserving clinical details and suppression of noise.
The threshold λ can be selected as:
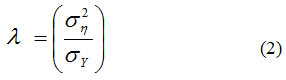
Where the noise variance can be estimated using robust median estimation method15 as follows:
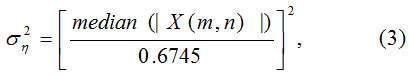
Where, X (m,n) ∈HHL, L represents respective level in wavelet decomposition. The standard deviation of noise less image(σY) can be estimated as:
![]()
Where,
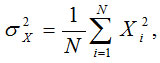
and N represent patch size of an input image.
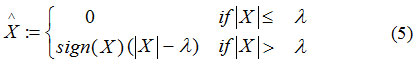
The thresholding function can be expressed as:
The proposed method can be expressed with the following major steps:
Step 1: Apply nonsubsampled shearlet transform (NSST) input noisy CT image (X) to obtain low and high frequency subbands.
Step 2: Perform thresholding over high frequency subbands using following steps:
Perform log transform on each high frequency subbands
Estimate noise variance using equation (3)
Perform thresholding on high frequency subbands using equation (5)
Apply Exponential function on thresholded high frequency subbands
Step 5: Apply inverse NSST to obtain CT denoised image.
Experimental Results
The proposed framework is applied on some CT images (size 512×512) corrupted by additive Gaussian noise at five different noise level σ ∈ [10, 15, 20, 25, 30, 35]. The CT scanned test images shown in figure 1(a-f) are obtained from public access database (https://eddie.via.cornell.edu/cgibin/datac/logon.cgi). Figure 1(a), 1(b), 1(c), 1(d), 1(e) and 1(f) are indicated as CT1, CT2, CT3, CT4, CT5 and CT6, respectively. Figure 2(a-f) is showing noisy test image data set with σ = 25.
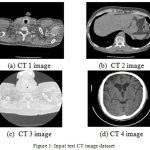 |
Figure 1: Input test CT image dataset
|
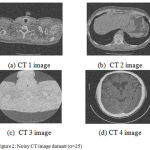 |
Figure 2: Noisy CT image dataset (σ=25)
|
Over the noisy input images, bilateral filter has been applied to get sharp and smooth image. In our results, several parameters for bilateral filtering are used such as patch size is 10X10, σS is 1.2 and σr is 0.13. By performing subtraction between original image and bilateral filtered image, it was analyzed that some independent and small features are missing for higher noise and low contrast CT images. To recover that, NSST is performed on both noisy input CT image and subtracted image. Both images are thresholded using bayes shrinkage function. After filtering of subtracted image, it was added with bilateral filtered image. It was considered as first intermediate result. The result of NSST based thresholding on original input noisy CT image was considered as second intermediate result. Over the both intermediate results, again NSST was performed to get low and high frequencies coefficients. On low frequency subbands, the variance difference has been estimated. With the variance difference, the fusion has been performed. Similarly on high frequency subbands, the correlation based similarity has been calculated, and a threshold value also calculated by taking an average of all correlation values. A comparison has been performed between threshold value and correlation values. Above than threshold value, the maximum value of high frequency has been taken. Otherwise, inverse variance based average has been performed. Finally, inverse NSST has been performed to get the final denoised CT image.13
The denoising results are obtained by proposed scheme and also compared with some existing methods. The existing methods for comparison are,13,14 and.15 Figures 3(a-f), 4(a-f), 5(a-f) and 6(a-f) are showing the results of,13,14,15 and proposed method respectively. For CT images (1-4), IQI and PSNR are measured for proposed method as well as existing methods with noise level σ,10,15,20,25,30,35 Peak Signal-to-noise Ratio (PSNR) is an important factor to evaluate denoising performance. The high PSNR value represents more similarity between the denoising and original image than lower PSNR value. The objective quality of the denoised image is measured by PSNR as:
![Figure 3: Results of [13]](https://biomedpharmajournal.org/wp-content/uploads/2018/04/Vol11No2_Ima_Man_fig3-150x150.jpg) |
Figure 3: Results of [13]
|
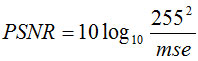
Where mse is the mean square error between the original and the denoised image:
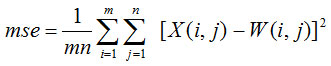
Image quality index (IQI) is another important factor to analyze the performance of image denoising in terms of correlation, luminance distortion and contrast distortion. For input image (X) and denoised image (W), the IQI can be defined as:
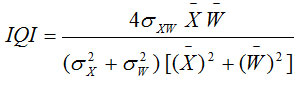
Where,
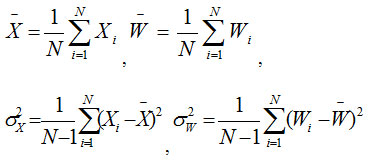
and
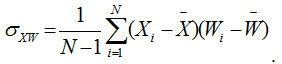
The quality of image index range lies between 1 and -1. The highest value 1 represents an identical value of input image pixel and denoised image pixel. The lowest value -1 shows that the pixels values are uncorrelated.
![Figure 4: Results of [14]](https://biomedpharmajournal.org/wp-content/uploads/2018/04/Vol11No2_Ima_Man_fig4-150x150.jpg) |
Figure 4: Results of [14]
|
![Figure 5: Results of [15]](https://biomedpharmajournal.org/wp-content/uploads/2018/04/Vol11No2_Ima_Man_fig5-150x150.jpg) |
Figure 5: Results of [15]
|
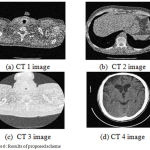 |
Figure 6: Results of proposed scheme
|
The obtained results of proposed scheme as shown in fig. 7, gives better results in terms of visual aspects. The IQI and PSNR results are shown in tables 1 and 2 respectively. The results of IQI and PSNR indicates that the proposed scheme obtained better values in compare of existing methods that most in the cases. The result of proposed scheme shows improved texture, noise suppression and sharp preserved edges.
Table 1: IQI of denoised images
| σ | [13] | [14] | [15] | Proposed method | |
| CT 1 imag | 10 | 0.993 | 0.9912 | 0.9924 | 0.9976 |
| 15 | 0.9534 | 0.9856 | 0.9762 | 0.9865 | |
| 20 | 0.9312 | 0.9541 | 0.9365 | 0.9597 | |
| 25 | 0.8972 | 0.9165 | 0.9174 | 0.9248 | |
| 30 | 0.8903 | 0.8954 | 0.8832 | 0.8962 | |
| 35 | 0.8894 | 0.8762 | 0.814 | 0.8747 | |
| CT 2 image | 10 | 0.9817 | 0.9828 | 0.9751 | 0.9889 |
| 15 | 0.9789 | 0.9794 | 0.9745 | 0.9831 | |
| 20 | 0.9421 | 0.9654 | 0.9241 | 0.9521 | |
| 25 | 0.8452 | 0.8684 | 0.8922 | 0.9047 | |
| 30 | 0.8364 | 0.8361 | 0.8632 | 0.8740 | |
| 35 | 0.8189 | 0.8314 | 0.8614 | 0.8694 | |
|
CT 3 image |
10 | 0.9874 | 0.9812 | 0.9914 | 0.9965 |
| 15 | 0.9514 | 0.9614 | 0.9762 | 0.9893 | |
| 20 | 0.9423 | 0.9591 | 0.9432 | 0.9614 | |
| 25 | 0.9102 | 0.9241 | 0.9397 | 0.9235 | |
| 30 | 0.8964 | 0.8931 | 0.8942 | 0.9131 | |
| 35 | 0.8831 | 0.8894 | 0.8913 | 0.8941 | |
| CT 4 image | 10 | 0.9871 | 0.9974 | 0.9954 | 0.9979 |
| 15 | 0.9642 | 0.9831 | 0.9645 | 0.9846 | |
| 20 | 0.9409 | 0.9641 | 0.9469 | 0.9698 | |
| 25 | 0.9123 | 0.9352 | 0.9231 | 0.9411 | |
| 30 | 0.8991 | 0.8978 | 0.8945 | 0.9006 | |
| 35 | 0.8647 | 0.8649 | 0.8791 | 0.8771 |
Table 2: PSNR of denoised images
| σ | [13] | [14] | [15] | Proposed method | |
| CT 1 image | 10 | 32.14 | 33.25 | 31.50 | 33.91 |
| 15 | 30.95 | 31.45 | 29.96 | 31.44 | |
| 20 | 29.45 | 30.10 | 28.21 | 30.05 | |
| 25 | 27.98 | 29.68 | 28.01 | 29.85 | |
| 30 | 26.31 | 28.47 | 27.25 | 28.54 | |
| 35 | 25.26 | 26.19 | 25.31 | 26.88 | |
| CT 2 image | 10 | 31.54 | 32.12 | 30.98 | 3247 |
| 15 | 30.87 | 30.64 | 29.42 | 31.05 | |
| 20 | 28.95 | 29.08 | 28.47 | 29.53 | |
| 25 | 28.48 | 28.64 | 27.26 | 28.96 | |
| 30 | 27.69 | 28.03 | 26.17 | 28.11 | |
| 35 | 25.83 | 26.96 | 25.34 | 26.97 | |
| CT 3 image | 10 | 32.33 | 33.19 | 31.98 | 33.89 |
| 15 | 31.29 | 31.25 | 30.67 | 31.87 | |
| 20 | 29.84 | 30.98 | 28.68 | 30.91 | |
| 25 | 27.15 | 29.27 | 28.34 | 29.31 | |
| 30 | 26.29 | 28.54 | 27.52 | 28.67 | |
| 35 | 24.36 | 26.65 | 24.64 | 26.73 | |
| CT 4 image | 10 | 32.65 | 33.65 | 31.63 | 33.79 |
| 15 | 31.35 | 31.24 | 29.26 | 31.35 | |
| 20 | 29.64 | 30.19 | 28.31 | 30.61 | |
| 25 | 27.45 | 29.34 | 28.72 | 29.36 | |
| 30 | 26.64 | 28.21 | 27.37 | 28.42 | |
| 35 | 25.39 | 26.94 | 25.61 | 26.61 |
Conclusions
For CT image denoising, the proposed method has been prepared by taking the advanteges of thresholded in shearlet domain and bilateral filtering. To make a balance between noise suppression and edge preservation, two outputs are obtained and a fusion process has been performed by using a single image. Visually, the results are excellent in terms of other similar kind of existing schemes. PSNR and IQI also indicate that proposed work gives better outcomes. Experimental evaluation demonstrate that proposed work: (i) effectively eliminate the noise in CT images, (ii) preserve the edge and structural information, and (iii) retain clinically relevant details.
Acknowledgement
The author(s) received no specific funding for this work.
References
- Rutherford A, Pullan B. R and Isherwood I. Measurement of effective atomic number and electron density using an EMI scanner. Neuroradiology.1976;11(1):15-21.
CrossRef - Chew Weiss G. H, Brooks R. A and Di Chiro G. Effect of CT noise on detectability of test objects. American Journal of Roentgenology.1978;131(4):681-685.
CrossRef - Fessler A, Edward P, Ficaro Neal.H . Clinthorne and Kenneth Lange Grouped-coordinate ascent algorithms for penalized-likelihood transmission image reconstruction. on med IEEE transactions ical imaging.1997;16(2):166-175.
CrossRef - Elbakri I and Jeffrey, Fessler A. Efficient and Accurate Llikelihood for Iterative Image Reconstruction in X-Ray Computed Tomography. SPIE.2003.
- Manduc L .Yu , Trzasko J, Khaylova N, Kofler J. M, McCollough C. M and ,Fletcher J. G. Projection space denoising with bilateral filtering and CT noise modeling for dose reduction in CT International.Journal of Medical Physics Research and Practice.2009;36(11):4911-4919.
- Dorothy and Arams McCauley I, Naidich P, Marshall Christopher H, Christopher Gribbin, Ronald S. Low-dose CT of the lungs preliminary observations. Radiology.1990;175( 3):729-731.
CrossRef - Mayo R, Thomas E, Hartman, Kyung Soo Lee, Steven L, Primack S. Vedal and N, Müller L. CT of the chest: minimal tube current required for good image quality with the least radiation dose. AJR. American. yjournal of roentgenolog.1995;164(3):603-607.
CrossRef - Shih H, Shu-Jun Chang, Yan-lin Liu, and Jay Wu. Noise reduction of low-dose computed tomography using the multi-resolution total variation minimization algorithm. In Proc SPIE.2013;8668-86682H-1.
CrossRef - Shao Jun, Ni and Changming Zhu. A Hybrid Method of Image Restoration and Denoise of CT Images. In Internet Computing for Science and Engineering (ICICSE).2012 Sixth International Conference on. IEEE.2013;117-121.
- Skiadopoulos A, Karatrantou P, Korfiatis L, Costaridou P, Vassilakos D, Apostolopoulos and G. Panayiotakis. Evaluating image denoising methods in myocardial perfusion single photon emission computed tomography (SPECT) imaging. Measurement Science and Technology.2009;20(1):104023.
CrossRef - Vandeghinste Bart, Goossens Roel ,Van Holen, Christian Vanhove, Aleksandra Pižurica, Stefaan Vandenberghe and Steven Staelens. Iterative CT reconstruction using shearlet-based regularization. IEEE Transactions on Nuclear Science.2013;60(5):3305-3317.
CrossRef - Silva, Augusto Silva, and Beatriz Sousa Santos. Image denoising methods for tumor discrimination in high-resolution computed tomography. Journal of digital imaging.2011;24(3):464-469.
CrossRef - Singh Deep Gupta, Anand S.R and Vinod Kumar. Nonsubsampled shearlet based CT and MR medical image fusion using biologically inspired spiking neural network. Biomedical Signal Processing and Control.2015;18:91-101.
CrossRef - Shen Qing Liu, Shuqin Lou and Ya-Li Hou. Wavelet-Based Total Variation and Nonlocal Similarity Model for Image Denoising. IEEE Signal Processing Letters.2017;24(6):877-881.
CrossRef - Guo Jing Qin and Wotao Yin. A new detail-preserving regularization scheme. SIAM journal on imaging sciences.2014;7(2):1309-1334.
CrossRef - Kim S, Ramani and J, Fessler A. Accelerating X-ray CT ordered subsets image reconstruction with Nesterov’s first-order methods. In Proc. Intl. Mtg. on Fully 3D Image Recon. in Rad and Nuc. Med.2013;22-5.
- Durand and J. Dorsey. Fast bilateral filtering for the display of high dynamic range images. ACM Transactions on Graphics.2002; 21(3):257–266.
CrossRef - Goldstein and S. Osher. The Split Bregman Method for L1 Regularized Problems. SIAM Journal on Imaging Sciences.2009;2(2): 323-34.
CrossRef - Chambolle. An algorithm for total variation minimization and applications. Journal of Matter Image and Visualization. Journal Roy Statistic Society.2004;20(1):89–97.
- Tomasi and R. Manduchi. Bilateral filtering for gray and color images. In Sixth International Conference on Computer Vision.Jan. 1998;836–846.
- Li L.Yu, Trzasko J. D, Lake D. S, Blezek D. J, Fletcher J. G, McCollough and C. H, Manduca A. Adaptive nonlocal means filtering based on local noise level for CT denoising International . Journal of Medical Physics Research and Practice.2014;41(1).
- Mallat. A theory for multiresolution signal decomposition: the wavelet representation. IEEE Trans. on Pattern Anal. Mach. Intell. 1989;11(7):674–693.
CrossRef - Fathi and A, Naghsh-Nilchi R. Efficient image denoising method based on a new adaptive wavelet packet thresholding function IEEE Trans Image Process.1989;21(9):3981–3990.
- Donoho I.L and Johnstone M. Ideal spatial adaptation via wavelet shrinkage Biometrika.1994;8:425–455.
CrossRef - Borsdorf R, Raupach T, Flohr J and Hornegger Tanaka.g. Wavelet Based Noise Reduction in CT-Images Using Correlation Analysis .IEEE Transactions. on Medical Imagin2008;27(12):1685–1703.
- Donoho L . De-noising by soft-thresholding. IEEE Transactions on Information Theory. 41(3);613–627. , Signal Process.2010;1995(90):8:2529-2539.
- Abramovitch, Sapatinas T and Silverman B. W. Wavelet thresholding via a Bayesian approach . Journal Roy Statistic Society.1998;60(4):725–749.
CrossRef - Romberg H, Choi and R. Baraniuk G. Bayesian wavelet domain image modeling using hidden Markov models. IEEE Transactions on Image Processing.2001;10:1056–1068.
CrossRef - Chang G,Yu and B, Vetterli M. Adaptive wavelet thresholding for image denoising and compression. IEEE Trans. on Image Proc.2000;9(9):1532–1546.
CrossRef - Xinhao M, Tanaka M and Okutomi. Single- Image Noise Level Estimation for Blind Denoising. IEEE Transactions. on Image Processing.2013;22(12):5226–5237.
CrossRef - Bhadauria S and M, Dewal L. Efficient Denoising Technique for CT images to Enhance Brain Hemorrhage Segmentation International.Journal of Digit Imaging.2012;25(6):782–791.
CrossRef - Jain and V. Tyagi. LAPB Locally adaptive patch-based wavelet domain edge-preserving image denoising .Journal of Information Sciences.2015;294:164–181.
CrossRef - Kingsbury C .The dualtree complex wavelet transform: a new efficient tool for image restoration and enhancement. In 9th European Signal Processing Conference (EUSIPCO 98).1998;319–322.
- Luisier, Florian and Thierry Blu. SURE-LET multichannel image denoising: interscale orthonormal wavelet thresholding. Image Processing. IEEE Transactions. on 17.2008;4:482-492.
- Easley G, Demetrio Labate and Wang-Q. Lim. Sparse directional image representations using the discrete shearlet transform. Applied and Computational Harmonic Analysis.2008;25(1):25-46.
CrossRef

