
Manuscript accepted on :February 25, 2016
Published online on: 04-04-2016
Plagiarism Check: Yes
Mohd Maroof Siddiqui1, Geetika Srivastava2, Syed Hasan Saeed3
Department of Electronics and Communication, Amity University, India-226028
DOI : https://dx.doi.org/10.13005/bpj/951
Abstract
This paper contains the study of nocturnal frontal lobe epilepsy (NFLE). This paper comprises the symptoms, causes, diagnosis, treatment etc. NFLE is a disease that normally occurs during sleeps in nights and arouses from frontal lobe and some people may suffer from mild seizure. The aim of the paper is to study the frequency analysis of PSD which is observed when the EEG signals are applied. The analysis is performed during all stages of sleep. Clipped signal of duration 1 minute has been used which consist of EEG signal of respective channel for different sleep stages. These clipped signals are passed to different windows, then the average and normalized power is measured and compared to the NFLE patient. Results are based on the delta, theta, alpha and beta segments of EEG signals.
Keywords
Symptoms of NFLE; Causes of NFLE; Diagnosis of NFLE; Analysis of EEG Signal; PSD Estimation
Download this article as:| Copy the following to cite this article: Siddiqui M. M, Srivastava G, Saeed S. H. Diagnosis of Nocturnal Frontal Lobe Epilepsy (NFLE) Sleep Disorder Using Short Time Frequency Analysis of PSD Approach Applied on EEG Signal. Biomed Pharmacol J 2016;9(1) |
| Copy the following to cite this URL: Siddiqui M. M, Srivastava G, Saeed S. H. Diagnosis of Nocturnal Frontal Lobe Epilepsy (NFLE) Sleep Disorder Using Short Time Frequency Analysis of PSD Approach Applied on EEG Signal. Biomed Pharmacol J 2016;9(1). Available from: http://biomedpharmajournal.org/?p=6709 |
Introduction
NFLE stands for Nocturnal frontal lobe epilepsy. NFLE begin from some words like nocturnal means something that happens at night, frontal refers to front part, lobe refers a fairly round flat part of ear, and lastly epilepsy refers to a prolonged disorder in which a person suffers from regular seizures .NFLE is a condition that occurs during sleep and which arises from the frontal lobe. Autosomal dominant nocturnal frontal lobe epilepsy (ADNFLE) is a form of epilepsy which is uncommon and normally found in families. Because of this disorder the person suffers from seizures during sleep. In some people they may wake up from sleep because of mild seizures. Some may have simple incidents that can include regular, sudden movements like bicycling movement of legs and motions of the arms. The person can get out of bed and roam around, and people thinks it is sleep walking. The individual may also sing songs, produce different voice, groaning sounds or cry. This disease can be misunderstood as night terrors or night mares.
The common symptoms of people suffering from ADNFLE are shivering, touchy, being pushed or feeling of falling ,a sense of fear. Some people also reported a feeling of choking, breathlessness or fast breathing. It is still unclear that what brings seizures in individual with ADNFLE. Seizures that dominate male is NFLE(7:3).
Symptoms of NFLE
Leg and arm movements like one arm is bend and the other one is extended, bicycle-pedalling or kicking of legs, boost hardening of the limbs or motion of legs. It occurs normally within 30 minutes after falling asleep, the person awakens from non-REM sleep. Produces different kinds of emotions, voices like screaming, singing patriotic songs, laughing, or can recite religious songs etc.After the seizure attack sudden return to sleep.
Leg and arm movements like one arm is bend and the other one is extended, bicycle-pedalling or kicking of legs, boost hardening of the limbs or motion of legs.
Causes oF NFLE
If one parent of the child has this frontal lobe epilepsy then the child has 50% of chance to inherit this.
An abnormal gene may cause this genetic disorder known as autosomal dominant nocturnal frontal lobe epilepsy.Frontal lobe seizures can be the result from abnormalities like infection, stroke, tumours, or shocking injuries in the frontal lobe of the brain.
In most of the cases, the cause remains unknown.
Diagnosis of NFLE
It is quite difficult to diagnose the frontal lobe epilepsy because the symptoms are same like sleep disorder or night terror and psychiatric problems.
There are three different methods from which it can be diagnosed:-
Brain Scan: Frontal lobe seizures are because of injuries, abnormal blood vessels or by tumours. To diagnose brain imaging normally magnetic resonance imaging Brain imaging is used. MRI produces very detailed images of brain by using magnetic field and radio waves.
Video EEG: It is usually performed in whole night observation. Both an EEG monitor and a video camera works together whole night. Doctors then matches the results what physically occurs when the person has a seizure with at the same time what appears on the EEG .
Electroencephalogram (EEG): It shows the electrical activity of the brain by using electrodes attached to the scalp. EEGs are also useful in diagnosing different types of epilepsy, but the results in frontal lobe epilepsy can be normal
Treatment of NFLE
In prior days there were not too options for treatment, but today there are many anti-seizure medication. There the two ways of treating NFLE, first one is surgery and other one is drug.
Medication: To control frontal lobe seizures all anti-seizure drug work equally, but not everyone can be seizure-free in medication. The aim of these medications is to reduce the occurrence of seizures and to limit the amount of extensive and rapid firing of neurons so that the neurons of focal region do not get activated. Although anticonvulsants can also used to reduce the seizures, there is no medication till this date has been discovered to prevent the development of epilepsy in head. There is a large range of anticonvulsants which has both types of different abilities to prevent some types of seizures and modes of action. Some anticonvulsants that are used to patients today are: Lamotrigine (Lamictal), Levetiracetam (Keppra), Topiramate (Topamax), Zonisamide (Zonegran) , Tiagabine (Gabitril), Pregabalin (Lyrica) , Phenytoin (DilantinKapseals), Carbamazepine (Tegretol) and Gabapentin (Neurontin).
Surgery
If these seizures cannot be controlled by medication, then surgery is the second option. It involves the treatment of the infected area where seizures occur in the brain. Usually the seizures that are not controlled by medication can be controlled by surgery or are successful.
Surgery may involve
Removal the focal point: If the seizures begin at only one point or spot in the brain then removal of that small portion may eliminate the seizure of the brain.
Isolation of focal point: If the part of the brain is too important to remove then surgeons can make a number of cuts to isolate the part of brain. It prevents the seizure to move into the other parts of the brain.
Stimulation of vagus nerve: Other option is to simulate A device, which is same as cardiac pacemaker, to stimulate the vagus nerve. This method usually removes the experience of seizure from patients.
Respond to seizure A responsive neuro stimulator (RNS) a new type of implanted device. It will get activated only when the person begins to have a seizure, and it stops the occurrence of seizure.
Subject Detail
Total Fifty six volunteer subjects’ were selected for this study. Forty subjects were suffering from the sleep disorder of NFLE and sixteen subjects were referred to as the normal group. The subject’s details like gender, age, sleep duration of each stage etc were taken. The subject demographics of both groups are shown in Table 1 and Table 2 respectively
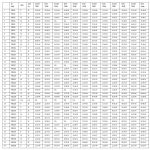 |
Table : 1 |
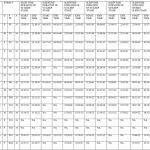 |
Table : 2 |
Results and Discussion
Figure 1 Shows various signals consisted by our biomedical signal. all signals are obtained by performing signal data extaction of data file named nfle1_edfm.mat. The detail of Matlab function named as ‘plotATM.m’ is given in Appendix A
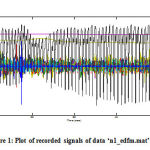 |
Figure 1: Plot of recorded signals of data ‘n1_edfm.mat’. |
On giving command load (matName) the signal with matName ‘nfle1_edfm.mat’ is loaded in MATLAB workspace and the name of various signal and their details are loaded from file ‘nfle1_edfm.info’. Load (matName) command gives a signal in workspace named as ‘val’ it has 20 signal and each signal of length 1000000 samples.
Extracting EEG Signal from Sleep Data
As mentioned in previous section that we have used a sleep data consist of 20 types of signal as shown in figgure 1. Out of these signals we have taken EEG channel for analysis of sleep disorder. Figure 2 shows the extracted EEG Signal of nfle1_edfm.mat (a) C4A1(b)ROC LOC channel in microwave level (mv).
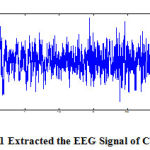 |
Figure 2.1: Extracted the EEG Signal of C4A1 |
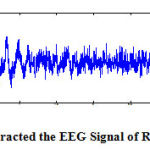 |
Figure 2.2 : Extracted the EEG Signal of ROC LOC |
Figure 2 shows a plot of EEG signal of a NFLE1 with data base ‘nfle1_edfm.mat. It shows the ROC LOC and C4A1 channel. We have shown the clipped signal of duration 1 minute consisting of EEG signal of respective channel for sleep stage REM. We can also extract in other sleep stage clips by the knowledge of t start and t end of other particular stage.
Filtering of EEG Signals for Sleep Stages
Now each clipped signal is pre-processed and passed to the slidding window. Then the clipped signal are passed to the hanning window low pass filter for removing the high frequency component that eventually indicate noise because major proportion of EEG signals are limited in range of 25Hz.
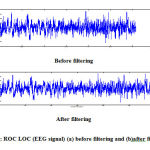 |
Figure 3: ROC LOC (EEG signal) (a) before filtering and (b)after filtering |
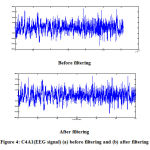 |
Figure 4: C4A1(EEG signal) (a) before filtering and (b) after filtering |
Figure 3 and 4 (a) shows the before filtering of ROC LOC and C4A1 channel of REM stage. We use low pass filter for filtering the signal for filtering we have used ‘filtfilt’ command that is why there is no phase error in the signal due to phase shifting caused by filter time delay filter signal do not contains minute variations in its waveform. And in figure 3 and 4 (b) shows the after filtering of ROC LOC and C4A1 channel.
Estimation of Power Spectral Density
PSE is most important application area in Digital Signal. Welch method have two basic modification to the Bartlett method. They allow the data length to overlap. The data segment can be represented as
NFLE case
REM stage
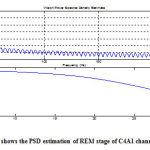 |
Figure 5: shows the PSD estimation of REM stage of C4A1 channel |
Calculation of Average Power and Normalized Power
After taking the power spectral density of REM stage of NFLE1 using short time window based PSD estimation we calculated average power and normalized power related to different EEG waves. Table shows the normalized power and average power of C4A1 channel for each stages.
Conclusion
Norchural seizure is important part of epilepsy. The normalized power is compared with the patient suffer from nocturnal frontal lobe epilepsy. The percentage EEG activity of the patient is observed from the normalized power
Table shown below indicates the delta, theta, alpha and beta activity of the normalized power for normal as well as patient suffering from nocturnal frontal lobe epilepsy.
Table 3(a): Comparison of normalized power (DELTA) for normal and NFLE patient of S0 stage.
| N1 | N2 | N4 | N11 | NFLE1 | NFLE2 | NFLE5 | NFLE6 | NFLE7 | |
| DELTA
(Normalized) |
0.34611 | 0.32519 | 0.3553 | 0.42274 | 0.72129 | 0.61586 | 0.64703 | 0.50809 | 0.63517 |
| LOW | HIGH | ||||||||
| N1 | N2 | N4 | N11 | NFLE8 | NFLE9 | NFLE14 | NFLE16 | NFLE17 | |
| DELTA
(Normalized) |
0.34611 | 0.32519 | 0.3553 | 0.42274 | 0.53376 | 0.57952 | 0.51976 | 0.56422 | 0.51636 |
| LOW | HIGH | ||||||||
| N1 | N2 | N4 | N11 | NFLE18 | NFLE19 | NFLE20 | NFLE23 | NFLE26 | |
| DELTA
(Normalized) |
0.34611 | 0.32519 | 0.3553 | 0.42274 | 0.55989 | 0.6664 | 0.47547 | 0.42316 | 0.67356 |
| LOW | HIGH | ||||||||
| N1 | N2 | N4 | N11 | NFLE28 | NFLE29 | NFLE34 | NFLE36 | |
| DELTA
(Normalized) |
0.34611 | 0.32519 | 0.3553 | 0.42274 | 0.50786 | 0.45086 | 0.45451 | 0.5144 |
| LOW | HIGH | |||||||
We found that DELTA activity in S0 stage, normalized power for normal cases is low of range 0.34611 to 0.4227 while for NFLE cases it is high, of the range 0.45086 to 0.72129.
Table 3(b): Comparison of normalized power (THETA) for normal and NFLE patient of S0 stage.
| N2 | N3 | N5 | NFLE3 | NFLE4 | NFLE8 | NFLE11 | NFLE13 | NFLE15 | |
| THETA
(Normalized) |
0.20356 | 0.25442 | 0.27849 | 0.36682 | 0.33249 | 0.31123 | 0.29828 | 0.28116 | 0.33171 |
| LOW | HIGH | ||||||||
| N2 | N3 | N5 | NFLE17 | NFLE18 | NFLE20 | NFLE21 | NFLE24 | NFLE28 | |
| THETA
(Normalized) |
0.20356 | 0.25442 | 0.27849 | 0.30127 | 0.29805 | 0.28804 | 0.29408 | 0.35688 | 0.33146 |
| LOW | HIGH | ||||||||
| N2 | N3 | N5 | NFLE29 | NFLE30 | NFLE31 | NFLE34 | NFLE35 | NFLE36 | |
| THETA
(Normalized) |
0.20356 | 0.25442 | 0.27849 | 0.28649 | 0.29784 | 0.40519 | 0.31741 | 0.34868 | 0.33333 |
| LOW | HIGH | ||||||||
| N2 | N3 | N5 | NFLE37 | NFLE38 | NFLE39 | NFLE40 | |
| THETA
(Normalized) |
0.20356 | 0.25442 | 0.27849 | 0.30027 | 0.31102 | 0.39815 | 0.3168 |
| LOW | HIGH | ||||||
We found that THETA activity in S0 stage, normalized power for normal cases is low of range 0.20356 to 0.27849 while for NFLE cases it is high, of the range 0.28649 to 0.40519.
Table 3(c): Comparison of normalized power (ALPHA) for normal and NFLE patient of S0 stage.
| N1 | N2 | N3 | NFLE1 | NFLE2 | NFLE4 | NFLE5 | NFLE6 | NFLE7 | |
| ALPHA
(Normalized) |
0.2942 | 0.35576 | 0.4929 | 0.074122 | 0.1266 | 0.25999 | 0.11904 | 0.28056 | 0.12213 |
| HIGH | LOW | ||||||||
| N2 | N3 | N5 | NFLE8 | NFLE 9 | NFLE 14 | NFLE 15 | NFLE 16 | NFLE17 | |
| ALPHA
(Normalized) |
0.20356 | 0.25442 | 0.27849 | 0.15337 | 0.1318 | 0.20467 | 0.26056 | 0.16739 | 0.17118 |
| HIGH | LOW | ||||||||
| N2 | N3 | N5 | NFLE18 | NFLE 19 | NFLE 20 | NFLE 22 | NFLE 26 | NFLE 28 | |
| ALPHA
(Normalized) |
0.20356 | 0.25442 | 0.27849 | 0.13381 | 0.15908 | 0.23113 | 0.16176 | 0.063129 | 0.15077 |
| HIGH | LOW | ||||||||
| N2 | N3 | N5 | NFLE 29 | NFLE 31 | NFLE 32 | NFLE 34 | NFLE 35 | NFLE 36 | |
| ALPHA
(Normalized) |
0.20356 | 0.25442 | 0.27849 | 0.23138 | 0.21989 | 0.080138 | 0.21631 | 0.27.394 | 0.14445 |
| HIGH | LOW | ||||||||
| N2 | N3 | N5 | NFLE 37 | NFLE 38 | |
| ALPHA
(Normalized |
0.20356 | 0.25442 | 0.27849 | 0.26426 | 0.26474 |
| HIGH | LOW | ||||
We found that ALPHA activity in S0 stage, normalized power for normal cases is high of range 0.2942 to 0.4929 while for NFLE cases it is high, of the range 0.074122 to 0.27394.
Table 3(d): Comparison of normalized power (BETA) for normal and NFLE patient of S0 stage.
| N1 | N2 | N3 | NFLE1 | NFLE 2 | NFLE 5 | NFLE 6 | NFLE 7 | NFLE 8 | |
| BETA
(Normalized) |
0.012503 | 0.044622 | 0.024201 | 0.005495 | 0.011738 | 0.009264 | 0.001648 | 0.011141 | 0.0016437 |
| HIGH | LOW | ||||||||
| N1 | N2 | N3 | NFLE 9 | NFLE 10 | NFLE 11 | NFLE 17 | NFLE 18 | NFLE 19 | |
| BETA
(Normalized) |
0.012503 | 0.044622 | 0.024201 | 0.011762 | 0.004794 | 0.0016737 | 0.011192 | 0.0082448 | 0.004295 |
| HIGH | LOW | ||||||||
| N1 | N2 | N3 | NFLE 20 | NFLE 23 | NFLE 24 | NFLE 26 | NFLE 28 | NFLE 31 | |
| BETA (Normalized) | 0.012503 | 0.044622 | 0.024201 | 0.005358 | 0.0095728 | 0.012315 | 0.0032965 | 0.009146 | 0.0045625 |
| HIGH | LOW | ||||||||
| N1 | N2 | N3 | NFLE 32 | NFLE 34 | NFLE 36 | |
| BETA
(Normalized) |
0.012503 | 0.044622 | 0.024201 | 0.00546687 | 0.011769 | 0.0078235 |
| HIGH | LOW | |||||
We found that BETA activity in S0 stage, normalized power for normal cases is high of range 0.012503 to 0.044622while for NFLE cases it is high, of the range 0.009146 to 0.011141.
Table 4(a): Comparison of normalized power (DELTA) for normal and NFLE patient of REM stage.
| N3 | N4 | N11 | NFLE2 | NFLE 3 | NFLE 4 | NFLE 5 | NFLE 6 | NFLE 7 | |
| DELTA
(Normalised) |
0.59256 | 0.63022 | 0.59588 | 0.49234 | 0.45853 | 0.55173 | 0.58535 | 0.52223 | 0.58062 |
| HIGH | LOW | ||||||||
| N3 | N4 | N11 | NFLE 11 | NFLE 12 | NFLE 13 | NFLE 14 | NFLE 15 | NFLE 16 | |
| DELTA
(Normalized) |
0.59256 | 0.63022 | 0.59588 | 0.4544 | 0.43024 | 0.52802 | 0.54948 | 0.49187 | 0.5618 |
| HIGH | LOW | ||||||||
| N3 | N4 | N11 | NFLE 17 | NFLE 21 | NFLE 22 | NFLE 23 | NFLE 24 | NFLE 28 | |
| DELTA
(Normalized) |
0.59256 | 0.63022 | 0.59588 | 0.55131 | 0.5529 | 0.52059 | 0.59522 | 0.54293 | 0.5226 |
| HIGH | LOW | ||||||||
| N3 | N4 | N11 | NFLE 29 | NFLE 30 | NFLE 31 | NFLE 32 | NFLE 34 | NFLE 35 | |
| DELTA
(Normalized) |
0.59256 | 0.63022 | 0.59588 | 0.58929 | 0.58545 | 0.56273 | 0.57892 | 0.55527 | 0.45142 |
| HIGH | LOW | ||||||||
| N3 | N4 | N11 | NFLE 36 | NFLE 38 | NFLE 39 | NFLE 40 | |
| DELTA
(Normalized) |
0.59256 | 0.63022 | 0.59588 | 0.55715 | 0.57257 | 0.52714 | 0.4342 |
| HIGH | LOW | ||||||
We found that DELTA activity in REM stage, normalized power for normal cases is high of 0.59588 to 0.63022 range while for NFLE cases it is high, of the range 0.4342 to 0.59522.
Table 4(b): Comparison of normalized power (THETA) for normal and NFLE patient of REM stage.
| N1 | N2 | N5 | NFLE1 | NFLE 4 | NFLE 5 | NFLE 6 | NFLE 7 | NFLE 8 | |
| THETA
(Normalized) |
0.35054 | 0.35889 | 0.33971 | 0.29405 | 0.31606 | 0.30549 | 0.30209 | 0.33898 | 0.25209 |
| HIGH | LOW | ||||||||
| N1 | N2 | N5 | NFLE 10 | NFLE 14 | NFLE 16 | NFLE 17 | NFLE 18 | NFLE 20 | |
| THETA
(Normalized) |
0.35054 | 0.35889 | 0.33971 | 0.25963 | 0.30051 | 0.29653 | 0.31866 | 0.31692 | 0.27724 |
| HIGH | LOW | ||||||||
| N1 | N2 | N5 | NFLE 21 | NFLE 23 | NFLE 24 | NFLE 26 | NFLE 29 | NFLE 30 | |
| THETA
(Normalized) |
0.35054 | 0.35889 | 0.33971 | 0.31605 | 0.28109 | 0.30181 | 0.25341 | 0.29867 | 0.30866 |
| HIGH | LOW | ||||||||
| N1 | N2 | N5 | NFLE 31 | NFLE 32 | NFLE 37 | NFLE 38 | |
| THETA
(Normalized) |
0.35054 | 0.35889 | 0.33971 | 0.33828 | 0.30923 | 0.30095 | 0.30298 |
| HIGH | LOW | ||||||
We found that THETA activity in REM stage, normalized power for normal cases is high of 0.35889 to 0.35054 range while for NFLE cases it is high, of the range 0.25641 to 0.33898.
Table 4(c): Comparison of normalized power (ALPHA) for normal and NFLE patient of REM stage.
| N3 | N4 | N5 | NFLE2 | NFLE 3 | NFLE 4 | NFLE 5 | NFLE 6 | NFLE 9 | |
| ALPHA
(Normalized) |
0.085918 | 0.098214 | 0.097007 | 0.1479 | 0.16105 | 0.12502 | 0.10454 | 0.17351 | 0.13968 |
| LOW | HIGH | ||||||||
| N3 | N4 | N5 | NFLE 10 | NFLE 11 | NFLE 12 | NFLE 13 | NFLE 14 | NFLE 15 | |
| ALPHA
(Normalized) |
0.085918 | 0.098214 | 0.097007 | 0.10939 | 0.18003 | 0.20134 | 0.10329 | 0.13891 | 0.12205 |
| LOW | HIGH | ||||||||
| N3 | N4 | N5 | NFLE 16 | NFLE 17 | NFLE 18 | NFLE 20 | NFLE 21 | NFLE 22 | |
| ALPHA
(Normalized) |
0.085918 | 0.098214 | 0.097007 | 0.13388 | 0.12478 | 0.71386 | 0.11459 | 0.12451 | 0.10871 |
| LOW | HIGH | ||||||||
| N3 | N4 | N5 | NFLE 23 | NFLE 24 | NFLE 28 | NFLE 29 | NFLE 30 | NFLE 32 | |
| ALPHA
(Normalized) |
0.085918 | 0.098214 | 0.097007 | 0.12174 | 0.14805 | 0.12023 | 0.10587 | 0.09910 | 0.1054 |
| LOW | HIGH | ||||||||
| N3 | N4 | N5 | NFLE 35 | NFLE 38 | NFLE 39 | NFLE 40 | |
| ALPHA
(Normalized) |
0.085918 | 0.098214 | 0.097007 | 0.16707 | 0.1172 | 0.10962 | 0.19227 |
| LOW | HIGH | ||||||
We found that ALPHA activity in REM stage, normalized power for normal cases is low of 0.085918 to 0.097007 range while for NFLE cases it is high, of the range 0.00910 to 0.19227.
Table 4(d): Comparison of normalized power (BETA) for normal and NFLE patient of REM stage.
| N2 | N3 | N4 | NFLE1 | NFLE 2 | NFLE 3 | NFLE 4 | NFLE 5 | NFLE 7 | |
| BETA
(Normalized) |
0.010826 | 0.0034986 | 0.0010153 | 0.00471 | 0.00798 | 0.0054993 | 0.00719 | 0.0046209 | 0.00351 |
| LOW | HIGH | ||||||||
| N2 | N3 | N4 | NFLE 9 | NFLE 15 | NFLE 16 | NFLE 17 | NFLE 21 | NFLE 22 | |
| BETA
(Normalized) |
0.010826 | 0.0034986 | 0.0010153 | 0.0061011 | 0.0059796 | 0.007791 | 0.0052512 | 0.0068514 | 0.0046653 |
| LOW | HIGH | ||||||||
| N2 | N3 | N4 | NFLE 24 | NFLE 26 | NFLE 28 | NFLE 29 | NFLE 30 | NFLE 32 | |
| BETA
(Normalized) |
0.010826 | 0.0034986 | 0.0010153 | 0.0072052 | 0.0064843 | 0.0047865 | 0.006169 | 0.0067980 | 0.0064567 |
| LOW | HIGH | ||||||||
| N2 | N3 | N4 | NFLE 34 | NFLE 35 | NFLE 36 | NFLE 37 | NFLE 38 | NFLE 40 | |
| BETA
(Normalized) |
0.010826 | 0.0034986 | 0.0010153 | 0.0038441 | 0.0066059 | 0.0051138 | 0.0033294 | 0.0072463 | 0.0099647 |
| LOW | HIGH | ||||||||
We found that ALPHA activity in REM stage, normalized power for normal cases is low of 0.0010153 to 0.0034986 range while for NFLE cases it is high, of the range 0.0099647 to 0.00351.
Abbreviations EEG: Electro Encephalogram; ROC-LOC: Right of Central & Left of Central; PSD: Power spectrum Density
References
- Cuppens, Kris, et al. “Detection of nocturnal frontal lobe seizures in pediatric patients by means of accelerometers: a first study.”Engineering in Medicine and Biology Society, 2009. EMBC 2009. Annual International Conference of the IEEE. IEEE, 2009.
- Mostacci, Barbara, et al. “Incidence of sudden unexpected death in nocturnal frontal lobe epilepsy: a cohort study.”Sleep medicine 2 (2015): 232-236.
- Bisulli, Francesca, et al. “Diagnostic accuracy of a structured interview for nocturnal frontal lobe epilepsy (SINFLE): a proposal for developing diagnostic criteria.”Sleep medicine 1 (2012): 81-87.
- Stevanović, G. “Frontal lobe epilepsies in childhood.”Clinical Neurophysiology 9 (2015): e179.
- Siddiqui, Mohd Maroof, et al. “Detection of rapid eye movement behaviour disorder using short time frequency analysis of PSD approach applied on EEG signal (ROC-LOC).”Biomedical Research 26.3 (2015): 587- 593
- http://physionet.org/cgi-bin/atm/ATM
- Siddiqui, Mohd Maroof, et al. “EEG Signals Play Major Role to diagnose Sleep Disorder.” International Journal of Electronics and Computer Science Engineering (IJECSE) 2.2 (2013): 503-505.
- Siddiqui, Mohd Maroof, et al. “Detection of Periodic Limb Movement with the Help of Short Time Frequency Analysis of PSD Applied on EEG Signals.” Extraction 4.11 (2015).
- Akhtar, Mahnaz, Khadim Abbas, and Mohd Maroof Siddiqui. “NOCTURNAL FRONTAL LOBE EPILEPSY (NFLE): MEDICAL SLEEP DISORDER.” International Conference on Emerging Trends in Technology, Science and Upcoming Research in Computer Science,DAVIM, Faridabad, 25th April, (2015):1168-1172
- Nobili, Lino, et al. “Nocturnal frontal lobe epilepsy.”Current neurology and neuroscience reports2 (2014): 1-11.
- Iasemidis, L. D., “Epileptic seizure prediction and control”, IEEE Trans.Biomed. Engng., 50, 2003, 549–558.
- Alexandros T. Tzallas, Markos G. Tsipouras, and Dimitrios I. Fotiadis, “Epileptic Seizure Detection in EEGs Using Time–Frequency Analysis” IEEE transactions on information technology in biomedicine, vol. 13, no. 5, September 2009
- Khandoker, A. H.; Palaniswami, M.; & Karmakar, C. K. “Automated scoring of obstructive sleep apnea and hypopnea events using short-term electrocardiogram recordings” IEEE Transactions On Information Technology In Biomedicine, Vol. 13, No.6, ( November 2009), pp. 1057-1067, ISSN 1089-7771.

