
Manuscript accepted on :
Published online on: 12-12-2015
Plagiarism Check: Yes
Rashmi Shah*, Uma Shankar Sharma and Abhay Tiwari
Rustamji Institute of Technology, BSF Academy, Tekanpur, Gwalior - 474 005, India. Corresponding Author E-mail: drrashmi_shah@yahoo.com
Abstract
Tekanpur is located at 25.980 North and 78.270 East. It has an average elevation of 190 metres (623 feet)1 . Fresh and pure water is essential for healthy environment to support the life systems on this planet2. Hence an assessment of drinking water quality in different aspects becomes necessary. In the present study, the physiochemical parameters of ground and lake water quality of Tekanpur (Gwalior, India) have been analyzed during October 2011 to September 2012. The physiochemical parameters studied were pH, color, odour, turbidity, total dissolved solids, nitrate, sulphate, chloride, dissolved oxygen, chemical oxygen demand, total hardness, total alkalinity and total coliform bacteria. Comparison of the physiochemical parameters of the water samples with BIS:105003 and WHO4 standards showed that better quality was found in pre monsoon season than post monsoon season.
Keywords
pH; COD; TDS; Total Coliform
Download this article as:| Copy the following to cite this article: Shah R, Sharma U. S, Tiwari A. Seasonal Variations in Drinking Water Quality of Tekanpur, Gwalior (India). Biomed Pharmacol J 2012;5(2) |
| Copy the following to cite this URL: Shah R, Sharma U. S, Tiwari A. Seasonal Variations in Drinking Water Quality of Tekanpur, Gwalior (India). Biomed Pharmacol J 2012;5(2). Available from: http://biomedpharmajournal.org/?p=2517 |
Introduction
Ground water is the major source of drinking water in both urban and rural areas 5. It is the most important source of water supply for drinking and irrigation purposes in rural areas. Ground water quality plays an important role in groundwater protection and quality conservation. Hence it is very important to assess the ground water quality not only for its present use but also from the view point of a potential source of water for future consumption6. Water sources available for drinking and other domestic purpose must possess high degree of purity, free from chemical contamination and micro-organism. The people of Tekanpur uses wells, bore wells and lake water for their daily activities and also for drinking purposes. This study was carried out to determine some physiochemical parameters of ground water samples and lake water in relation to water quality requirement for drinking purpose.
Materials and Methods
Study Area
Tekanpur is located at 25.980 North and 78.270 East. It has an average elevation of 190 metres (623 feet)1 . Weather is pleasant almost all the year around, sunny from October to mid-June and rainy from mid-June to September. The study area selected was total rural area. Main sources of drinking water in Tekanpur are wells, bore wells and lake water.
Sampling Points
Water samples were collected from bore wells, hand pumps and lake during pre and post-monsoon period of the year 2011-12 with cork specimen bottles. The various physiochemical parameters were analyzed (Table-1 & Table-2) according to the procedure prescribed by APHA (1995).
Results and Discussion
The results of physiochemical parameters of five sampling sites are shown in Table-1 & Table-2. It was found that all the water samples were colourless, odourless in nature. Some marked variations in the physical and chemical parameters were observed between sampling stations and seasons. The results showed that there was significant variation in some physiochemical parameters during pre and post monsoon.
Table 1: Average Results of Physiochemical Parameters in Pre- Monsoon Season
| S. No. | Parameters | Requirements As per ISI:10500,
1993 |
Test Method as per ISI | Tekanpur lake
Lakewater
S-1 |
CSMT
Bore well water S-2 |
Tekanpur Bus stand
Bore well water
S-3 |
RJIT
Bore well water
S-4 |
TCP
Bore well water
S-5 |
| 1. | pH Value | 6.5-8.5 | 3025
(Part-11) |
7.76 | 8.16 | 8.26 | 7.6 | 7.16 |
| 2. | Colour | 5.0 Max | 3025
(Part-4) |
>1 | >1 | >1 | >1 | >1 |
| 3. | Turbidity
(NTU) |
5.0 Max | 3025
(Part-10) |
>1 | 1.3 | 1.1 | 1.2 | 1.2 |
| 4. | TDS (mg/l) | 500 Max | 3025
(Part-16) |
220 | 375 | 472 | 235 | 424 |
| 5. | Nitrate(mg/l) | 45 | 3025
(Part-34) |
10.2 | 16.64 | 28.18 | 15.20 | 26.31 |
| 6. | Sulphate
(mg/l) |
200 | 3025
(Part-24) |
6.15 | 12.17 | 32.50 |
19.15 |
24.11 |
| 7. | Chloride
(mg/l) |
250 | 3025
(Part-32) |
142.5 | 148.2 | 232.7 | 205.2 | 75.6 |
| 8. | Dissolved Oxygen
(mg/l) |
5.0 (As per WHO) | APHA | 2.16 | 2.0 | 2.80 | 2.5 | 2.7 |
| 9. | COD(mg/l) | – | APHA | 26.60 | 24.90 | 25.15 | 27.70 | 29.80 |
| 10. | BOD(mg/l) | – | APHA | 9.2 | 8.4 | 6.2 | 9.4 | 9.3 |
| 11. | Total Hardness
(mg/l) |
300 Max | 3025
(Part-21) |
160 | 156 | 164 | 172 | 170 |
| 12. | Alkalinity
(mg/l) |
200 Max | 3025
(Part-23) |
350 | 380 | 480 | 520 | 390 |
| 13. | Total Coliform Bacteria (Per 100 ml) | 10 | IS1622-1998 | 02 | 01 | 02 | 01 | 01 |
(CSMT-Central School of Motor Transport, RJIT-Rustamji Institute of Technology, TCP- Tekanpur Check Post)
Table 2: Average Results of Physiochemical Parameters in Post- Monsoon Season.
| S. No. | Parameters | Requirements As per ISI:10500,
1993 |
Test Method as per ISI | Tekanpur Lake
Lake water
S-1 |
CSMT
Bore well water S-2 |
Tekanpur Bus Stand
Bore well water S-3 |
RJIT
Bore well water S-4 |
TCP
Bore well water S-5 |
| 1. | pH Value | 6.5-8.5 | 3025
(Part-11) |
6.97 | 7.25 | 7.04 | 7.17 | 6.97 |
| 2. | Colour | 5.0 Max | 3025
(Part-4) |
>1 | >1 | >1 | >1 | >1 |
| 3. | Turbidity
(NTU) |
5.0 Max | 3025
(Part-10) |
>1 | 1.3 | 1.1 | 1.2 | 1.1 |
| 4. | TDS (mg/l) | 500 Max | 3025
(Part-16) |
127 | 479 | 1138 | 591 | 1036 |
| 5. | Nitrate(mg/l) | 45 | 3025
(Part-34) |
4.2 | 10.64 | 24.18 | 12.20 | 16.42 |
| 6. | Sulphate
(mg/l) |
200 | 3025
(Part-24) |
8.40 | 14.86 | 42.40 |
18.84 |
28.41 |
| 7. | Chloride
(mg/l) |
250 | 3025
(Part-32) |
14.97 | 72.99 | 182.56 | 79.60 | 177.8 |
| 8. | Dissolved Oxygen
(mg/l) |
5.0 AS per WHO) | APHA | 4.4 | 2.1 | 4.80 | 3.5 | 3.8 |
| 9. | COD(mg/l) | – | APHA | 19.5 | 20.4 | 19 | 21.1 | 19.6 |
| 10. | BOD(mg/l) | – | APHA | 2.2 | 2.6 | 2.4 | 2.2 | 2.5 |
| 11. | Total Hardness
(mg/l) |
300 Max | 3025
(Part-21) |
96.0 | 230 | 552 | 362 | 464 |
| 12. | Alkalinity
(mg/l) |
200Max | 3025
(Part-23) |
18.20 | 78.0 | 142 | 94 | 122 |
| 13. | Total Coliform Bacteria (Per 100 ml) | 10 | IS1622-1998 | 09 | 02 | 06 | 02 | 03 |
Temperature
The temperature was in the range of 18.10c to 20.20c in post monsoon and 26.50c to 28.40c in pre-monsoon season. The variation in the water temperature may be due to different timings of collection and influence of season7.
pH was found to be alkaline in nature in most of samples range between 6.97 to 7.25 in post monsoon and 7.16 to 8.26 in pre-monsoon. On an average, pH of all samples was in desirable limits as prescribed for drinking water standard (6.5-8.5).
Total Alkalinity
Alkalinity was found in the range of 350 mg/l to 520 mg/l in pre-monsoon and 18.20 mg/l to 142 mg/l in post- monsoon. The alkalinity is much higher in the dry season and lower in the rainy season. This could be due to low water levels with its attendant concentration of salts and the lower value in the rainy season could be due to dilution8. It indicates that alkalinity of water increase with decreasing water level9.
The anionic concentrations in terms of nitrate, sulphate and chloride are within the acceptable limits prescribed by WHO in around the year. However, the presence of Nitrate indicates the pollution in ground water due to sewage percolation beneath the surface.
Dissolved Oxygen of water samples ranges from 2.1 to 4.80 mg/l and 2.0 to 2.80 mg/l in post- monsoon and pre-monsoon respectively. DO was significantly lower during dry season as compared to rainy season. It is could be due to increased aeration due to rainfall10.
The Biological Oxygen Demand (BOD) ranges from 2.2 to 2.6 mg/l and 6.2 to 9.4 mg/l in post- monsoon and pre-monsoon respectively.
The Chemical Oxygen Demand (COD) ranged from 19 to 21.1 mg/l and 24.90 to 29.80 mg/l in post-monsoon and pre-monsoon respectively. The test is commonly used to indirectly measure the amount of organic compounds in water. Since no prescribed standards are suggested by ISI:10500, 1991 for parameters like BOD, COD for drinking water purpose, hence no comparison can be made from observed values.
Hardness
The higher values of hardness in some sampling points in post monsoon season may be due to dissolution of polyvalent metallic ions from sedimentary rocks, seepage from effluent bearing water bodies and run off from soil during rainy season11.
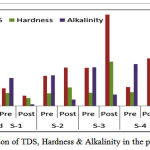 |
Figure 1: Comparison of TDS, Hardness & Alkalinity in the pre and post mansoon. |
Total dissolved solids are a measure of total inorganic substances dissolved in water. Total dissolved solids indicate the salinity behavior of ground water. Water containing more than 500 mg/l TDS is not considered desirable for drinking water supplies, but in unavoidable cases 1500 mg/l is also allowed12. TDS values of present samples varied from 127 to 1138 mg/l and 220 mg/l to 472 mg/l in post-monsoon and pre-monsoon respectively. The high value of Total dissolved solids were recorded in post monsoon season. This may be due to leaching of solid wastes and raw effluent into the ground water. A high value of TDS reduces water quality for drinking, irrigation and agriculture purposes.
In present study, Total coliform bacteria found in lake as well as in ground water. It could means that surface water may be getting in to ground and lake water during rainfall. This increases the risk of animal waste contaminating water sooner or later. Total coliforms are a group of bacteria commonly found in the environment e.g. in soil or vegetation as well as the intestines of mammals including humans. Total coliform bacteria are not likely to cause illness, but their presence indicates that water supply may be vulnerable to contamination by more harmful micro-organisms (The Canadian drinking water quality guideline for total coliform is none detectable per 100 ml). The health effects of exposure to disease causing bacteria, viruses and parasites in drinking water are varied. The most common symptoms of waterborne illness include nausea, vomiting and diarrhea13.
Conclusion
The present work is an attempt to assess the drinking water quality of Tekanpur area in pre-monsoon and post-monsoon season. In the current study, the water samples showed deviations from water quality standards indicating groundwater contamination in post monsoon season. As a result of high concentration of TDS, water loses its potability and reduces the solubility of oxygen in water. Total hardness of maximum study points is beyond the permissible limits and contaminated with total coliform bacteria, because of this, people of that area are prone for the immediate health problems such as stomach diseases, gastric troubles etc. Our study show that contamination of ground water which has the largest share of water supplied for human use has deteriorated due to leaching of solid waste into ground water and surface run off during rainy season to such an extent that the crucial parameters such as TDS, hardness, etc usually exceed the desirable levels substantially14.
Recommendations
Alkalinity can be removed by reverse osmosis process (RO System) along with other total dissolved solids for domestic purpose. Other removal methods like distillation & deionization are also available for the removal of alkalinity and TDS at community level.
Rainwater harvesting is a useful permanent solution where other sources of water have unacceptably high levels of TDS or hardness. TDS of rainwater is a few tens of mg/L.
Chlorine treatment is required in the disinfect wells, tube wells.
To remove microorganisms boiling of water is must.
Acknowledgement
We are indebted to our Director Shri Kunal Majumdar for his encouragement & suggestions. We are also thankful to Mr. Amit Kumar Dubey, Director, Green Environment for providing us laboratory facilities.
References
- http://en.wikipedia.org/wiki/Tekanpur.India
- Borul S.B. and Banmeru P.K., “Physiochemical analysis of ground water for drinking from selected sample points around the Manmeru Science College, Lonar Buldana district of Maharashtra”, Journal of Chemical and Pharmaceutical Research, 4(5): 2603-2606 (2012).
- BIS: Indian standard specification for drinking water; B.S. 10500 (1991).
- Guidelines for drinking water quality-WHO, Geneva, 2nd Ed., 97-100 (1999).
- Saravanakumar K. and Ranjith Kumar R., “Analysis of Water Quality parameters of Groundwater near Ambattur Industrial Area, Tamil Nadu, India”, Indian Journal of Science & Technology, 4(5) (2011).
- Kori R., Saxena A. and Upadhyay N., “Groundwater quality Assessment of Mandideep Industrial area”, National Seminar on Environment & Development, Bhopal. (2006)
- Jayaraman P.R., Ganga Devi T. and Vasuena Naya T., “Water Quality Studies on Kasmane River, Thiruvananthpuram District, Soth Kerela, India”, Poll. Res., 32(1), 89-100 (2003).
- Ufodike E.B.C.and Kwanasie A.S., “On-Set of Rain and its destabilizing effect on aquatic physiochemical parameters”, Journal of aquatic sciences 16(2), 91-94, (2003).
- Holden J.M. and Green J., “The hydrology and plankton of the river sokoto”, J. Ani.Ecol., 29:65-84, (1960).
- Adeyemo O.K. and Adedokun O.A., “Seasonal changes in physiochemical parameters and nutrient load of river sediments in Ibadan city, Nigeria”, Global NEST Journal, vol.10, No. 3, pp. 326-336, (2008).
- Gupta D.P., Sunita and Saharan J.P., “Physiochemical Analysis of ground water of selected area of Kaithal city (Haryana) India”, Researcher, Vol-1, issue-2, 1-5 (2009).
- \Ball R., “Fertilization of Lake- Good or Bad”, Michigen, Conserv, 7-14 (1994).
- indiawaterportal.org Vaidya Krishna and Gadhia Mohini, “Evaluation of Drinking Water Quality”, African Jouranal of Pure & Applied Chemistry, 6(1), 6-9 (2012).

