Explainable Deep Learning Framework for Early Cancer Detection from Histopathological Images Using LIME and SHAP
 , Vimala Mannarsamy1*, Nishanthini Gopalakrishnan1 and Shanmugam Manikandan2
 1Department of Electronics and Communication, P.S.R. Engineering College, Sivakasi, Tamilnadu, India
2Department of Biomedical Engineering, Mepco Schlenk Engineering College, Sivakasi, Tamilnadu, India,
Corresponding Author E-mail: vimala@psr.edu.in
DOI : http://dx.doi.org/10.13005/bpj/3498
Download this article as:

Early and accurate classification of malignant and non-malignant tissues is essential for improving diagnostic accuracy and patient outcomes. With the rapid advancement of artificial intelligence, machine learning , deep learning methods have demonstrated significant potential in automating histopathological image analysis and assisting clinical diagnosis. This paper proposes an explainable deep learning framework for early cancer detection using histopathological images. A total of six deep learning architectures, which are Convolutional Neural Network CNN, VGG16, ResNet50, MobileNetV2, EfficientNetB0, and InceptionV3 were tested with LC25000. It has 25,000 histopathological images which are classified into five groups such as lung squamous cell carcinoma, lung adenocarcinoma, lung benign tissue, and colon adenocarcinoma. The data was separated into 15% test, 15% validation and 70 % training of the models considered, ResNet50 had the best classification accuracy of 99% with excellent ability to generalize to all tissue classes. CNN and VGG16 also achieved high accuracy of 98%., whereas EfficientNetB0 was 97%. Conversely, MobileNetV2 (86% accuracy) and InceptionV3 (69% accuracy) demonstrated relatively worse performance especially when it comes to differentiating lung cancer subtypes. Explainable artificial intelligence methods such as Grad CAM, LIME, and SHAP were implemented to the most successful model to increase the level of transparency in the model. These visual explanations identified clinically significant tissue locations that influenced model predictions, hence improving the diagnostic system's interpretability and reliability. The findings establish that high performance deep learning architectures can be used in conjunction with explainable artificial intelligence techniques to offer a strong and reliable system of computer aided diagnosis of cancer.
KEYWORDS:Cancer classification; Explainable artificial intelligence; Histopathology images; LC25000 dataset; LIME; ResNet50; SHAP
Introduction
Cancer is one of the major health challenges facing the world in the twenty-first century. It is described as the unregulated proliferation and dissemination of aberrant cells that can invade the adjacent tissues and spread to other body organs. In spite of significant progress in medical research and therapy, cancer remains a consistent cause of morbidity and mortality on a global level. The World Health Organization (WHO, 2023) reports that more than 20 million cancer cases are recorded in the world annually and only about 9.7 million cancer-related deaths were observed in 2022 and hence it ranks second to cardiovascular disorders as the cause of death. It is estimated that one out of every five people will fall under the cancer category in the world and one out of every nine men and twelve women will succumb to cancer related complications. The rising cancer rates can be attributed to several factors such as the increasing population, old age, exposure to the environment, changes in the lifestyle, and genetics. In most of the low and middle income states, there is a poor medical infrastructure, few screening programs, late diagnosis which is a further cause of death. Consequently, the timely and precise cancer diagnosis is highly critical to enhance treatment results and raise the survival rates of patients. According to clinical studies, early detection promotes high chances of survival. For instance, the five-year survival rate for lung cancer in its early stages is approximately 56%, whereas it drops to less than 5% in its advanced stages. Likewise, there is a high survival rate of 90 percent in instance of early diagnosis of colorectal cancer and less than 15 percent in case of late diagnosis. These statistics underscore the real essence of the need to have sure diagnostic systems to detect cancer early. Cancer has several categories including carcinomas, sarcomas, leukemias, lymphomas, and melanomas that are distinct according to their origin of tissues and cells. Of these, the most common type is carcinomas of epithelial cell, and this type of cancer is responsible to a significant percentage of deaths associated with cancer.
Cancer diagnosis is most reliably performed using histopathological examination., which allows one to identify the type and grade of the tumor by analyzing tissue samples under a microscope. Due to the high rate of artificial intelligence development, deep learning has become a powerful method of analysis of histopathological images in an automated format. Convolutional neural networks can extract hierarchical features out of complex tissue structures to allow them to classify cancerous tissues and non cancerous tissues correctly. Alternative CNN based networks including VGG, ResNet, EfficientNet, MobileNet, and Inception have shown superior performance in medical image classification. But deep learning models tend to be black box systems, and clinicians can hardly make inferences about the mechanism of prediction generation. Such a lack of transparency prevents the application of deep learning models in clinical settings where interpretability and trust are critical. To overcome this shortcoming, clarifying artificial intelligence methods give interpretable knowledge about model predictions by showing image regions and features that cause model decisions. An explainable deep learning system for classifying cancer from histopathology images is presented in this paper. The LC25000 histopathology dataset is used to assess a number of deep learning models, including as CNN, VGG16, ResNet50, MobileNetV2, EfficientNetB0, and InceptionV3. In addition to evaluating classification performance, explainable AI techniques like Grad CAM, LIME, and SHAP are used to provide model predictions a visual justification. The suggested method enhances automated cancer detection systems’ precision and comprehensibility.
Literature Survey
Deep Learning for Cancer Detection
Images from lung and colon histology were classified into five tissue groups using a CNN-based framework. CNN’s capacity to extract hierarchical features makes it possible to identify tiny tissue patterns that are frequently missed by traditional methods. With an accuracy of 96.33%, the suggested model outperformed earlier research on colorectal polyps and lung nodules. This outcome emphasizes how crucial high-quality datasets are for developing trustworthy deep learning models. The study also demonstrated CNNs’ efficacy in differentiating intricate histological markers, marking a major breakthrough in automated cancer diagnosis.1 Histopathology images from the LC25000 dataset using a fusion deep learning model that combines ResNet-101V2, NASNetMobile, and EfficientNet-B0 to enhance early multi-classification of lung and colon malignancies. The model achieves exceptional diagnostic performance of 99.94% accuracy, 99.8% precision and recall, and 99.96% specificity by concatenating features from multiple pre-trained networks. By utilizing the complementary qualities of numerous designs, this fusion technique provides efficient tumor presentation recognition while retaining efficiency appropriate for actual clinical deployment.2 Using histopathology pictures, a CNN with global context attention is used to classify lung and colon cancer. Both local cellular information and global tissue context were intended to be captured by the spatial and channel-wise attention approaches. Precise detection of fine-grained histological patterns was made possible by this attention-based architecture, which significantly improved feature representation.3 Metaheuristic-driven two-stage ensemble deep learning architecture that uses various CNN backbones, including VGG16, ResNet18, DenseNet121, and EfficientNetB4, for deep feature extraction in order to classify lung and colon cancer from histopathology images. The Electric Eel Foraging Optimization (EEFO) algorithm was used to find the most discriminative features, and weighted ensemble learning improved resilience and classification accuracy. The method obtained 99.85% accuracy for binary colon cancer, 98.70% for three-class lung cancer, and 98.96% for five-class datasets, highlighting the power of integrating ensemble learning with biologically inspired optimization.4 An enhanced CNN for lung cancer classification from CT images that employs scaling, rotation, and contrast-based data augmentation. The model obtained 95% accuracy on the LIDC-IDRI dataset, outperforming previous techniques, particularly for tiny medical imaging datasets.5 EfficientNetB1 model on the LC25000 histopathology dataset by combining transfer learning and image pre-processing with scaling and augmentation. The framework identifies images as squamous cell carcinoma, adenocarcinoma, or benign, with a diagnosis accuracy of 99.8% for automated lung cancer identification.6
An innovative lung cancer recognition framework that combined Attention U-Net-based segmentation along with deep learning classification, resulting in better tumor localization and classification accuracy, thereby improving the reliability of automated lung cancer diagnostic systems.7 Multiclass brain tumor classification from MR images to better capture small lesion patterns missed by conventional CNNs. By integrating a global transformer module with multi-head generalized self-attention across spatial and channel dimensions, the model outperforms state-of-the-art methods on benchmark datasets.8 Using histopathology images from the BreakHis 400× dataset, CNN-based, VGG16 transfer learning, and knowledge-based feature extraction techniques are used to diagnose breast cancer. Dense multimodal architectures (D1 and D2) for classifying colon and lung tumors using histopathological and CT images , further validating the advantages of multimodal learning in cancer diagnosis.9 An enhanced multimodal fusion deep neural network that integrated radiological, genomic, and clinical data for lung cancer detection, where multimodal feature fusion enabled the capture of complementary information and significantly improved diagnostic robustness and accuracy.10
Explainable AI in Medical Imaging
Explainable Artificial Intelligence (XAI) has emerged as a key component in medical image analysis, particularly in cancer detection, where automated decision-making systems must be transparent and trustworthy. Early research focused on combining deep learning models with explainability strategies to improve interpretability while retaining high classification accuracy.11 Comprehensive review and underlined the growing importance of explainable deep learning algorithms in cancer detection utilizing medical imaging. The study noted that standard black-box deep learning models lack interpretability, limiting their use in clinical settings.12 Similarly an explanation-driven deep learning framework for predicting brain tumor status using MRI images, illustrating how interpretable outputs can help physicians comprehend model decisions. Recent research has focused on explainability tools such as Local Interpretable Model-Agnostic Explanations (LIME) and SHapley Additive explanations (SHAP) for interpreting deep learning predictions.13, 32, 34, 35 These methods have also been successfully applied in medical diagnosis tasks such as breast cancer classification using machine learning models, where LIME and SHAP enhance transparency and clinical trust.33 Additionally, explainable computer vision approaches integrating techniques such as Activation Layer Visualization (ALV), LIME, SHAP, and Grad-CAM have been successfully applied for prostate cancer classification, improving transparency and diagnostic reliability.32 LIME and SHAP for retinoblastoma diagnosis and found that these approaches efficiently identify key image regions that influence classification outcomes.14 Furthermore, explainable multi-modal frameworks for breast cancer diagnosis, emphasizing the need of merging various imaging modalities and explainability methodologies to improve diagnostic accuracy. Several studies have also presented deep learning architectures tailored for explainability in cancer detection.15, 35 Deep learning for skin cancer diagnosis using LIME and SHAP, demonstrating that explainability increases classification outcome transparency.16 Similarly, a neural network-based breast cancer detection system that incorporates XAI approaches to provide visual explanations for prediction findings. Transfer learning mixed with explainability has also received attention.17 A transfer learning framework for lung and colon cancer diagnosis that makes use of local binary pattern features and XAI algorithms. Ensemble and mixed deep learning algorithms have increased diagnostic performance while remaining interpretable.18 An ensemble convolutional neural network model integrated with explainable AI for gastrointestinal cancer classification, which demonstrated higher accuracy and interpretability than single-model approaches.19 Improved histopathological medical image categorization by combining deep learning models with LIME and SHAP, offering insights into the factors that influence early cancer detection. 20 Similarly, explainable deep learning in histopathological lung cancer diagnosis, emphasizing the relevance of interpretable models in clinical settings.21
More recent studies have looked into advanced deep learning architectures and hybrid frameworks. An optimized pre-trained deep learning model with explainable AI to diagnose bone cancer using the osteosarcoma tumor assessment dataset.22 An explainable AI-driven deep neural network for breast cancer identification based on histological and ultrasound images, displaying enhanced diagnostic accuracy via multi-modal analysis.23 Deep learning models for brain tumor detection on MRI images are trained using SHAP-based analysis, which enables them to recognize significant factors influencing classification choices.24 Furthermore, hybrid deep learning architecture for diagnosing stomach cancer using histopathology images.25 Deep supervised learning algorithm for early breast cancer detection to improve diagnostic accuracy.26 Federated learning-based explainable AI system for brain tumor classification, which addresses privacy and data-sharing issues in medical imaging.27 An explainable-by-design deep learning framework for lesion diagnosis in breast tomosynthesis image, which employs prototype part learning.28 An explainable deep learning in increasing transparency and reliability in medical image interpretation.29 Recent works demonstrated the combination of transformer-based topologies,30 with interpretable AI approaches for effective cancer diagnosis.31
Recent studies have also explored advanced explainable frameworks that integrate deep learning architectures with post-hoc interpretability techniques such as SHAP, LIME, and Grad-CAM. These frameworks typically employ convolutional backbones or hybrid models (e.g., CNN-LSTM and EfficientNet-based architectures) for feature extraction, followed by explainability methods to generate both local and global interpretations. LIME provides localized explanations through superpixel-based perturbations, while SHAP quantifies feature-level contributions using Shapley values, and Grad-CAM highlights spatially significant regions through heatmaps. The combination of these techniques enables cross-validation of explanations, improving the robustness and reliability of model interpretations. Furthermore, recent studies validate explainability by comparing model-generated heatmaps with pathologist annotations and reporting high agreement scores, thereby enhancing clinical trust. However, challenges such as computational complexity, instability of local explanations, and lack of standardized evaluation protocols remain open research issues. 37–41 A SIFT-CNN Integrated Fuzzy Decision Tree framework combined trilateral filtering, ROI-based U-Net segmentation, and CNN feature extraction to classify mammogram images, achieving 99.20% accuracy for early breast cancer detection42.
Materials and Methods
In the proposed methodology, the explainable deep learning model of histopathological image classification to facilitate early lung and colon cancer detection is suggested. The proposed system combines deep convolutional neural network models with explainable artificial intelligence (XAI) to enhance the accuracy of classification and model interpretability. The general procedure of the suggested approach includes the preparation of the dataset, preprocessing, the deep learning-based classification, the performance analysis, and the explainability.
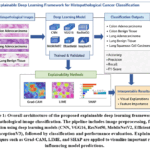 |
Figure 1: Overall architecture of the proposed explainable deep learning framework for histopathological image classification. Click here to View Figure |
Dataset Description
The LC25000 histopathology dataset is given in the table 1, which includes 25,000 microscopic images of five distinct tissue types such as colon adenocarcinoma, lung adenocarcinoma, lung benign tissue, and lung squamous cell carcinoma was employed in the trials. There are roughly 5,000 photos in each class. Deep learning models for multi-class cancer classification may be effectively trained and tested using the dataset’s balanced samples.
The images were scaled to 224 × 224 pixels to satisfy the input requirements of the chosen CNN architectures. Pixel intensity values were standardized to the range [0,1] to ensure training stability. Furthermore, data augmentation techniques like as rotation, horizontal flipping, zooming, and brightness correction were used to boost dataset diversity while reducing overfitting. These modifications allow the model to learn robust characteristics from histopathological tissue architecture. This paper presents a systematic evaluation of six deep learning architectures for the multi-class histopathological image classification task. A thorough examination of the performance of classical CNN structures, very deep residual networks, and computationally efficient designs on medical imaging tasks was made possible by the models’ varied design philosophies. The investigation ensures that the suggested solution is accurate and flexible enough to be used in various clinical and computational contexts by incorporating both lightweight and heavy architectures.
Table 1: Dataset Description
|
Parameter |
Value |
| Dataset Name |
LC25000 |
|
Total Images |
25,000 |
| Number of Classes |
5 |
|
Image Type |
Histopathology |
| Image Size |
224×224 |
|
Classes |
Lung Adenocarcinoma, Lung Squamous, Colon Adenocarcinoma, Benign, etc. |
| Preprocessing |
Normalization, resizing, augmentation |
Proposed Explainable Deep Learning with LIME and SHAP Algorithm
The architectural layout of the deep learning models utilized in this study to classify histopathology images is depicted in Figure 2. Convolutional layers, pooling layers, a flatten layer, and fully linked layers with a Softmax classifier make up the baseline CNN. For hierarchical feature extraction, VGG16 uses a deeper architecture with stacked 3×3 convolutional layers and max pooling operations. By reducing the vanishing gradient issue, ResNet50 creates residual connections that enable deeper networks to be trained effectively. MobileNetV2 reduces computational complexity without sacrificing accuracy by using inverted residual blocks and depthwise separable convolutions. To increase performance, EfficientNetB0 uses a compound scaling technique that strikes a balance between network depth, width, and resolution. InceptionV3 utilizes parallel convolutional filters of different sizes within Inception modules to capture multi-scale features from histopathological images.
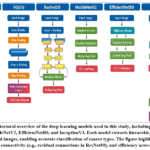 |
Figure 2: Architectural overview of the deep learning models used in this study, including CNN, VGG16, ResNet50, MobileNetV2, EfficientNetB0, and InceptionV3. Click here to View Figure |
In order to create a basic performance benchmark, the baseline CNN architecture was used. This network was trained from scratch, directly learning the feature representations from histopathological images, in contrast to transfer learning techniques. The CNN architecture was made up of several convolutional blocks that were intended to extract hierarchical patterns, ranging from high-level structural and morphological features to low-level edges and textures. Equation (1) mathematically expresses a convolution operation for the kth filter at spatial location (i, j).

where b is the bias term, w is the convolutional kernel, and x is the input feature map. Equation (2) uses a ReLU activation function to add non-linearity.

Overfitting is handled and spatial dimensions are further reduced by pooling layers. Equation (3) defines a typical max pooling operation.

The softmax function described in (4) is used to obtain the final class probabilities.

3×3 convolutional kernels are used continuously across the network in the VGG16, a traditional deep CNN architecture. There are thirteen convolutional layers and three fully linked layers, for a total of sixteen weight layers. ReLU activation and max pooling, which gradually decrease the spatial resolution while expanding the receptive field, come after each convolutional layer. Effective feature learning is made possible by the stacked small convolutional filters, which offer deeper non-linear mappings with fewer parameters than large kernels. ImageNet pre-trained weights, which are adjusted to histopathological images for domain-specific feature extraction, are utilized in transfer learning with VGG16. A 50-layer deep residual network called ResNet50 was established to solve the vanishing gradient issue that sometimes arises in very deep architectures. Residual learning, which adds skip connections that avoid one or more layers, is its main innovation. Equation (5) defines the residual mapping.

where x is the identity shortcut connection and F(x, W) is the transformation function (such as convolution–batch normalization–ReLU). This guarantees that the identity mapping x can propagate across the network even if F(x, W) approaches 0, enabling efficient training of very deep layers. An effective model designed for mobile and edge devices is MobileNetV2. Two significant advances are presented such as depthwise separable convolutions and inverted residuals. The convolution factorizes the operation into a depthwise convolution followed by a pointwise convolution, in contrast to ordinary convolution, which applies filters across all channels simultaneously. (6) expresses the depthwise separable convolution operation utilized in MobileNetV2.

where *pw stands for a 1×1 pointwise convolution to mix features across channels, and *dw indicates depthwise convolution applied channel-wise. Equation (7) illustrates how depthwise separable convolution has a substantially lower computing cost than ordinary convolution.

where M and N are the input and output channels, and Dk is the kernel size.
A compound scaling technique that simultaneously scales network depth, width, and input resolution is presented by EfficientNetB0. EfficientNet uses a set of predefined coefficients to scale all dimensions uniformly, in contrast to traditional methods that scale one dimension at a time. Equations (8) and (9) provide a formal representation of scaling.

subject to the constraint:

where φ is the compound coefficient and d, ω, and r stand for depth, width, and resolution, respectively. The proportionate scaling of the network depth, width, and resolution is determined by the constants 𝛼, 𝛽, and 𝛾. While maintaining computational efficiency, this balanced scaling increases accuracy.
InceptionV3 is to extract multiscale features using Inception modules. For pooling operations and parallel convolutions with different kernel sizes, like 1 × 1, 3 × 3, and 5 x 5, each module utilizes the same input feature map. The outcomes of these concurrent processes are concatenated to produce the final feature representation. This process can be expressed using equation (10).

where x is the input feature map, fpool(x) is the pooling operation, and f1x1(x), f3x3(x), and f5x5(x) are convolution procedures with various kernel sizes. The resultant feature maps are combined along the channel dimension using the function Concat(·). The model can simultaneously capture coarse global structures and fine-grained local features thanks to its architecture. Factorization approaches, such as substituting two 3×3 convolutions for a 5×5 convolution, significantly reduce computational complexity without sacrificing representational capacity. As deep learning models’ decision-making process is transparent, they are frequently referred to as “black boxes.” Three explainability techniques—Grad-CAM, LIME, and SHAP—were used in this study to get around this restriction and improve clinical trust. These methods highlighted the most pertinent histopathological areas that affected model predictions and offered both local and global interpretability.
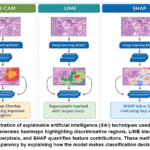 |
Figure 3. Illustration of explainable artificial intelligence (XAI) techniques used in this study. Grad-CAM generates heatmaps highlighting discriminative regions, LIME identifies locally important superpixels, and SHAP quantifies feature contributions. |
The explainable AI methods utilized to analyze the deep learning model’s predictions are displayed in Figure 3. Grad-CAM produces heatmaps that emphasize the key areas of histopathology images that affect the model’s judgment. By dividing the image into superpixels and determining which areas contribute most to the classification, LIME offers local explanations. Based on Shapley theory, SHAP determines feature importance values that show how each region contributes to the final forecast. By enabling the visibility of the regions in charge of cancer classification, these explainability techniques enhance the transparency and dependability of deep learning models in medical image analysis.
The discriminative areas of input images that made the biggest contributions to a classification were visualized using Gradient-weighted Class Activation Mapping (Grad-CAM). The significance of a feature map A^ K for a particular class c is computed using the class score y^c gradients equation (11).

where Z is the normalizing factor and α_k^c is the weight for feature map k. Equation (12) yields the final Grad-CAM heatmap.

This method confirmed that the model concentrated on significant histological traits by constantly highlighting clinically significant areas such aberrant glandular structures and atypical nuclei.
The decision boundary of the deep model in the immediate neighborhood of an instance was estimated using immediate Interpretable Model-Agnostic Explanations (LIME). In order to replicate the behavior of the complex classifier f(x), which is expressed in equation (13), LIME builds a simpler surrogate model g(z).

where L(f,g,) measures the fidelity of g to f around input x, defines locality weights, and Ω(g) penalizes model complexity. By perturbing superpixels of histopathology images, LIME identified regions most influential to the classification. The results showed that the model’s predictions were largely based on tumor-associated tissue areas rather than background regions, reinforcing clinical interpretability.
Cooperative game theory was used to quantify each feature’s contribution using Shapley Additive Explanations (SHAP). Equation (14) defines the Shapley value for a feature i.

where f(S) is the model prediction using only features in S, S is a subset that excludes i, and F is the entire collection of features. According to SHAP visualizations, benign tissues made little or no contribution to cancer predictions, whereas areas with irregular nuclei and high cellular density did.
Results
Each of the six deep learning models was trained and assessed using a consistent experimental methodology. The training was conducted on a high-performance computing system equipped with two NVIDIA Tesla T4 GPUs (GPU T4 × 2), which enabled faster parallelized training and efficient handling of the large histopathological dataset. The Adam optimizer was trained with a learning rate of 1×10⁻⁴ in mini-batches of 32 images. The categorical cross-entropy loss function, which is defined as

where yi,k represents the ground truth label, i,k denotes the predicted probability for class k, N is the number of training samples, and K is the total number of classes. To avoid overfitting, an early stopping criterion was used during training for up to 50–100 epochs. 70% of the dataset was used for training, 15% was used for validation, and 15% was used for testing. Following each epoch, validation accuracy and loss were tracked, and checkpointing based on validation accuracy was used to save the top-performing models.
Performance Metrics
Model performance was measured using accuracy, precision, recall, and F1-score. Accuracy was computed in equation (16).

while precision and recall were defined in equation (17) and (18).
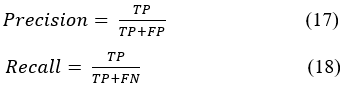
To balance these measures, the F1-score was used, expressed in equation in (19).

Six deep learning architectures were evaluated for classification performance over five histopathological classes: CNN, VGG16, ResNet50, MobileNetV2, EfficientNetB0, and InceptionV3. Table 2 presents the precision, recall, F1 score, and accuracy achieved by each model.
Table 2: Performance Comparison of Deep Learning Models on Histopathological Dataset
|
Model |
Class | Precision | Recall |
F1-Score |
|
CNN |
Colon Adenocarcinoma | 0.99 | 0.99 | 0.99 |
| Colon Benign Tissue | 0.99 | 0.99 |
0.99 |
|
|
Lung Adenocarcinoma |
0.97 | 0.95 | 0.96 | |
| Lung Benign Tissue | 0.99 | 1.00 |
1.00 |
|
|
Lung Squamous Cell Carcinoma |
0.95 | 0.97 | 0.96 | |
| Accuracy |
0.98 |
|||
|
VGG16 |
Colon Adenocarcinoma |
0.99 | 0.99 | 0.99 |
| Colon Benign Tissue | 1.00 | 0.99 |
0.99 |
|
|
Lung Adenocarcinoma |
0.97 | 0.96 | 0.96 | |
| Lung Benign Tissue | 1.00 | 1.00 |
1.00 |
|
|
Lung Squamous Cell Carcinoma |
0.96 | 0.98 | 0.97 | |
| Accuracy |
0.98 |
|||
|
ResNet50 |
Colon Adenocarcinoma | 0.99 | 1.00 | 1.00 |
| Colon Benign Tissue | 1.00 | 0.99 |
1.00 |
|
|
Lung Adenocarcinoma |
0.99 | 0.99 | 0.99 | |
| Lung Benign Tissue | 1.00 | 1.00 |
1.00 |
|
|
Lung Squamous Cell Carcinoma |
0.99 | 0.99 | 0.99 | |
| Accuracy |
0.99 |
|||
|
MobileNetV2 |
Colon Adenocarcinoma |
0.85 | 0.77 | 0.81 |
| Colon Benign Tissue | 0.83 | 0.89 |
0.86 |
|
|
Lung Adenocarcinoma |
0.83 | 0.79 | 0.81 | |
| Lung Benign Tissue | 0.96 | 0.96 |
0.96 |
|
|
Lung Squamous Cell Carcinoma |
0.83 | 0.89 | 0.86 | |
| Accuracy |
0.86 |
|||
|
EfficientNetB0 |
Colon Adenocarcinoma |
0.97 | 0.99 | 0.98 |
| Colon Benign Tissue | 1.00 | 0.98 |
0.99 |
|
|
Lung Adenocarcinoma |
0.94 | 0.92 | 0.93 | |
| Lung Benign Tissue | 0.99 | 1.00 |
0.99 |
|
|
Lung Squamous Cell Carcinoma |
0.94 | 0.95 | 0.94 | |
| Accuracy |
0.97 |
|||
|
InceptionV3 |
Colon Adenocarcinoma |
0.64 | 0.79 | 0.70 |
| Colon Benign Tissue | 0.77 | 0.55 |
0.64 |
|
|
Lung Adenocarcinoma |
0.72 | 0.43 | 0.54 | |
| Lung Benign Tissue | 0.69 | 0.80 |
0.74 |
|
|
Lung Squamous Cell Carcinoma |
0.69 | 0.89 | 0.78 | |
| Accuracy |
0.69 |
ResNet50 demonstrated near-perfect classification across all tissue types, with the greatest overall accuracy of 0.99 among all examined models. With an accuracy of 0.98 each, CNN and VGG16 also demonstrated excellent performance, demonstrating their resilience in the interpretation of histopathology images. With an accuracy of 0.97, EfficientNetB0 demonstrated competitive performance, demonstrating a successful balance between computational efficiency and predictive accuracy. MobileNetV2, on the other hand, performed relatively poorly, with an accuracy of 0.86, suggesting a diminished capacity to distinguish between the classifications of squamous carcinoma and adenocarcinoma. With an accuracy of 0.69, InceptionV3 had the worst performance. This model showed limits in capturing complicated histological patterns, as evidenced by its recall of 0.43 for lung adenocarcinoma and 0.55 for colon benign tissue.
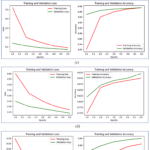 |
Figure 4: Training and validation loss curves for the six deep learning models: (a) CNN, (b) ResNet50, (c) VGG16, (d) MobileNetV2, (e) EfficientNetB0, and (f) InceptionV3. Click here to View Figure |
CNN, VGG16, ResNet50, MobileNetV2, EfficientNetB0, and InceptionV3 are the six models whose training and validation loss curves are shown in Figure 4. This demonstrates the convergence and generalization behavior of the models during training. Effective learning without considerable overfitting was demonstrated by CNN and VGG16, which showed smooth and consistent convergence with a small gap between training and validation loss. With quick loss reduction and almost overlapping training and validation curves, ResNet50 showed the most stable convergence, which is consistent with its higher classification accuracy. Additionally, EfficientNetB0 demonstrated significant convergence behavior, demonstrating its balance between accuracy and efficiency while preserving a slight difference between training and validation losses. MobileNetV2, on the other hand, showed variations in validation loss, indicating worse generalization to new data. InceptionV3’s comparatively worse classification accuracy is consistent with overfitting, as evidenced by the biggest difference between training and validation losses.
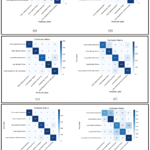 |
Figure 5: Confusion matrices for the five-class histopathology dataset using (a) CNN, (b) ResNet50, (c) VGG16, (d) MobileNetV2, (e) EfficientNetB0, and (f) InceptionV3. Click here to View Figure |
Table 3: Comparison of Deep Learning Models with Machine Learning Models
|
Model |
Accuracy | Precision | Recall | F1-Score | Remarks |
| SVM | 97% | 0.97 | 0.96 | 0.96 |
Good performance, limited feature extraction |
|
Random Forest |
97% | 0.96 | 0.97 | 0.96 | Robust but less effective for complex patterns |
| Logistic Regression | 97% | 0.95 | 0.96 | 0.95 |
Simpler model, lower generalization |
|
CNN |
98% | 0.98 | 0.98 | 0.98 | Strong baseline performance |
| VGG16 | 98% | 0.98 | 0.98 | 0.98 |
Deep architecture with stable results |
|
EfficientNetB0 |
97% | 0.97 | 0.96 | 0.96 | Balanced efficiency and performance |
| MobileNetV2 | 86% | 0.85 | 0.83 | 0.84 |
Lightweight but less accurate |
|
InceptionV3 |
69% | 0.70 | 0.64 | 0.67 | Poor performance on this dataset |
| ResNet50 | 99% | 0.99 | 0.99 | 0.99 |
Best performance, high stability |
Table 3. Comparison of machine learning and deep learning models for cancer classification. The results indicate that deep learning models outperform traditional machine learning approaches due to their ability to automatically extract complex features from histopathological images. Among all models, ResNet50 achieves the highest performance and stability.
Figure 5 displays the confusion matrices for CNN, VGG16, ResNet50, MobileNetV2, EfficientNetB0, and InceptionV3. ResNet50’s 0.99 accuracy was confirmed by the near-perfect classification it provided in all five classes, with very few misclassifications. When it came to differentiating between lung adenocarcinoma and squamous cell carcinoma, CNN and VGG16 both performed comparably well, with comparatively small mistakes. With only a few incorrect classifications in cancer subtypes, EfficientNetB0 demonstrated robust categorization for both lung and colon benign tissues. MobileNetV2’s lower overall accuracy of 0.86 is consistent with its notable discrepancy between lung adenocarcinoma and colon cancer. InceptionV3 had the highest rate of misclassification, notably in lung cancer and colon benign tissue, validating the limits identified in its performance metrics.
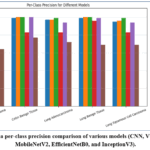 |
Figure 6: shows a per-class precision comparison of various models (CNN, VGG16, ResNet50, MobileNetV2, EfficientNetB0, and InceptionV3). Click here to View Figure |
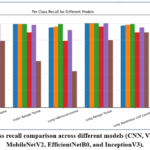 |
Figure 7: Per-class recall comparison across different models (CNN, VGG16, ResNet50, MobileNetV2, EfficientNetB0, and InceptionV3). Click here to View Figure |
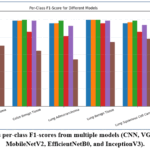 |
Figure 8: shows per-class F1-scores from multiple models (CNN, VGG16, ResNet50, MobileNetV2, EfficientNetB0, and InceptionV3). Click here to View Figure |
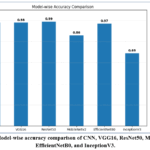 |
Figure 9: Model-wise accuracy comparison of CNN, VGG16, ResNet50, MobileNetV2, EfficientNetB0, and InceptionV3.. Click here to View table |
A thorough comparison of model performance across all six architectures in terms of precision, recall, F1-score, and overall accuracy is presented in Figures 6-9. With nearly flawless precision, recall, and F1-scores across all five classes, ResNet50 continuously beat the other models, yielding the highest overall accuracy of 0.99. Using balanced per-class criteria, CNN and VGG16 both produced strong and reliable results, with an accuracy of 0.98. With an accuracy of 0.97, EfficientNetB0 showed competitive behavior. It performed quite well in the categorization of benign tissue, but it had somewhat poorer precision and recall in the carcinoma classifications. With an accuracy of 0.86, MobileNetV2 yielded moderate results; nevertheless, its precision and recall values varied greatly between classes, suggesting reduced robustness. InceptionV3 had the poorest performance, with an overall accuracy of 0.69 and low per-class scores, particularly for colon benign tissue and lung adenocarcinoma, indicating a tendency for misclassification. Overall, the findings clearly show that ResNet50 is the most dependable architecture for histopathological classification, with CNN, VGG16, and EfficientNetB0 as feasible alternatives, although MobileNetV2 and InceptionV3 require additional optimization to attain consistent performance.
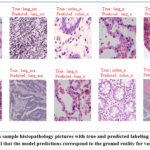 |
Figure 10: shows sample histopathology pictures with true and predicted labeling using ResNet-50. The results reveal that the model predictions correspond to the ground reality for various tissue types. |
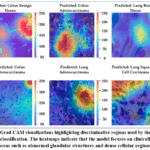 |
Figure 11: Grad-CAM visualizations highlighting discriminative regions used by the ResNet50 model for classification. Click here to View Figure |
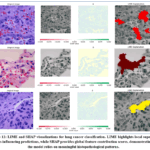 |
Figure 12: LIME and SHAP visualizations for lung cancer classification. LIME highlights local superpixel regions influencing predictions, while SHAP provides global feature contribution scores, demonstrating that the model relies on meaningful histopathological patterns. |
Figures 10-12 show the prediction results and explainability visualizations from the best-performing ResNet50 model. Figure 8 shows representative histopathology photos with their true and predicted labels, indicating that the model appropriately identifies various tissue types. Figure 11 depicts Grad-CAM heatmaps that emphasize the discriminative regions employed by the model for classification, suggesting that the network concentrates on clinically significant tissue structures such as aberrant glands and dense cellular areas. Figure 12 shows LIME and SHAP visualizations, with LIME identifying locally critical image regions that influence prediction and SHAP quantifying the contribution of various characteristics to classification outcome. These explainability results demonstrate that the model makes predictions based on relevant histopathological traits, which improves transparency and reliability in computer-aided cancer diagnosis.
In addition to the performance results, statistical analysis was conducted to evaluate the reliability of the models. The confusion matrix analysis shows that ResNet50 achieved the highest correct classification with minimal misclassification across all tissue classes, whereas MobileNetV2 and InceptionV3 exhibited higher misclassification rates. Furthermore, the consistency of performance metrics such as precision, recall, and F1-score indicates that ResNet50 maintains stable performance with low variability, while other models show fluctuations across classes. This statistical behavior aligns with the deep learning results, where ResNet50 achieved the highest accuracy of 99%, compared to CNN and VGG16 (98%), EfficientNetB0 (97%), MobileNetV2 (86%), and InceptionV3 (69%). The comparison clearly demonstrates that models with higher accuracy also exhibit more stable statistical characteristics, confirming the robustness and generalization ability of ResNet50. These findings highlight that deeper architectures with residual learning are more effective in capturing complex histopathological features, thereby improving classification performance.
Ablation Study
An ablation study was carried out utilizing the LC25000 histopathology dataset to assess the contribution of various components of the proposed architecture. The goal of this investigation is to see how different design decisions, such as preprocessing, data augmentation, and model architecture, affect overall classification performance. The trials were carried out utilizing the ResNet50 architecture, which outperformed all other models tested. Different model configurations were explored by gradually adding important components from the proposed pipeline. Table 4 shows the categorization accuracy for each arrangement.
Table 4: Ablation study evaluating the contribution of different components
|
Configuration |
Preprocessing | Data Augmentation | Deep Model | Explainability | Accuracy |
| Baseline CNN | ✓ | ✗ | CNN | ✗ |
0.94 |
|
CNN + Augmentation |
✓ | ✓ | CNN | ✗ | 0.96 |
| Transfer Learning Model | ✓ | ✓ | VGG16 | ✗ |
0.98 |
|
Proposed Model |
✓ | ✓ | ResNet50 | ✗ | 0.99 |
| Proposed Model + XAI | ✓ | ✓ | ResNet50 | Grad-CAM + LIME + SHAP |
0.99 |
The findings show that data pre-treatment and augmentation greatly improve classification performance by enhancing dataset diversity and decreasing overfitting. The introduction of transfer learning architectures like VGG16 and ResNet50 improves feature extraction capabilities, allowing for more accurate differentiation of complex histopathological patterns. ResNet50 achieved the greatest accuracy of 0.99 out of all setups, demonstrating the usefulness of deep residual learning for medical image categorization. Although the use of explainability approaches has little direct impact on classification accuracy, Grad-CAM, LIME, and SHAP provide useful insights into the model’s decision-making process by emphasizing clinically significant tissue regions. These findings demonstrate that combining a robust deep learning architecture with explainable AI techniques creates a viable framework for accurate and interpretable cancer diagnosis.
Discussion
The experimental results demonstrate that deep learning models are highly effective for histopathological image classification, with ResNet50 achieving the best overall performance among all evaluated architectures. The superior performance of ResNet50 can be attributed to its residual learning framework, which enables the training of deeper networks by mitigating the vanishing gradient problem. This allows the model to capture complex and fine-grained features present in histopathological images, leading to improved classification accuracy and generalization. In comparison, models such as MobileNetV2 and InceptionV3 exhibited relatively lower performance, particularly in distinguishing visually similar cancer subtypes. Lightweight architectures like MobileNetV2 are designed for computational efficiency, which may limit their ability to capture intricate spatial patterns. Similarly, the performance of InceptionV3 suggests that not all deep architectures are equally effective for histopathological data, highlighting the importance of selecting appropriate model structures for medical imaging tasks. The integration of explainable artificial intelligence (XAI) techniques, including Grad-CAM, LIME, and SHAP, further enhances the interpretability of the proposed framework. These methods provide visual and feature-level explanations, enabling the identification of clinically relevant regions such as abnormal glandular structures, irregular nuclei, and dense cellular formations. This confirms that the model’s predictions are based on meaningful pathological features rather than background artifacts, thereby increasing trust and transparency in clinical applications. From a statistical perspective, the confusion matrix analysis indicates that ResNet50 achieves consistent classification across all tissue classes with minimal misclassification. The stability observed in performance metrics such as precision, recall, and F1-score further confirms the robustness of the model. In contrast, other models show higher variability and misclassification rates, indicating weaker generalization capability. These findings align with the overall performance results and reinforce the reliability of the proposed approach. Furthermore, when compared with traditional machine learning models such as Support Vector Machine (SVM), Random Forest, and Logistic Regression, deep learning models demonstrate superior performance due to their ability to automatically learn hierarchical features from images. Machine learning models rely on manual feature extraction and are less effective in capturing complex spatial patterns. The comparison results (Table 3) clearly indicate that deep learning models, particularly ResNet50, outperform machine learning approaches in terms of accuracy, stability, and generalization. Despite these advantages, the proposed approach has certain limitations. The model performance is dependent on the LC25000 dataset, and variations in real-world clinical data, including differences in patient demographics and imaging conditions, may affect generalization. Additionally, the current framework focuses only on histopathological images and does not incorporate multimodal data such as clinical or genomic information. Overall, the findings highlight the importance of combining deep learning with explainable AI techniques to develop reliable and interpretable diagnostic systems. Such systems have the potential to assist pathologists in improving diagnostic accuracy, reducing workload, and enabling more informed clinical decision-making.
Conclusion
This paper presented an explainable deep learning architecture for automated histopathology image categorization, with the goal of early identification of lung and colon malignancies. Using the LC25000 histopathology dataset, which comprised five tissue classifications, the proposed technique explored six deep learning architectures (CNN, VGG16, ResNet50, MobileNetV2, EfficientNetB0, and InceptionV3). To increase the resilience and generalization of the model, extensive preprocessing and data augmentation techniques were employed. With an overall accuracy of 99%, ResNet50 outperformed the other models in terms of precision, recall, and F1-score metrics. EfficientNetB0 achieved competitive performance at 97% accuracy, while CNN and VGG16 reached 98%. In contrast, MobileNetV2 and InceptionV3 showed comparatively lower performance, particularly in distinguishing similar lung cancer subtypes. Explainable AI methods including Grad-CAM, LIME, and SHAP were applied to the best-performing model to enhance transparency and clinical interpretability. The visual explanations demonstrated that the model focuses on clinically relevant regions such as abnormal glandular structures, irregular nuclei, and dense cellular patterns, confirming that predictions are based on meaningful histopathological features. Despite these promising results, this study has certain limitations. The model performance is dependent on the LC25000 dataset, and cross-dataset validation was not performed. Additionally, the current framework is limited to histopathological images and does not incorporate multimodal data such as clinical or genomic information. Future work will focus on improving model robustness and generalization by integrating transformer-based architectures, multimodal data fusion, and cross-dataset validation. These enhancements will further strengthen the applicability of the proposed system in real-world clinical settings and support more reliable computer-aided cancer diagnosis.
Acknowledgement
We would like to thank P.S.R Engineering College for providing the resources that made this research possible.
Funding Sources
The author(s) received no financial support for the research, authorship, and/or publication of this article.
Conflict of Interest
The authors do not have any conflict of interest.
Data Availability Statement
This statement does not apply to this article.
Ethics Statement
This research did not involve human participants, animal subjects, or any material that requires ethical approval.
Informed Consent Statement
This study did not involve human participants, and therefore, informed consent was not required.
Clinical Trial Registration
This study does not involve any clinical trial requiring registration.
Permission to Reproduce Material from Other Sources
Not applicable
Author contributions
- Paulraj Ranjith kumar – Methodology, Concept, Resources, Data Collection, Verification, Final Manuscript;
- Vimala Mannarsamy- Methodology, Concept, Software, Validation
- Nishanthini Gopalakrishnan– Methodology, Concept, Software, Validation, Resources, Draft Manuscript
- Shanmugam Manikandan – Technical Review,Visualization, Supervision, Draft Manuscript;
References
- Masud M, Sikder N, Nahid AA, Bairagi AK, AlZain MA. A machine learning approach to diagnosing lung and colon cancer using a deep learning-based classification framework. Sensors (Basel). 2021;21(3):748.
CrossRef - Abd El-Aziz AA, Mahmood MA, Abd El-Ghany S. Advanced deep learning fusion model for early multi-classification of lung and colon cancer using histopathological images. Diagnostics (Basel). 2024;14(21):2274.
CrossRef - Provath MAM, Deb K, Dhar PK, Shimamura T. Classification of lung and colon cancer histopathological images using global context attention-based convolutional neural network. IEEE Access. 2024;12.
CrossRef - Razmjouei P, Moharamkhani E, Hasanvand M, Daneshfar M, Shokouhifar M. Metaheuristic-driven two-stage ensemble deep learning for lung/colon cancer classification. Comput Mater Contin. 2024;80(3).
CrossRef - Bushara BAR, Vinod Kumar RS. A deep learning-based lung cancer classification of CT images using augmented convolutional neural networks. Electron Lett Comput Vis Image Anal. 2022;21(1):130-142.
CrossRef - Javed R, Saba T, Alahmadi TJ, Al-Otaibi S, AlGhofaily B, Rehman A. EfficientNetB1 deep learning model for microscopic lung cancer lesion detection and classification using histopathological images. Comput Mater Contin. 2024;81(1):809-825.
CrossRef - Vimala M, Kalisatheesh B, Ramasamy S, Kumar PR, Nandhini M. Innovative lung cancer detection: integrating attention U-Net segmentation with ensemble deep learning classification. In: Proc Int Conf Multi-Agent Systems for Collaborative Intelligence (ICMSCI). 2025:1645-1653. doi:10.1109/ICMSCI62561.2025.10894203
CrossRef - Dutta TK, Nayak DR, Pachori RB. GT-Net: global transformer network for multiclass brain tumor classification using MR images. Biomed Eng Lett. 2024;14(4):1069-1077.
CrossRef - Kode H, Barkana BD. Deep learning- and expert knowledge-based feature extraction and performance evaluation in breast histopathology images. Cancers (Basel). 2023;15(12):3075.
CrossRef - Uddin AH, et al. Colon and lung cancer classification from multi-modal images using resilient and efficient neural network architectures. 2024;10(9):e30625.
CrossRef - SKB S, et al. An enhanced multimodal fusion deep learning neural network for lung cancer classification. Syst Soft Comput. 2023;6:200068.
CrossRef - Gulum M, Trombley CM, Kantardzic M. A review of explainable deep learning cancer detection models in medical imaging. Appl Sci. 2021;11(10):4573. doi:10.3390/app11104573
CrossRef - Gaur L, et al. Explanation-driven deep learning model for prediction of brain tumour status using MRI image data. Front Genet. 2022;13:826531. doi:10.3389/fgene.2022.826531
CrossRef - Chiesa-Estomba C, et al. Explainable AI for retinoblastoma diagnosis: interpreting deep learning models with LIME and SHAP. Diagnostics (Basel). 2023;13(11):1930.
CrossRef - Abdullakutty F, et al. Histopathology in focus: a review on explainable multi-modal approaches for breast cancer diagnosis. Front Med. 2024;11:1421666.
CrossRef - Sah NK, et al. Interpretable deep learning for skin cancer detection: exploring LIME and SHAP. In: Proc Int Conf Comput Commun Netw Technol (ICCCNT). 2024:1-7. doi:10.1109/ICCCNT56998.2024.10721437
CrossRef - Murugan TK, Karthikeyan P, Sekar P. Efficient breast cancer detection using neural networks and explainable artificial intelligence. Neural Comput Appl. 2024;36(30):17703-17718.
- Alsubai S. Transfer learning based approach for lung and colon cancer detection using local binary pattern features and explainable artificial intelligence techniques. PeerJ Comput Sci. 2024;10:e1878.
CrossRef - Auzine MM, et al. Development of an ensemble CNN model with explainable AI for the classification of gastrointestinal cancer. PLoS One. 2024;19(6):e0304150.
CrossRef - Ukwuoma C, et al. Enhancing histopathological medical image classification for early cancer diagnosis using deep learning and explainable AI – LIME and SHAP. Biomed Signal Process Control. 2025;96:106407.
CrossRef - Faria N, Campelos S, Carvalho V. Enhancing histopathological lung cancer diagnosis through explainable deep learning models: a methodological framework proposal. Information (Basel). 2025;16(9):740.
CrossRef - Rao BD, Madhavi K. Enhancing bone cancer detection through optimized pre-trained deep learning models and explainable AI using the osteosarcoma tumor assessment dataset. Sci Rep. 2025;15(1):23856.
CrossRef - Alom MR, et al. An explainable AI-driven deep neural network for accurate breast cancer detection from histopathological and ultrasound images. Sci Rep. 2025;15(1):18479.
CrossRef - Rahman A, et al. Enhanced MRI brain tumor detection using deep learning in conjunction with explainable AI SHAP-based diverse and multi-feature analysis. Sci Rep. 2025;15(1):21406.
CrossRef - Ren T, et al. An interpretable hybrid deep learning framework for gastric cancer diagnosis using histopathological imaging. Sci Rep. 2025;15(1):24073.
CrossRef - Chetry MR, et al. Early detection and analysis of accurate breast cancer for improved diagnosis using deep supervised learning for enhanced patient outcomes. PeerJ Comput Sci. 2025;11:e2194.
CrossRef - Mastoi QUA, et al. Explainable AI in medical imaging: an interpretable and collaborative federated learning model for brain tumor classification. Front Oncol. 2025;15:1399199.
CrossRef - Berti A, et al. An explainable-by-design end-to-end AI framework based on prototypical part learning for lesion detection and classification in digital breast tomosynthesis images. Comput Struct Biotechnol J. 2025;23:3083-3097.
CrossRef - Garg P, Sharma MK, Kumar P. Transparency in diagnosis: unveiling the power of deep learning and explainable AI for medical image interpretation. Arab J Sci Eng. 2025;50(2):1607-1623.
CrossRef - Asal B. Explainable deep learning for breast cancer diagnosis using NODE and FT-Transformer models: a SHAP and LIME-based interpretability study. In: Proc Int Symp Innovative Approaches in Smart Technologies (ISAS). 2025:1-6.
CrossRef - Ma J, et al. Interpretable deep learning for gastric cancer detection: a fusion of AI architectures and explainability analysis. Front Immunol. 2025;16:1389012.
CrossRef - Bhattacharjee, Y. -B. Hwang, K. Ikromjanov, R. I. Sumon, H. -C. Kim and H. -K. Choi, “An Explainable Computer Vision in Histopathology: Techniques for Interpreting Black Box Model,” 2022 International Conference on Artificial Intelligence in Information and Communication (ICAIIC), Jeju Island, Korea, Republic of, 2022, pp. 392-398, doi: 10.1109/ICAIIC54071.2022.9722656.
CrossRef - Paudel, R. Saud, S. K. Karna and M. Bhandari, “Determining the Major Contributing Features to Predict Breast Cancer Imposing ML Algorithms with LIME and SHAP,” 2023 International Conference on Electrical, Computer and Energy Technologies (ICECET), Cape Town, South Africa, 2023, pp. 1-7, doi: 10.1109/ICECET58911.2023.10389217.
CrossRef - S. Ahmed, K. N. Iqbal and M. G. R. Alam, “Interpretable Lung Cancer Detection using Explainable AI Methods,” 2023 International Conference for Advancement in Technology (ICONAT), Goa, India, 2023, pp. 1-6, doi: 10.1109/ICONAT57137.2023.10080480.
CrossRef - Oli, Y. R., Regmi, L., Poudel, P., Karna, S. K., & Bhandari, M. (2023). Unlocking the Potential of CT scans: An Explanation-Driven Deep Learning Model for Predicting Lung Cancer. International Journal on Engineering Technology, 1(1), 223–231. https://doi.org/10.3126/injet.v1i1.60945.
CrossRef - Sarkar, O., Shafiuzzaman, M., Ahamed, Md. F., Mahmud, G., & Chowdhury, M. E. H. (2025). MSRANetV2: An Explainable Deep Learning Architecture for Multi-class Classification of Colorectal Histopathological Images. https://arxiv.org/abs/2510.24136v1.
- Jebaranjani, P. Venkadesh, S. V. Divya, M. Mahalakshmi, D. Shalini, and P. Prasitha, “A Hybrid CNN-LSTM Multi-Modal for Early Detection and Recurrence Prediction of Ovarian Cancer and Model Transparency using SHAP and LIME,” pp. 719–725, Aug. 2025, doi: 10.1109/iccpct65132.2025.11176627.
CrossRef - Roy, S. Gupta, M. Islam, S. Arman, and A. Azad, “Enhancing Histological Cancer Cell Detection: Integrating XAI with Deep Learning for Improved Accuracy, Interpretability, and Clinical Trust”, [Online]. Available: https://www.researchsquare.com/article/rs-8157817/latest
- “Deep Learning For Lung And Colon Cancer Detection With Explainable Artificial Intelligence(AI),” May 2025, doi: 10.5281/zenodo.15383035.
- Tyrovolas, P. Tsompou, and D. Tzouka, “Towards Causal Explainable AI in Cancer Diagnosis: Advances, Challenges, and Future Directions*”, [Online]. Available: https://ieeexplore.ieee.org/abstract/document/11253261/
- K. Mondol, E. K. A. Millar, P. Graham, L. Browne, A. Sowmya, and E. Meijering, “GRAPHITE: Graph-Based Interpretable Tissue Examination for Enhanced Explainability in Breast Cancer Histopathology,” Jan. 2025, doi: 10.48550/arxiv.2501.04206.
CrossRef - VimalaMannarsamy, Ponnrajakumari Mahalingam, Thilagam Kalivarathan, K Amutha, Ranjith Kumar Paulraj, Ramasamy, “Sift-BCD: SIFT-CNN integrated machine learning-based breast cancer detection”, Biomedical Signal Processing and Control, vol. 106, August 2025, pp.107686.
CrossRef
Abbreviations
AI – Artificial Intelligence
XAI – Explainable Artificial Intelligence
CNN – Convolutional Neural Network
VGG16 – Visual Geometry Group 16-layer Network
ResNet50 – Residual Network (50 layers)
MobileNetV2 – Mobile Neural Network Version 2
EfficientNetB0 – Efficient Neural Network (Baseline Model B0)
InceptionV3 – Inception Version 3
Grad-CAM – Gradient-weighted Class Activation Mapping
LIME – Local Interpretable Model-Agnostic Explanations
SHAP – Shapley Additive Explanations
LC25000 – Lung and Colon Histopathological Image Dataset (25,000 images)
WHO – World Health Organization
GPU – Graphics Processing Unit
ReLU – Rectified Linear Unit
CT – Computed Tomography
MRI – Magnetic Resonance Imaging
EEFO – Electric Eel Foraging Optimization
THD – Total Harmonic Distortion
 PlumX:
 Views: 194
  PDF Downloads:
7
PDF Downloads:
7 
Accepted on: 03-07-2026
Second Review by: Dr. Grigorios Kyriakopoulos and Dr. Yerbolat Iztleuov
Final Approval by: Dr. Prabhishek Singh