Association of KCNJ11 (E23K) Gene Polymorphism with Susceptibility to Type 2 Diabetes in Bangladeshi Population: A Case-control Study
 , Sadia Jannat Tauhida1, Md. Mohaimenul Islam Tareq1, Florence Bornali Ratno1, Mohammad Ashik Sheikh1, Most. Shaharia Akter Borsa1, Md. Nazmul Hasan Zilani2, , 4, S. M. Khaledur Rahman1, and Md. Nazmul Hasan1*
 1Laboratory of Pharmaceutical Biotechnology and Bioinformatics, Department of Genetic Engineering and Biotechnology, Jashore University of Science and Technology, Jashore, Bangladesh.
2Department of Pharmacy, Jashore University of Science and Technology, Jashore 7408, Bangladesh.
3Division of Medical Oncology, Department of Internal Medicine, The Ohio State University College of Medicine, Columbus, OH, USA.
4Pelotonia Institute for Immuno-Oncology, The Ohio State University Comprehensive Cancer Center Arthur G James Cancer Hospital and Richard J Solove Research Institute, Columbus, OH, USA.
Corresponding Author E-mail:mn.hasan@just.edu.bd
DOI : http://dx.doi.org/10.13005/bpj/3537
Download this article as:

Type 2 diabetes mellitus (T2DM) is a complex, multifactorial metabolic disease that involves a number of interactions between genetic and environmental factors. There are gene variants that are involved in insulin secretion control including KCNJ11 which have been found to contribute to the susceptibility of T2DM in different populations. Nonetheless, there is limited information on people of Bangladesh. The purpose of the study was to examine the relationship between the KCNJ11 E23K (rs5219) polymorphism and T2DM among Bangladeshi adults as well as conducting clinical and biochemical characterization. The sample size was 310 consisting of 210 T2DM patients and 100 non-diabetic controls. The clinical and biochemical parameters were analyzed with the help of standard laboratory techniques. Genomic DNA was extracted from peripheral blood samples, and the KCNJ11 E23K polymorphism was analyzed by PCR followed by Sanger sequencing in a subset of 110 participants, including 55 T2DM cases and 55 controls, selected based on DNA quality, sample availability, and resource feasibility. Genotype distributions of cases and controls were compared using the chi-square test. Fasting plasma glucose, 2-hour plasma glucose, systolic blood pressure, serum triglycerides and creatinine levels were significantly higher in T2DM patients than in controls (p < 0.001), while HDL cholesterol levels were significantly lower in T2DM patients than in controls (p < 0.001). There were no significant differences seen in diastolic blood pressure, total cholesterol or LDL cholesterol. Genotype analysis showed that the AA genotype was present in 25 T2DM patients (45.45%) and 21 controls (38.18%) among the sequenced subsets. Despite pronounced metabolic alterations among T2DM patients, no significant association was observed between the KCNJ11 E23K polymorphism and T2DM susceptibility in this Bangladeshi population. Larger studies incorporating multiple genetic variants and broader population coverage are warranted to further elucidate the genetic architecture of T2DM in South Asian populations.
KEYWORDS:E23K Polymorphism; KCNJ11; rs5219; Sanger Sequencing; Type 2 Diabetes Mellitus (T2DM)
Introduction
Type 2 diabetes mellitus (T2DM) is a chronic metabolic disorder characterized by persistent hyperglycemia due to insulin resistance, insulin deficiency or a combination.1 T2DM is a disease that has affected more than 460 million people all over the world and the disease is also expected to rise, particularly in low- and middle-income nations.2 The prevalence of T2DM in Bangladesh has been increasing at a considerable rate due to urbanization, sedentary lifestyles, dietary changes, and predisposition and about 10% of the adults are affected.3 Serious microvascular complications including retinopathy, nephropathy, and neuropathy as well as macrovascular conditions like cardiovascular disease that raise the risk of morbidity and death have been linked to type 2 diabetes .4 Although lifestyle and environmental factors do play a major role, T2DM is essentially a multifactorial disease with an important role played by a strong genetic predisposition.5
Numerous loci linked to 8 beta-cell functioning, insulin secretion as well as glucose metabolism has been identified by genome-wide association studies (GWAS).6 Among the common ones are KCNJ11, ABCC8, KCNQ1, CDKAL1, CDKN2A/B, and HHEX gene that control ATP-sensitive potassium channels (KATP), insulin granule release, and glucose-stimulated insulin secretion.7 These genes have polymorphism that may modify the β-cell responsiveness to be predisposed to T2DM in the stress of the environment.
The KCNJ11 gene is the gene that encodes the Kir6.2 subunit of the KATP channel in pancreatic 8 cells and therefore links the messages of metabolism and insulin secretion.8 Increased glucose metabolism is associated with intracellular ATP increasing closure of the KATP channel, membrane depolarization, influx of calcium, and release of insulin. Insufficient insulin secretion and hyperglycemia are caused by dysregulation of KCNJ11 of this pathway. KCNJ11 changes have been also associated with neonatal diabetes, MODY-like phenotypes, and hyperinsulinism, showing its physiological importance.9 One of the variants that are known is E23K (rs5219), which entails a substitution of glutamic acid (E)with lysine (K) at codon 23. The K allele enhances the open pore of the KATP channel, which reduces the sensitivity of ATP and disturbs insulin secretion.10
Several research studies have found a correlation between E23K variant and T2DM among various in different populations,11 Japanese12 and European cohorts.13 The application of the meta-analyses also says that K allele carriers have an increased risk of developing T2DM, which also supports the fact that it is a worldwide concern.
Not every study has, however, always shown significant relationship between the E23K KCNJ11 polymorphism and T2DM. A number of population-based studies such as those of South Indian population14 and the Korean population15 showed no significant association between the E23K variant and susceptibility to T2DM. Moreover, population- stratified studies of European cohorts have indicated the association to be heterogenous, indicating that the E23K variant effect might differ across ethnic background and environmental conditions.16 These discrepancies could indicate variation in genetic architecture, sample size, linkages disequilibrium, or gene environment interactions, and the significance of performing population-specific genetic association studies.
ABBC8 gene is a gene that encodes SUR1 subunit of the KATP channels and it works in conjunction with KCNJ11. C49620T variants influence the functioning of the beta-cells and their insulin production, which makes them a risk factor in T2DM among different groups of people, including Chinese and Nigerian groups of patients. There are other prone genes such as CDKAL1, CDKN2A/B and KCNQ1 that are involved in the development of the β-cell and insulin signalling.17 The findings are significant in the sense that the study of T2DM susceptibility involves more than just a single genetic locus. Although there is considerable research in the world, little information of the populations of South Asia such as Bangladesh is available. A gap in knowledge on the role of the KCNJ11 E23K variant in this population does exist. The importance of population-directed studies has been found to define genetic-based risk factors and inform precision medicine strategies.
Combined, the mixed results that have been reported across populations point to the fact that the role of distinct genetic variants in the risk of type 2 diabetes is not universal, but rather context dependent. In South Asian nations like Bangladesh, the ongoing escalating burden of T2DM has been influenced by the dramatic epidemiological, nutritional, and lifestyle change which can alter the penetrance of the known genetic risk variants.18 In addition, increasingly there is mounting evidence that T2DM is a polygenic disease whereby single candidate variants do not usually cause a significant proportion of overall susceptibility, but rather cumulative genetic load, and environmental exposures are dominant factors.19
Genome-wide and trans-ethnic studies of large scale have also shown a marked heterogeneity in the T2DM-related loci among ancestries, and the lack of transferability of genetic risks between populations. This applies especially to the case of South Asian populations whose genetic architectures and cardiometabolic risks profile differ significantly with the European and East Asian cohorts.20 Moreover, it was demonstrated that gene-environment interaction with obesity, physical activity and dietary patterns and means that the phenotypic expression of genetic variants of diabetes is significantly affected by such interactions, complicating the interpretation of single-SNP association studies.21
The issues of methodology also should be approached with caution, since the effect sizes in the candidate gene association literature can be overstated or even varied across studies of smaller size with limited sample sizes or population stratification. Such challenges are particularly acute in the low- and-middle-income populations, where the prevalence rates of diabetes are growing very fast but little population-specific genetic information is available at the time.22 Moreover, according to functional research, the β-cell processes including the ATP-sensitive potassium (KATP) system of channels can be regulated by a complex of regulatory networks, and a differentiation in KCNJ11 can have context-dependent effects that cannot be entirely determined in isolated single-variant studies.23
The current research was aimed at determining the relationship between the KCNJ11 E23K (rs5219) polymorphism and predisposition to type 2 diabetes mellitus in Bangladeshi adults, as well as the detailed clinical and biochemical phenotyping. This study will help add to the more detailed picture of T2DM genetics and will also justify the future use of multi-locus, integrative, and precision medicine-focused disease risk approaches through generating population-specific genetic evidence using an understudied population of South Asian immigrants.
Materials and methods
Study population and design
This study enrolled 310 participants, including 210 patients with type 2 diabetes mellitus (T2DM) 105 men and 105 women) and 100 healthy control participants (50 men and 50 women). All T2DM cases were diagnosed according to American Diabetes Association (ADA) criteria and were recruited from a tertiary care healthcare facility in the Khulna division of Bangladesh. A standardized questionnaire was used to collect information regarding demographic characteristics, medical history, medication use, and lifestyle factors.
Patients with a history of chronic systemic diseases, pregnancy, renal or hepatic abnormalities, prior major cardiovascular events, or type 1 diabetes mellitus were excluded from the study to reduce the potential influence of severe comorbid conditions and treatment-related variation on biochemical parameters. However, excluding individuals with prior major cardiovascular events may have resulted in selection of a comparatively milder diabetic phenotype, which could limit the generalizability of the findings to the broader T2DM population.24 Some patients had undergone conventional antidiabetic treatment, such as metformin, sulfonylureas and/or statins, at the time of enrolment.
Control subjects were unrelated, healthy people with a fasting plasma glucose level of less than 100 mg/dL, who did not have a family history of diabetes.25 The control group was not fully age-matched with the T2DM group. Therefore, age-related confounding may influence the interpretation of genotype-disease associations in the present case-control design. This limitation was considered during interpretation of the genetic findings, and the results were interpreted cautiously.
Obesity was not used as an inclusion criterion in the present study, and BMI data were not available for all participants. Therefore, obesity-based subgroup analysis and BMI-adjusted regression analysis were not performed. All participants provided informed consent before their involvement in the study, which was carried out in compliance with the Declaration of Helsinki’s principles.26
Ethical Approval
The Ethical Review Committee of the Faculty of Biological Science and Technology, Jashore University of Science and Technology, Bangladesh [ERC/FBST/JUST/2025-217] approved all procedures related to the collection, handling, and analysis of human blood samples. The study was conducted in compliance with institutional and international ethical standards.27
Primer Design
Primers targeting the E23K (rs5219) polymorphic region of the KCNJ11 gene were adopted from a previously published study and were not newly designed in the present work. The primer sequences were chosen based on their previous validation and effective use in identifying the KCNJ11 E23K polymorphism in a human population study.11 The forward primer sequence was 5 -GACTCTGCAGTGAGGCCCTA-3, and the reverse primer sequence was 5 -ACGTTGCAGTTGCCTTTCTT-3, which amplify a fragment of 210 bps including E23K variant. The primers have been demonstrated before to give selective and faithful amplification of the target KCNJ11 gene region. Primer sequences were also cross-checked with the NCBI Primer-BLAST tool to verify single-target amplification of the intended genomic region to assure specificity in the amplification process in the current study.
Data collection and biochemical analyses
Venous blood samples of all the participants were taken following an overnight fast, under aseptic conditions and were subdivided into plain tube and EDTA vacutainer tubes. Serum was collected in plain tubes for analysis of fasting plasma glucose, parameters of lipid profiles ( total cholesterol, triglycerides and high density lipoprotein cholesterol), and serum creatinine level by automated analyzer Beckman Coulter AU480 using commercially available Beckman reagent kits (USA).28 The Friedewald formula was used to compute the low-density lipoprotein cholesterol (LDL-C). Moreover, the 2-hour postprandial (2-h PP) plasma glucose test was conducted to determine the post-load glycemic status according to the conventional clinical guidelines.29 The measurements of blood pressure were taken with a calibrated sphygmomanometer based on the established procedures and the systolic and diastolic values of blood pressure were recorded to all the participants. All the biochemical studies were done according to the common lab protocol and quality control as reported in earlier research.30
Blood sample Collection
Patients with type 2 diabetes mellitus (T2DM) who had previously been diagnosed were given blood samples by the hospital’s attending physician. Each participant had about two milliliters of venous blood extracted into ethylenediaminetetraacetic acid (EDTA) tubes. Before undergoing additional molecular analysis, the gathered samples were appropriately labeled and stored at -20 °C.31
DNA extraction
A modified salting-out technique was used to extract the genomic DNA of peripheral whole blood. In brief, 150 uL of whole blood was moved into a sterile volume 1.5 ml Eppendorf tube with 1 ml of cell lysis solution. The mixture was swirled and centrifuged at 4000 rpm at 4 °C and 7.5 minutes. After centrifugation, the supernatant was properly disposed of in a waste bottle with Savlon and the resultant cell pellet was kept. The pellet was again resuspended by adding 25 µl of 5 M sodium perchlorate and 100 µl of nuclear lysis buffer and gently swirling the mixture on a rotary mixer at 30 rpm about 15 minutes at room temperature. It was then suspended at 65 °C over a period of 30 minutes to allow complete lysis of the nucleus. Following incubation, 125 µl of cold chloroform was added after which, the mixture was gently swirled at 30 rpm in a rotary mixer over a period of 10 minutes and centrifuged at 3000 rpm taking 2.5 minutes. The top aqueous layer was transferred to a new sterile volume of Eppendorf tube 1.5 ml. The desired DNA precipitation was obtained by adding 2 volumes of 70% ethanol to the aqueous phase that was transferred and then inverted gently. A 10,000-rpm centrifugation of the sample was then carried out for 10 minutes on a distinct pellet until a white, cotton-like pellet of DNA appeared. A DNA pellet was dissolved in 200 µl of TE buffer and allowed to dissolve overnight at 65 °C to get complete dissolution. Lastly, the genomic DNA sample was frozen at -20 C till further analysis.32
Gel electrophoresis
The purified and isolated DNA was characterized for purity and integrity by agarose gel electrophoresis. The DNA samples were loaded into the agarose gel with a concentration of 1× Tris-acetate-EDTA (TAE) buffer containing ethidium bromide (0.5µg/mL) approximately 10µL of each sample was loaded. After 30 to 40 minutes of electrophoresis at 100 V, DNA bands were seen using ultraviolet (UV) transillumination utilizing a gel documentation system. High-quality genomic DNA appropriate for subsequent molecular studies was indicated by the presence of distinct, complete bands without smearing.33
PCR amplification
The 2× ABclonal PCR Master Mix was used for PCR amplification, and the manufacturer’s suggested reagent composition and heat cycling parameters were closely followed. To achieve the final volume, each 25 µL reaction used 12.5 µL of the 2× Master Mix, 7 µL template DNA, 0.5 µL forward and 0.5 µL reverse primers specific to each gene, and 4.5 µL nuclease-free water. The PCR thermal cycling settings included an initial denaturation phase at 98 °C for 45 s, followed by 35 amplification cycles that included primer annealing at 56 °C for 30 s, extension at 72 °C for 30 s, and denaturation at 98 °C for 10 s. For an adequate synthesis of all amplicons, the final extension phase was carried out at 72 °C for 5 minutes. Following this, the reaction was maintained at 4°C. The PCR results were then examined by electrophoresis on a 2.5% agarose gel ran for 40 minutes in order to completely separate the amplicons. To provide the best possible amplification efficiency, fidelity, and reproducibility, all reactions were carried out in accordance with ABclonal criteria.34
Sanger Sequencing
Although 310 participants were recruited for clinical and biochemical characterization, molecular genotyping by Sanger sequencing was performed in a subset of 110 participants, consisting of 55 T2DM cases and 55 non-diabetic controls. This subset was selected based on the availability of high-quality extracted genomic DNA, successful PCR amplification, and sequencing-resource feasibility. The selected samples were used for genotype frequency comparison between cases and controls. This limitation has been acknowledged in the interpretation of the genetic association findings.
Purified PCR amplicons were subjected to Sanger sequencing using the usual procedure used by BdGenome sequencing facilities (Bangladesh) in order to confirm the sequence35. After being confirmed on an agarose gel, PCR products were purified by eliminating extra primers and dNTPs using an enzymatic cleanup technique.36 The purified DNA (10–20 ng/µL) was then mixed with either forward or reverse primer and sent out for sequencing. The cycle sequencing was performed using the typical temperature profile of 25 cycles, denaturation at 96 °C for 10 s, annealing at 50 °C for 5 s and extension at 60 °C for 4 min, with BigDye Terminator v3.1 chemistry.37 An automated capillary electrophoresis device (such as the ABI 3500/3730 Genetic Analyzer) was used to evaluate the extension products after they had been filtered to exclude any unincorporated dyes.38 The obtained sequencing reads were aligned using the MAFFT multiple sequence alignment program in a Linux Ubuntu environment. Alignment was performed to ensure accurate comparison of nucleotide sequences and to verify the presence of sequence variations within the targeted region of the KCNJ11 gene.39
Statistical analysis
Statistical analyses were conducted using SPSS software (IBM Corp., Armonk, NY, USA). Categorical variables were presented as frequencies and percentages, whereas continuous variables were presented as mean ± standard deviation (SD). The normality of continuous variables was assessed before analysis. Differences between T2DM patients and control subjects were evaluated using the independent samples t-test for continuous variables and the chi-square (χ²) test for categorical variables.40
Genotype and allele frequencies of the KCNJ11 E23K (rs5219) polymorphism were determined by direct counting. Differences in genotype distribution between T2DM cases and controls were assessed using the chi-square test.41 Hardy-Weinberg equilibrium (HWE) in the control group was evaluated using the chi-square goodness-of-fit test by comparing observed and expected genotype frequencies.
Adjusted logistic regression analysis was considered to evaluate whether the association between KCNJ11 E23K genotype and T2DM status was independent of potential confounding factors such as age and BMI. However, adjusted logistic regression could not be performed because complete individual-level covariate data, particularly BMI data, were not available for all participants in the present dataset. Therefore, the absence of adjusted regression analysis was acknowledged as a limitation, and the genetic association findings were interpreted cautiously. A p value < 0.05 was considered statistically significant for all two-tailed tests.42
Results
Clinical and biochemical characteristics
Table 01 shows the clinical and biochemical characteristics of the control subjects and T2DM patients. The gender distribution was similar between the control group and T2DM group, with 50 men and 50 women among controls and 105 men and 105 women among T2DM patients (p = 1.000). Because the controls were significantly younger than the patients with type 2 diabetes (p<0.001), age was considered a potential confounding factor in the interpretation of the genetic association analysis. Diabetic patients had significantly higher plasma glucose, 2-h plasma glucose, systolic blood pressure, serum triglycerides and serum creatinine levels and significantly lower HDL cholesterol, as compared to non-diabetic patients (p < 0.001 for all). There were no significant differences noted between the two groups for DBP, TC or LDL cholesterol (p > 0.05).
Table 1: Clinical and biochemical parameters of control subjects and type 2 diabetic patients.
| Biochemical characteristics | Control (n=100) | Type 2 diabetic patients (n=210) | P value |
| Gender | 50/50 | 105/105 | 1.000 |
| Age(yrs) | 31.73 ± 5.87 | 59.86 ± 8.73 | <0.001 |
| Fasting plasma glucose (mg/dl) | 87.39 ± 5.43 | 195.40 ± 20.43 | <0.001 |
| 2-h plasma glucose (mg/dl) | 111.18 ± 9.46 | 314.97 ± 67.56 | <0.001 |
| Systolic blood pressure (mmHg) | 114.86 ± 7.16 | 127.14 ± 4.50 | <0.001 |
| Diastolic blood pressure (mmHg) | 85.03 ± 3.11 | 85.01 ± 3.13 | 0.96 |
| Total cholesterol (mg/dl) | 177.92 ± 12.95 | 179.39 ± 13.06 | 0.352 |
| HDL cholesterol (mg/dl) | 69.91 ± 6.76 | 42.24 ± 4.36 | <0.001 |
| LDL cholesterol (mg/dl) | 103.22 ± 14.35 | 103.22 ± 14.35 | 1.000 |
| Serum triglycerides (mg/dl) | 113.00 ± 24.94 | 252.96 ± 49.14 | <0.001 |
| Serum creatinine (mg/dl) | 0.82 ± 0.07 | 0.90 ± 0.16 | <0.001 |
Genomic DNA extraction
Genomic DNA was successfully extracted from peripheral blood samples using the described lysis and purification protocol. The quality and integrity of the isolated DNA was evaluated by 1.5% Agarose gel electrophoresis. Visualization under UV illumination revealed clear, intact, and well-defined genomic DNA bands, with no evidence of degradation or smearing (Figure 1). The presence of high–molecular weight DNA indicated effective cell lysis, protein removal, and DNA precipitation. These results confirm that the extracted genomic DNA was of sufficient purity and integrity and was therefore suitable for subsequent PCR amplification and other downstream molecular analyses.
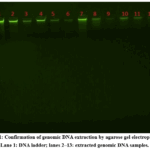 |
Figure 1: Confirmation of genomic DNA extraction by agarose gel electrophoresis. Lane 1: DNA ladder; lanes 2–13: extracted genomic DNA samples.
|
Polymerase Chain Reaction
The ABclonal 2x PCR Master Mix was utilized in optimal reaction and thermal cycling conditions to show successful amplification of the KCNJ11 gene. Electrophoretic separation of the PCR products in a 2.5% agarose gel revealed the existence of a clear, sharp and specific DNA band at 210 bp that is exactly the size of the amplicon of the KCNJ11 gene (Figure 2). A 50 bp DNA marker was also carried out with the samples to properly estimate the size of the fragments and to ensure that the bands had separated. The correct molecular weight of the PCR product was checked by putting the amplified product in between the 200 bp and 250 bp marker bands.
No other nonspecific bands or primer-dimer artifacts were observed, and this may indicate a high amplification specificity and reaction fidelity. The presence of the same band in all replicates is another indication of the quality and reliability of the PCR conditions used and confirms the appropriateness of the amplified fragment of KCNJ11 in further downstream analyses.
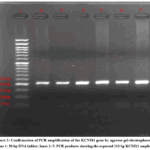 |
Figure 2: Confirmation of PCR amplification of the KCNJ11 gene by agarose gel electrophoresis. Lane 1: 50 bp DNA ladder; lanes 2–7: PCR products showing the expected 210 bp KCNJ11 amplicon
|
Sanger Sequencing
The amplification of the PCR products of KCNJ11 was successful, followed by the Sanger sequencing that could provide information about genetic variations and the quality of the sequence. Forward-direction Sanger sequencing was performed for a total of 110 samples, including 55 T2DM cases and 55 control subjects. The quality of nucleotide sequence reads produced by sequencing was high and the chromatograms generated were of high quality with clear and clean peaks and minimal noise in the background which might have been due to the successful purification and proper base calling.
E23K SNP Distribution and Allelic Frequencies of KCNJ11
The Sanger sequencing revealed the presence of the KCNJ11 E23K single nucleotide polymorphism (SNP) in both T2DM patients and control subjects. Multiple sequence alignment with MAFFT was employed to align the sequenced data in a Linux Ubuntu system, which showed the E23K substitution from glutamic acid to lysine at codon 23. Genotype analysis showed that the AA genotype was found in 25 T2DM patients (45.45%) and 21 control subjects (38.18%), whereas the GA genotype was found in 30 T2DM patients (54.55%) and 34 control subjects (61.82%). The GG wild-type genotype was not detected in either group (Table 02).
No significant difference was found in the distribution of genotypes between the two groups as revealed by chi-square analysis (χ² = 0.58, p = 0.45). Hardy-Weinberg equilibrium analysis was performed in the control group as a genotyping quality-control assessment. The observed control genotype distribution deviated from HWE (χ² = 11.01, p ≈ 0.0009), mainly due to the absence of the GG genotype. Therefore, the genotype-based findings should be interpreted cautiously and require validation in a larger independently genotyped cohort.
Because complete individual-level covariate data, particularly BMI data, were not available for all participants, adjusted logistic regression analysis could not be performed. Therefore, the genetic association findings were interpreted cautiously, particularly in view of the significant age difference between the T2DM and control groups. The multiple sequence alignment depicts genotype ratios and sequence conservation as presented in Figure 3 and Figure 4.
Table 2: Association of KCNJ11 (E23K) with type 2 diabetes
| Allele / SNP | Type 2 diabetic patients (n = 55) |
Frequency (%) | Control subjects (n = 55) |
Frequency (%) | P value |
| AA genotype | 25 | 45.45 | 21 | 38.18 | 0.45 |
| GA genotype | 30 | 54.55 | 34 | 61.82 | |
| GG genotype | 0 | 0.00 | 0 | 0.00 |
HWE, Hardy-Weinberg equilibrium; HWE was assessed in the control group using the chi-square goodness-of-fit test. The control genotype distribution deviated from HWE (χ² = 11.01, p ≈ 0.0009).
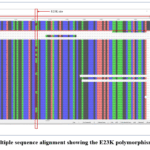 |
Figure 3: Multiple sequence alignment showing the E23K polymorphism in KCNJ11.
|
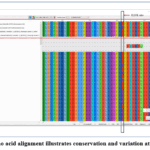 |
Figure 4: Amino acid alignment illustrates conservation and variation at the E23K site.
|
Discussion
The prevalence of type 2 diabetes mellitus (T2DM) is rapidly growing in Bangladesh and other South Asian countries due to demographic changes, urbanization, and lifestyle changes. Recent epidemiological projections repeatedly emphasize the escalating national burden, making it inevitable to describe both metabolic phenotypes and genetic factors in local populations instead of using only data that is extrapolated to other ethnic groups.43
Metabolic characteristics of the study population
In the current research, the distinction between the case and control groups was evident in different metabolic parameters. Diabetic patients were significantly older than the non-diabetic controls. Although increasing age is a well-established risk factor for T2DM, the large age difference between cases and controls represents an important methodological limitation of the present case-control design. This age imbalance may confound the interpretation of genotype-disease associations, because younger controls may not yet have reached the age at which T2DM risk becomes clinically apparent. Therefore, the genetic findings of this study should be interpreted cautiously and validated in future studies using age-matched controls. As per the diagnostic requirements, there was a significant rise in the fasting plasma glucose as well as 2-hour postprandial plasma glucose in T2DM patients, which has validated the strong definition of case and anticipated dysfunction in glucose homeostasis.25
Analysis of the blood pressure revealed that the SBP of the diabetic patients was significantly elevated as compared to the DBP of both the diabetic and non-diabetic patients 44. This is in line with an extensive literature that indicates that the systolic blood pressure level is more closely linked to the arterial stiffness, vascular ageing and cardiovascular risk of T2DM than the diastolic blood pressure level.45 The fact that the difference between the diastolic blood pressure is not significant can indicate heterogeneity in terms of vascular status, the use of antihypertensive treatment, or the difference in the period of disease in participants.
The data on lipid parameters showed that T2DM patients had a typical dyslipidemic profile with high triglyceride concentrations and low levels of HDL cholesterol.46 This mixture is considered to be one of the hallmarks of insulin resistance and is generally accepted to be one of the major causes of cardiovascular risk in diabetes. However, on the other hand, there was no significant difference in the total cholesterol and LDL cholesterol between groups. These outcomes are not unique to T2DM, where atherogenic risk could be qualitatively mediated by changes in LDL particle size and density,47 and not absolute levels of LDL-C, or in which between-group differences are nullified by medication use and lifestyle variables .
The serum creatinine was slightly, yet significantly elevated in diabetic patients, indicating early involvement of the kidneys or minor decrease in the renal functions in a portion of the patients 48. Even though serum creatinine alone is not sensitive in detecting early diabetic nephropathy, in population-based studies, elevated creatinine levels are reported in people with T2DM as compared to non-diabetic controls, which indicates that renal risk is also clinically relevant in diabetes.
Genetic analysis of KCNJ11 E23K polymorphism
Genetically, KCNJ11 is a biologically plausible candidate gene for susceptibility to T2DM because it encodes the Kir6.2 subunit of the ATP-sensitive potassium (KATP) channel of pancreatic β-cells, a channel that is central to the coupling of glucose metabolism to membrane depolarization and insulin secretion.23 The E23K (rs5219) variant has been reported to compromise channel activity, and is linked to T2DM across various populations, including initial large-scale association studies and subsequent meta-analyses.
In the present study, Sanger sequencing and multiple sequence alignment confirmed the presence of the E23K polymorphism, and alignment quality supported accurate identification of the amino acid substitution at codon 23. However, genotype distribution analysis did not demonstrate a statistically significant difference between diabetic patients and control subjects. The observed genotype distribution was not significantly different between groups, suggesting that the E23K variant did not show a strong independent association with T2DM susceptibility in this cohort.
Interpretation in the context of population heterogeneity
The lack of a significant association between KCNJ11 E23K and T2DM in this Bangladeshi population is consistent with reports from several South Asian and other ethnic groups, reflecting substantial heterogeneity in genetic effects across populations. Differences in allele frequency, linkage disequilibrium patterns, background polygenic risk, and gene–environment interactions may all contribute to variability in observed associations. In South Asian populations, where environmental exposures such as diet, physical activity, obesity, and blood pressure patterns differ markedly from Western cohorts, the phenotypic impact of individual genetic variants may be attenuated or modified.49
Implications and future directions
Taken together, these findings highlight two key points. First, the diabetic group exhibited a pronounced metabolic syndrome–like phenotype characterized by hyperglycemia, elevated systolic blood pressure, hypertriglyceridemia, and reduced HDL cholesterol, underscoring the substantial cardiometabolic burden associated with T2DM in this population. Second, despite clear metabolic differences between cases and controls, the single candidate variant KCNJ11 E23K did not explain disease susceptibility in this sample.
Another limitation of this study is that patients with prior major cardiovascular events were excluded. Although this exclusion criterion was applied to reduce the influence of severe comorbid conditions and treatment-related variation on biochemical comparisons, it may have selected a comparatively milder diabetic phenotype. Therefore, the present findings may not fully represent the genetic and metabolic characteristics of the broader Bangladeshi T2DM population, particularly individuals with advanced macrovascular complications.
Conclusion
In conclusion, this study evaluated the association between the KCNJ11 E23K polymorphism and type 2 diabetes mellitus in a Bangladeshi population. Although T2DM patients and controls differed significantly in several clinical and biochemical parameters, no statistically significant difference in KCNJ11 E23K genotype distribution was observed between the groups in the sequenced subset. However, the findings should be interpreted cautiously because of the age imbalance between cases and controls, absence of BMI-adjusted analysis, limited genotyped sample size, and deviation from Hardy-Weinberg equilibrium in the control group. Larger, age-matched, independently genotyped studies incorporating broader genetic and clinical data are needed to clarify the role of KCNJ11 E23K and other variants in T2DM susceptibility among South Asian populations.
Acknowledgement
We deeply thank the Department of Genetic Engineering and Biotechnology, Jashore University of Science and Technology for supporting this study.
Funding Sources
The author(s) received no financial support for the research, authorship, and/or publication of this article.
Conflict of Interest
The authors do not have any conflict of interest.
Data Availability Statement
The manuscript incorporates all datasets produced or examined throughout this research study.
Ethics Statement
This study has received ethical clearance from ethical standards approved by the Ethical Review Committee, Faculty of Biological Science and Technology, Jashore University of Science and Technology [Ref: ERC/FBS/JUST/2025-217].
Informed Consent Statement
This study has received written informed consent from all participants.
Clinical Trial Registration
This research does not involve any clinical trials
Permission to reproduce material from other sources
Not Applicable
Author Contributions
- Md. Nazmus sadik: Conceived and designed the study, collected samples, and contributed to manuscript drafting
- Sadia Jannat Tauhida: Conceived and designed the study, collected samples, contributed to manuscript drafting, performed DNA extraction, PCR amplification, and Sanger sequencing.
- Md. Mohaimenul Islam Tareq: Contributed to study design, sample collection, DNA extraction, PCR amplification, Sanger sequencing, and manuscript drafting.
- Florence Bornali Ratno: Assisted with DNA extraction, PCR experiments, and manuscript drafting.
- Mohammad Ashik Sheikh: Contributed to study design and sequence alignment analysis.
- Most. Shaharia Akter Borsa: Assisted with DNA extraction
- Md. Nazmul Hasan Zilani: Provided critical input during study design, reviewed the manuscript, and contributed to its finalization
- Partha Biswas: Provided critical input during study design, reviewed the manuscript, and contributed to its finalization
- S. M. Khaledur Rahman: Provided critical input during study design, reviewed the manuscript, and contributed to its finalization
- Md. Nazmul Hasan: Supervised the overall study, guided the experimental design and analysis, critically reviewed the manuscript, and approved the final version
References
- Ong KL, Stafford LK, McLaughlin SA, et al. Global, regional, and national burden of diabetes from 1990 to 2021, with projections of prevalence to 2050: a systematic analysis for the Global Burden of Disease Study 2021. The Lancet. 2023;402(10397):203-234.
CrossRef - Saeedi P, Petersohn I, Salpea P, et al. Global and regional diabetes prevalence estimates for 2019 and projections for 2030 and 2045: Results from the International Diabetes Federation Diabetes Atlas. Diabetes research and clinical practice. 2019;157:107843.
CrossRef - Ben Romdhane H, Ali SB, Aissi W, et al. Prevalence of diabetes in Northern African countries: the case of Tunisia. BMC public health. 2014;14(1):86.
CrossRef - Forouhi NG, Wareham NJ. Epidemiology of diabetes. Medicine. 2010;38(11):602-606.
CrossRef - McCarthy MI. Genomics, type 2 diabetes, and obesity. New England Journal of Medicine. 2010;363(24):2339-2350.
CrossRef - Voight BF, Scott LJ, Steinthorsdottir V, et al. Twelve type 2 diabetes susceptibility loci identified through large-scale association analysis. Nature genetics. 2010;42(7):579-589.
CrossRef - Zhou X, Chen C, Yin D, et al. A variation in the ABCC8 gene is associated with type 2 diabetes mellitus and repaglinide efficacy in Chinese type 2 diabetes mellitus patients. Internal Medicine. 2019;58(16):2341-2347.
CrossRef - Gloyn AL, Pearson ER, Antcliff JF, et al. Activating mutations in the gene encoding the ATP-sensitive potassium-channel subunit Kir6. 2 and permanent neonatal diabetes. New England Journal of Medicine. 2004;350(18):1838-1849.
CrossRef - Buchmann J, Meyer C, Neschen S, et al. Ablation of the cholesterol transporter adenosine triphosphate-binding cassette transporter G1 reduces adipose cell size and protects against diet-induced obesity. Endocrinology. 2007;148(4):1561-1573.
CrossRef - Nielsen E-MD, Hansen L, Carstensen B, et al. The E23K variant of Kir6. 2 associates with impaired post-OGTT serum insulin response and increased risk of type 2 diabetes. Diabetes. 2003;52(2):573-577.
CrossRef - Rastegari A, Rabbani M, Sadeghi HM, Imani EF, Hasanzadeh A, Moazen F. Association of KCNJ11 (E23K) gene polymorphism with susceptibility to type 2 diabetes in Iranian patients. Advanced biomedical research. 2015;4(1):1.
CrossRef - Gloyn AL, Weedon MN, Owen KR, et al. Large-scale association studies of variants in genes encoding the pancreatic β-cell KATP channel subunits Kir6. 2 (KCNJ11) and SUR1 (ABCC8) confirm that the KCNJ11 E23K variant is associated with type 2 diabetes. Diabetes. 2003;52(2):568-572.
CrossRef - Starkey JM, Haidacher SJ, LeJeune WS, et al. Diabetes-induced activation of canonical and noncanonical nuclear factor-κB pathways in renal cortex. Diabetes. 2006;55(5):1252-1259.
CrossRef - Görmüş U, Özmen D, Özmen B, et al. Serum N-terminal-pro-brain natriuretic peptide (NT-pro-BNP) and homocysteine levels in type 2 diabetic patients with asymptomatic left ventricular diastolic dysfunction. Diabetes research and clinical practice. 2010;87(1):51-56.
CrossRef - Koo B, Cho Y, Park B, et al. Polymorphisms of KCNJ11 (Kir6. 2 gene) are associated with Type 2 diabetes and hypertension in the Korean population. Diabetic Medicine. 2007;24(2):178-186.
CrossRef - Schlingmann KP, Konrad M, Jeck N, et al. Salt wasting and deafness resulting from mutations in two chloride channels. New England Journal of Medicine. 2004;350(13):1314-1319.
CrossRef - Moniruzzaman M, Ahmed I, Huq S, et al. Association of polymorphism in heat shock protein 70 genes with type 2 diabetes in Bangladeshi population. Molecular Genetics & Genomic Medicine. 2020;8(2):e1073.
CrossRef - Akhtar S, Nasir JA, Sarwar A, et al. Prevalence of diabetes and pre-diabetes in Bangladesh: a systematic review and meta-analysis. BMJ open. 2020;10(9):e036086.
CrossRef - Mahajan A, Taliun D, Thurner M, et al. Fine-mapping type 2 diabetes loci to single-variant resolution using high-density imputation and islet-specific epigenome maps. Nature genetics. 2018;50(11):1505-1513.
CrossRef - Spracklen CN, Horikoshi M, Kim YJ, et al. Identification of type 2 diabetes loci in 433,540 East Asian individuals. Nature. 2020;582(7811):240-245.
CrossRef - Franks PW, McCarthy MI. Exposing the exposures responsible for type 2 diabetes and obesity. Science. 2016;354(6308):69-73.
CrossRef - Atun R, Davies JI, Gale EA, et al. Diabetes in sub-Saharan Africa: from clinical care to health policy. The lancet Diabetes & endocrinology. 2017;5(8):622-667.
CrossRef - Ashcroft FM, Rorsman P. KATP channels and islet hormone secretion: new insights and controversies. Nature Reviews Endocrinology. 2013;9(11):660-669.
CrossRef - Organization WH. Definition and diagnosis of diabetes mellitus and intermediate hyperglycaemia: report of a WHO/IDF consultation. 2006;
- ElSayed NA, Aleppo G, Bannuru RR, et al. 2. Diagnosis and classification of diabetes: Standards of care in diabetes—2024. Diabetes Care. 2024;47
CrossRef - Association WM. World Medical Association Declaration of Helsinki: ethical principles for medical research involving human subjects. Jama. 2013;310(20):2191-2194.
CrossRef - Borgeat Meza M, Luengo-Charath X, Arancibia M, Madrid E. Council for International Organizations of Medical Sciences (CIOMS) Ethical Guidelines: advancements and unsolved topics in 2016 upgrade. Medwave. 2018;18(02)
CrossRef - Jung K. Tietz Textbook of Clinical Chemistry and Molecular Diagnostics, Carl A. Burtis, Edward R. Ashwood, and David E. Bruns, editors. St. Louis, MO: Elsevier Saunders, 2006, 2448 pp., $229.00, hardcover. ISBN 0-7216-0189-8. Clinical Chemistry. 2006;52(6):1214-1214.
CrossRef - ElSayed NA, Aleppo G, Aroda VR, et al. 2. Classification and diagnosis of diabetes: standards of care in diabetes—2023. Diabetes care. 2023;46(Supplement_1):S19-S40.
CrossRef - Rifai N. Tietz Fundamentals of Clinical Chemistry and Molecular Diagnostics 8 e; South Asia edition; E-book. Elsevier Health Sciences; 2019.
- Peeters M, Thibault A, Leupin N, Awada A. Favorable safety and tolerability of the dual CCR2/5 antagonist cenicriviroc in over 1000 subjects treated to date. HEPATOLOGY. 2017;66:1177A-1177A.
- Aljanabi SM, Martinez I. Universal and rapid salt-extraction of high quality genomic DNA for PCR-based techniques. Nucleic acids research. 1997;25(22):4692-4693.
CrossRef - Green MR, Sambrook J. Analysis of DNA by agarose gel electrophoresis. Cold Spring Harbor Protocols. 2019;2019(1):pdb. top100388.
CrossRef - Green MR, Sambrook J. Alkaline agarose gel electrophoresis. Cold Spring Harbor Protocols. 2021;2021(11):pdb. prot100438.
CrossRef - Sanger F, Nicklen S, Coulson AR. DNA sequencing with chain-terminating inhibitors. Proceedings of the national academy of sciences. 1977;74(12):5463-5467.
CrossRef - Werle E, Schneider C, Renner M, Völker M, Fiehn W. Convenient single-step, one tube purification of PCR products for direct sequencing. Nucleic acids research. 1994;22(20):4354.
CrossRef - Scientific TF. BigDye™ terminator v3. 1 cycle sequencing kit user guide. South San Francisco, CA: Thermo Fisher Scientific. 2016;
- Heather JM, Chain B. The sequence of sequencers: The history of sequencing DNA. Genomics. 2016;107(1):1-8.
CrossRef - Katoh K, Standley DM. MAFFT multiple sequence alignment software version 7: improvements in performance and usability. Molecular biology and evolution. 2013;30(4):772-780.
CrossRef - Rosner B. Chapter 12: Multisample inference. Fundamentals of Biostatistics, 7th edition Boston, MA: Cengage Learning. 2011:516-587.
- Balding DJ. A tutorial on statistical methods for population association studies. Nature reviews genetics. 2006;7(10):781-791.
CrossRef - Altman DG. Practical statistics for medical research. Chapman and Hall/CRC; 1990.
CrossRef - 2.Diagnosis and classification of diabetes: standards of care in diabetes—2024. Diabetes care. 2024;47(Supplement_1):S20-S42.
CrossRef - Hu FB, Manson JE, Stampfer MJ, et al. Diet, lifestyle, and the risk of type 2 diabetes mellitus in women. New England journal of medicine. 2001;345(11):790-797.
CrossRef - Cheung BM, Li C. Diabetes and hypertension: is there a common metabolic pathway? Current atherosclerosis reports. 2012;14(2):160-166.
CrossRef - Mooradian AD. Dyslipidemia in type 2 diabetes mellitus. Nature Reviews Endocrinology. 2009;5(3):150-159.
CrossRef - Packard CJ. Small dense low-density lipoprotein and its role as an independent predictor of cardiovascular disease. Current opinion in lipidology. 2006;17(4):412-417.
CrossRef - Fox CS, Matsushita K, Woodward M, et al. Associations of kidney disease measures with mortality and end-stage renal disease in individuals with and without diabetes: a meta-analysis. The Lancet. 2012;380(9854):1662-1673.
CrossRef - Scott RA, Scott LJ, Mägi R, et al. An expanded genome-wide association study of type 2 diabetes in Europeans. Diabetes. 2017;66(11):2888-2902.
CrossRef
 PlumX:
 Views: 1256
  PDF Downloads:
53
PDF Downloads:
53