
Manuscript accepted on :13-01-2026
Published online on: 26-02-2026
Plagiarism Check: Yes
Reviewed by: Dr. Ananya Naha
Second Review by: Dr. Tolmas Hamroyev
Final Approval by: Dr. Anton R Keslav
Shagun Sharma1,2 , Kalpna Guleria2*, Ayush Dogra3, Monika Sharma4and Satyam Kumar Agrawal4
1School of Computing Science and Engineering, VIT Bhopal University, Sehore, India
2Department of Computer Science and Engineering, Chitkara University Institute of Engineering and Technology, Chitkara University, Rajpura, Punjab, India
3Department of Electronics and Communication Engineering, Chitkara University Institute of Engineering and Technology, Chitkara University, Rajpura, Punjab, India
4Centre for in Vitro Studies and Translational Research, Chitkara College of Pharmacy, Chitkara University, Rajpura, Punjab, India
Corresponding Author: guleria.kalpna@gmail.com
DOI : https://dx.doi.org//10.13005/bpj/3348
Abstract
The manual cell classification methods are highly labour-intensive and time-consuming due to the complex and multidimensional structure of the biological data. The deep learning models are capable of extracting relevant features from the images, processing diverse data types, and handling the nonlinear relationships in the dataset. In the proposed work, two cell lines, MCF7 and HeLa, were cultured in standard conditions and images were captured using a phase contrast microscope. These captured images were grouped on the basis of their confluency and substituted into the deep learning-based Xception, InceptionV3, and MobileNetV2 models for training and multiclass classification. The dataset was augmented with multiple transformations, including rotation, shift, shear, and flipping, which produced 4,375 cancer cell line images. These models were implemented with both the original and augmented datasets, resulting in MobileNetV2 being the most optimal model, producing 94.3% accuracy with the augmented cell lines and 81.5% accuracy with the original cell lines dataset. Further, this model was also found to be the most efficient and lightweight deep learning architecture that provides faster communications in embedded and mobile vision applications. The findings of this work pave the way to further extend the proposed model for the real-time classification and identification of cancer cell lines in in vitro labs.
Keywords
Cell Classification; Deep Learning; HeLa; High-content Imaging; MCF7
Download this article as:| Copy the following to cite this article: Sharma S, Guleria K, Dogra A, Sharma M, Agrawal S. K. Label-free Classification of MCF7 and HeLa Cells using High-content Imaging and Deep Learning. Biomed Pharmacol J 2026;19(1). |
| Copy the following to cite this URL: Sharma S, Guleria K, Dogra A, Sharma M, Agrawal S. K. Label-free Classification of MCF7 and HeLa Cells using High-content Imaging and Deep Learning. Biomed Pharmacol J 2026;19(1). Available from: https://bit.ly/4cbJFUN |
Introduction
Researchers have widely employed cancer cell lines to study anticancer activity and evaluate potential leads, that include natural or synthetic molecules.1 The effectiveness of these cell lines hinges on their accurate classification, given the diverse availability of cell lines from several authentic and non-authentic sources. While the primary method of categorizing these cancer cell lines relies on the source tissue or histopathology of the original tumor, further subtyping often necessitates extensive molecular and genetic analysis.2 The emergence of cutting-edge high-throughput sequencing technologies has facilitated comprehensive molecular profiling of these cancer cell lines. This breakthrough has paved the way for more sophisticated classification systems that better capture the diversity of cancer cells.3 Nevertheless, there are still obstacles in consolidating and deciphering the extensive molecular data generated, necessitating the creation of advanced bioinformatics tools and algorithms for precise cell line categorization and identification. These refined classification systems have the potential to enhance the selection of suitable cell lines for specific research objectives and drug screening processes.4 By improving the alignment between cell lines and the molecular characteristics of patient tumors, scientists can boost the translational significance of preclinical investigations.5 Furthermore, enhanced classification methodologies may uncover previously unidentified subtypes or molecular features of cancer cell lines, potentially leading to new opportunities in targeted therapy development. For many of these cases, it is crucial to assess whether cell lines can be characterized phenotypically using microscopy images without specific staining, i.e. label-free imaging.6 Traditional methods for image-based cell phenotyping often depend on manual feature extraction, which involves identifying specific visual characteristics from each cell, such as the dimensions, form, membrane continuity, inter-cellular processes, and structural details of the nucleus and cytoplasm.7 Classification of cells using machine-learning techniques like support vector machines or neural networks relies on manually designed feature extraction methods .8 This approach has limitations in identifying specific phenotypes due to the restricted complexity of features, which hinders the ability to differentiate between similar phenotypes. Moreover, the feature extraction process from microscopy images is highly variable and depends on numerous manually adjusted parameters. In culture systems, all cells grow independently, having the same genetic content but definitely dis-similar appearance. The cells, however show certain characteristics that are similar or more pronounced in a cell population, which makes it unique and can be classified or characterized only by advanced machine learning techniques.9,10 To overcome these challenges, researchers have employed machine learning methods to directly phenotype cells from microscopy images. However, previous studies have primarily focused on broad cell categories with easily distinguishable morphologies, such as lymphocytes, granulocytes, and erythrocytes. For cells with more subtle morphological differences, phenotyping has largely been limited to binary classification to detect specific disease-related alterations.11 An alternative approach involves using brightfield microscopy images to predict the location of immune stains on subcellular structures for organelle identification. Nevertheless, additional research is needed to interpret these stains and establish their relationship to cell phenotypes. One significant obstacle in the development of machine learning algorithms for cell classification from unstained microscopy images is the process of dividing larger microscopy fields into individual cell images. This is particularly problematic for adherent cells, which grow in close proximity to each other, making it difficult to discern their boundaries. This can only be overcome when growing cells in culture flasks with fewer cells, which grow separately and at a distance. While this segmentation issue can also be simplified by using enzymes to separate the cells before imaging, it remains uncertain whether the phenotypic characteristics of the cells are maintained after this disaggregation process. The preservation of these traits is crucial for accurate classification and analysis.
The proposed work contributes to the development of a lightweight artificial intelligence-based model to efficiently classify MCF7 and HeLa cells, which enhances the automated analysis of medical images. The dataset has been created in the Centre for In Vitro Studies and Translational Research laboratory, where the MCF7 and HeLa cell cultures were used, and the microscope-based image acquisition was performed. Further, the created dataset has been divided into eight distinct categories, namely, MCF7_SCA, MCF7_LC, MCF7_SC, MCF7_FC, HeLa_SCA, HeLa_LC, HeLa_SC, and HeLa_FC. These images were used for the implementation of InceptionV3, Xception, and lightweight MobileNetV2 architectures to ensure computational efficiency while maintaining high classification accuracy.12 This AI-based classification model is suitable for real-time and resource-constrained applications in biomedical research and diagnostics.
This article has been divided into different sections consisting of section 2 elaborating on the literature review on the cancer cell classification techniques. Section 3 discusses the dataset creation and model implementation phases. Section 4 provides the results of the proposed model, and section 5 concludes the proposed work.
Literature review on the cancer cell classification techniques
The authors developed an optical biosensor model for cancerous and healthy cells classification.13 For the detection of these cells, the label-free setup has been utilized, and no external labels, markers, or tags are used to identify cells. The implementation of the multi-layer perceptron (MLP), convolutional neural network (CNN), fully convolutional network (FCN), ResNet, Inception, and Multi-channel deep CNN (MCDCNN) has been done for classifying the cell lines, namely, HeLa, MDA-MB-231, LCLC103H, MCF-7, which identified that each model achieves an accuracy between 70-80%. The authors developed a hybrid model for classifying HeLa cells, which had three classes, namely C1, C2, and C3, corresponding to background, unclear, and sharp cells.14 These three models, namely Inception-U-Net, ResNet34-U-Net, and VGG19-U-Net techniques, were provided with the 650 cell lines images. In this hybrid technique, the U-Net has been used for segmentation, where the change has been performed on the encoder part by replacing it with VGG19, ResNet34, and Inception models. The model was trained for 200 epochs, where the learning rate and batch sizes were set to 0.001 and 8, The authors developed an AI-based Cellpose technique for HeLa-FUCCI cell classification. respectively.15 The dataset contains 37,000 images having red/green and contrasted images of cell lines. The segmentation is performed with UNet architecture, for extracting saturated cells, contaminated cells, and edges from the images. The authors developed a cell classification model by utilizing a deep neural networks (DNN) model.16 The dataset has 10,696 images of HAPI, HeLa, K562, and GM12878 classes. The finding is the model shows an accuracy of 96.9% and an AUC of 0.95. The authors utilized a random forest (RF) model for the prediction of 3D MCF7 microtissues.17 This model was developed using 955 samples, out of which 450 essential features were extracted, and regrouping was performed. The work focused more on image processing, where contrast enhancement was the first step, followed by binarization and morphological closing, and finally, the microtissues classification was performed. Table. 1 tabulates the summary of the existing cancer cell classification models.
Table 1: A detailed summary of the cancer cell classification techniques
|
Ref. |
Model |
Dataset |
Accuracy |
Future Scope |
|
13 |
CNN, FCN, ResNet, Inception, MCDCNN |
>4500 single cell images |
70-80% |
Though the authors have provided the dataset for multiple classes, the classification has been done for binary classes. |
|
14 |
U-Net, Inception-U-Net, ResNet34-U-Net, and VGG19-U-Net |
650 images |
U-Net: 98.69%, Inception-U-Ne: 99.04%, ResNet34-U-Net: 99.09%, VGG19-U-Net: 98.65% |
The authors implemented the model on a very large value of epochs and have utilized a small value of batch size, which may require high computational time to effectively train the model. |
|
18 |
AI-based cellulose model |
37,000 images |
True positive rate: Cellpose 1.0: 1245/1275, Cellpose 2.0: 1255/1275 |
The authors have not provided information on the hyperparameter configuration to propose the cellpose 1.0 and cellpose 2.0 models |
|
16 |
DNN-SCANN |
10,696 images |
96.9% |
The authors have used a DNN-based SCANN model in the proposed work. However, the detailed information on the model has not been provided. |
|
19 |
RF |
955 samples |
Not mentioned |
The authors have not provided thorough details of the proposed model architecture; instead, more focus was placed on the image processing step. |
Materials and Methods
This section discusses the dataset and the methodology used for the development of the proposed multiclass cancer cell line classification model.
Cell lines and culture
Two cell lines, MCF7, a human breast adenocarcinoma cell line, and HeLa, a human cervical adenocarcinoma cell line, were used in this study. The cells were gifted by Dr. Deepak Kumar at IMTECH, Chandigarh. Both the cell lines were cultured in MEM (E) with NEAA (HiMedia) supplemented with 10% Fetal Bovine Serum (HiMedia) and 1% antibiotic/antimycotic solution (HiMedia). They were separately seeded in a T-75 tissue culture flask (Corning) and maintained under standard culture conditions at 37°C with 5% CO2 using a previously described protocol.20–22 After seeding, the cells were allowed to attach, and images were taken at regular intervals.
Microscopy
Cell images were captured using an Olympus CKX53 inverted phase contrast microscope equipped with a 4000K colour temperature LED light source and MagCam DC 5MP camera. Once the cells were attached, the images were acquired for each cell line to create a primary dataset, taken at regular intervals, from a single cell attached (SCA) stage to different stages of confluency (fewer cells – LC, Sub-confluent – SC and Full confluent–FC). A magnification of 10 × was used, and each 24-bit image had dimensions of 2592 × 1944 pixels. At each stage, 50-100 images were clicked. Areas with floating cells and overcrowded cells, where cells overlapped, were excluded. Fig. 1 shows the image preparation phase.
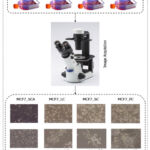 |
Figure 1: Workflow of the image preparation
|
Data preprocessing
The collected dataset has been divided into 8 different classes, namely, MCF7_SCA, MCF7_LC, MCF7_SC, MCF7_FC, HeLa_SCA, HeLa_LC, HeLa_SC, and HeLa_FC. The initial 4 classes belong to different stages of Michigan Cancer Foundation-7, and the remaining classes have Henrietta Lacks cancer cell stages. This dataset contained a limited number of images, which have been further augmented to increase the size of the dataset to achieve improved and accurate classification outcomes. The augmentation methods include rotation, shift, shear, and flipping.
Table. 2 shows the original images and augmented images by applying the rotation_range, width_shift_range, height_shift_range, shear_range, and horizontal_flip operations.
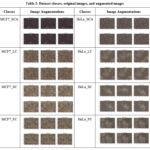 |
Table 2: Dataset classes, original images, and augmented images
|
Proposed Methodology
This section elaborates on the proposed methodology used for the classification of 8 different cancer cells.
The proposed work implements three different pre-trained DL models, namely, InceptionV3, MobileNetV2, and Xception models, for the classification of eight different cell lines. The MobileNetV2 model is a lightweight architecture containing depthwise convolutions, which significantly reduces the cost and parameters in comparison to other models, namely, VGG16, VGG19, etc. This model is efficient and works in resource-constrained conditions due to the reduction of complexity and dimensionality. The InceptionV3 is one of the most efficient DL techniques that has inception modules for extracting multi-scale information using parallelly processing of pooling and convolution layers, which reduces computational costs by factorising and dividing convolutions into small segments. The InceptionV3 model has an auxiliary classifier to reduce the vanishing gradient problem. Another pre-trained Xception model has also been used in the proposed work that contains an inception module with depthwise separable convolutions for enhancing the performance and efficiency of the model. Further, the depthwise convolutions result in decreased parameters. Three pre-trained models, namely, InceptionV3, Xception, and MobileNetV2, have been found to be more scalable, which has led to improved feature extraction capabilities.
The InceptionV3 model is made up of combined auxiliary classifiers, factorized convolutions, batch normalization, and average pooling, which have been shown in equations (1), (2), (3), and (4), respectively.
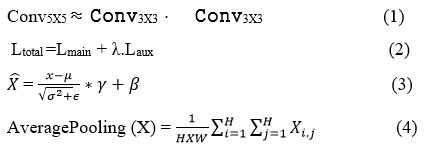
The composition of the layers to factorise the convolutions into smaller segments is shown in Equation (1), whereas Equation (2) shows the process of the auxiliary classifier. It handles the execution flow of the gradients during the training process. The batch normalization is shown in Equation (3), which enhances the speed and stabilises the model’s training. The global average pooling, as shown in Equation (4), reduces the overfitting.
The Xception model has various operations, namely, depthwise convolutions, pointwise convolutions, depthwise separable convolutions (DSC), residual connection, and bottlenecks, which have been provided in equations (5), (6), (7), (8), (9), respectively.
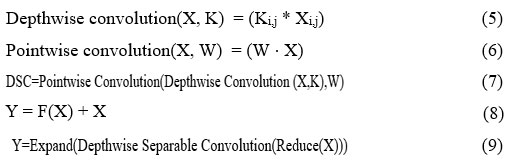
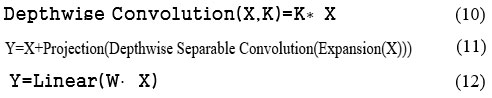
The depthwise convolution takes X as the input tensor, k as the kernel, and Ki,j are the filters applied to each channel. The pointwise convolution is used to mix the output, where X has been taken as the input tensor, and W is the filter. The DSC is used to reduce computational costs and parameters. Equation (8) defines the residual connection, where X shows the actual input, Y represents the output, and F(X) is the transformation to be applied to the input. The bottleneck has been used for dimensionality reduction, where X and Y are the input tensor and pointwise convolutions, respectively.
The lightweight MobileNetV2 model is also an efficient DL model that is used for fast communications in mobile vision and embedded applications. It has depthwise convolution, pointwise convolution, inverted residual block, and linear bottleneck. The depth-wise convolution is provided in equation (10), where X and K are the input tensor and kernel, respectively. Equation (6) represents the point-wise convolution, and equation (11) shows the inverted residual, where expansion(X) is utilised to enhance channels, and projection is used for dimensionality reduction. Equation (12) shows the linear bottleneck, depicting that the linear transformation has been performed to pass the output by performing ReLU activation.
These three models, namely, InceptionV3, Xception, and MobileNetV2, have been applied to classify 8 different cancer cell lines. The dataset has been prepared and supplied with augmentation methods to create an enhanced dataset for deep learning models to understand, resulting in improved outcomes. The augmented dataset has been pre-processed with the input image size of 299X299X3 for the InceptionV3 and Xception models and 224X224X3 for the MobileNetV2 model. The dataset has been divided into 80:20 for the training and testing phases. There are various hyperparameters that have been configured to train each model effectively. These hyperparameters include batch size, learning rate, epochs, etc. as shown in the Table. 3. The categorical_ cross-entropy function has been utilized to predict 8 different output classes. Further, each model was tested with the testing dataset, and the results were analyzed in terms of class-wise accuracy, recall, loss, precision, and F1-score. The methodology of the proposed model is shown in Fig. 2.
Table 3: The hyperparameter configuration of the proposed cancer cell line classification model
|
Hyperparameters |
Values |
Hyperparameters |
Values |
|
Batch Size |
16 |
Epochs |
50 |
|
Learning Rate |
0.001 |
Optimizer |
Adam |
|
Activation Function |
ReLU |
Train-Test Split |
80:20 |
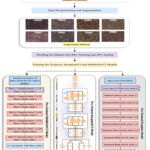 |
Figure 2: Proposed methodology for cancer cell line classification.
|
Results
This section elaborates on the cancer cell classification outcomes achieved using pre-trained MobileNetV2, InceptionV3, and Xception models with and without augmented images.
Results achieved by pre-trained models
This section elaborates on the findings of the pre-trained MobileNetV2, InceptionV3, and Xception models. These pre-trained models have been trained with the original dataset having 4 different classes of HeLa and MCF7.
Results achieved pre-trained MobileNetV2 model
The results of the pre-trained MobileNetV2 model for cancer cell classification have been discussed in this section.
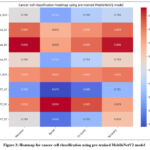 |
Figure 3: Heatmap for cancer cell classification using pre-trained MobileNetV2 model
|
Fig. 3 represents the heatmap of the pre-trained MobileNetV2 classification model. The results have been shown as the recall of 0.89, precision of 0.890, F1-score of 0.869, and accuracy of 0.886 in HeLa_SC, MCF7_SC, MCF7_SC, and HeLa_SC, respectively.
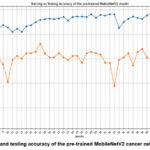 |
Figure 4: Training and testing accuracy of the pre-trained MobileNetV2 cancer cell classification model
|
Fig. 4 shows the training and testing accuracy of the pre-trained MobileNetV2 cancer cell classification model, where the highest accuracy has been achieved at epoch 17.
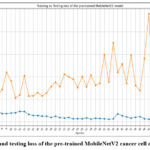 |
Figure 5: Training and testing loss of the pre-trained MobileNetV2 cancer cell classification model
|
Fig. 5 depicts the loss of the pre-trained MobileNetV2 cancer cell classification model, where the highest loss has resulted at epoch 41 at testing and 1 at the training phase.
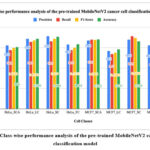 |
Figure 6: Class-wise performance analysis of the pre-trained MobileNetV2 cancer cells classification model
|
Fig. 6 shows the class-wise performance analysis of the pre-trained MobileNetV2 cancer cells classification model. The graph depicts that the highest accuracy has been achieved by Hela_SC as 88.6%, whereas the lowest value of accuracy has been identified with class MCF7_LC.
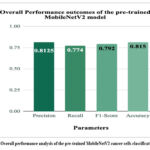 |
Figure 7: Overall performance analysis of the pre-trained MobileNetV2 cancer cells classification model
|
Fig. 7 depicts the overall performance analysis of the pre-trained MobileNetV2 cancer cells classification model. The highest value of accuracy was 81.5%, whereas precision, recall, and F1-score were 0.8125, 0.774, and 0.792, respectively.
Results achieved pre-trained InceptionV3 model
The results of the pre-trained InceptionV3 model for cancer cell classification have been discussed in this section. This section shows the class-wise and overall performance prediction outcomes of the InceptionV3 model.
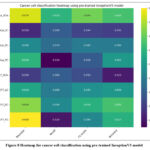 |
Figure 8: Heatmap for cancer cell classification using pre-trained InceptionV3 model
|
Fig. 8 depicts the heatmap for cancer cell classification using a pre-trained InceptionV3 model. The highest accuracy was achieved in the Hela_SCA and MCF7_SC classes at 63%. The accuracy obtained by this model is less in comparison to the pre-trained MobileNetV2 model.
Fig. 9 shows the accuracy of the pre-trained InceptionV3 cancer cell classification model. The highest training accuracy at epoch 40 and the highest testing accuracy at epoch 49 have resulted in 62.32% and 63.01%, respectively.
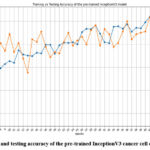 |
Figure 9: Training and testing accuracy of the pre-trained InceptionV3 cancer cell classification model
|
Fig. 10 shows the training and testing loss of the pre-trained InceptionV3 cancer cell classification model. The minimum training and testing loss have been identified at epochs 50 and 49, respectively.
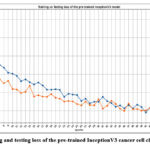 |
Figure 10: Training and testing loss of the pre-trained InceptionV3 cancer cell classification model.
|
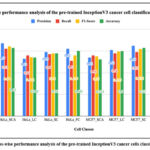 |
Figure 11: Class-wise performance analysis of the pre-trained InceptionV3 cancer cells classification model
|
Fig. 11 shows the class-wise performance analysis of the pre-trained InceptionV3 cancer cells classification model. The highest accuracy resulted with class HeLaSCA and MCF7_SC as 63%, whereas the minimum accuracy resulted with class HeLa_LC was 54.1%.
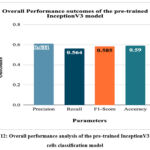 |
Figure 12: Overall performance analysis of the pre-trained InceptionV3 cancer cells classification model
|
Fig. 12 represents the overall performance of the pre-trained InceptionV3 cancer cells classification model. The highest accuracy of 59% has been achieved by the model, which is less in comparison to the overall classification accuracy resulting from the pre-trained MobileNetV2 model.
Results achieved by pre-trained Xception model
The results of the pre-trained InceptionV3 model for cancer cell classification have been discussed in this section. This section shows the class-wise and overall performance prediction outcomes of the InceptionV3 model.
Fig. 13 represents the heatmap for cancer cell classification using the pre-trained Xception model. The highest accuracy of MCF7_FC was 82.4%, whereas the lowest accuracy of 74.2% was resulted for class MCF7_LC.
 |
Figure 13: Heatmap for cancer cell classification using a pre-trained Xception model
|
Fig. 14 represents the training and testing accuracy of the pre-trained Xception cancer cell classification model. The highest training accuracy of 100% resulted in epochs 39, 40, and 41, whereas the testing accuracy of 83.24% resulted in 37 and 39.
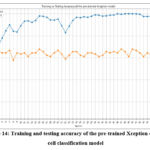 |
Figure 14: Training and testing accuracy of the pre-trained Xception cancer cell classification model.
|
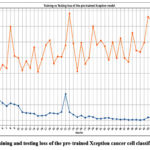 |
Figure 15: Training and testing loss of the pre-trained Xception cancer cell classification model.
|
Fig. 15 represents the training and testing loss of the pre-trained Xception cancer cell classification model. The highest training loss of 1.221 was obtained at epoch 1, and the lowest training loss was identified in epoch 41. Further, the highest and lowest testing losses have also been identified at 23 and 2 epochs, respectively.
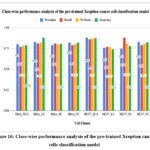 |
Figure 16: Class-wise performance analysis of the pre-trained Xception cancer cells classification model.
|
Fig. 16 shows the class-wise performance analysis of the pre-trained Xception cancer cells classification model. The highest accuracy was predicted by the HeLa_LC class, whereas the lowest accuracy, 74.2%, was predicted by the MCF7_LC class.
Fig. 17 shows the overall performance analysis of the pre-trained Xception cancer cells classification model. The highest accuracy, precision, recall, and F1-score of the model have been identified as 81.5%, 0.82, 0.81, and 0.82, respectively.
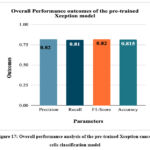 |
Figure 17: Overall performance analysis of the pre-trained Xception cancer cells classification model.
|
Results achieved by pre-trained models with augmented dataset
This section discusses the classification outcomes achieved using pre-trained MobileNetV2, InceptionV3, and Xception models. These models have been trained using the augmented dataset having 4 different categories of HeLa and MCF7.
Results achieved by pre-trained MobileNetV2 model with augmented data
The results of the pre-trained MobileNetV2 model for cancer cell classification using an augmented dataset have been discussed in this section. This section shows the class-wise and overall performance prediction outcomes of the MobileNetV2 model.
Fig. 18 depicts the heatmap for cancer cell classification using a pre-trained MobileNetV2 model with augmented. The class-wise performance analysis has been depicted, where the highest precision of 0.981, recall of 0.964, and F1-score of 0.972 have been identified with MCF7_SCA and accuracy of 97.5% with MCF7_SC.
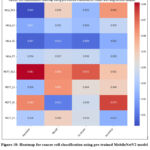 |
Figure 18: Heatmap for cancer cell classification using pre-trained MobileNetV2 model with augmented dataset.
|
Fig. 19 shows the training and testing accuracy of the pre-trained MobileNetV2 cancer cell classification model with the augmented dataset. The highest training accuracy and testing accuracy of 98.33% and 96.14% have resulted in epochs 37 and 47, respectively.
Fig. 20 represents the training and testing loss of the pre-trained MobileNetV2 cancer cell classification model with the augmented dataset. The highest loss of the model has been identified at epoch 1 for the training set and epochs 2 and 40 for the test set.
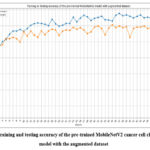 |
Figure 19: Training and testing accuracy of the pre-trained MobileNetV2 cancer cell classification model with the augmented dataset.
|
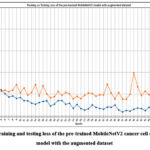 |
Figure 20: Training and testing loss of the pre-trained MobileNetV2 cancer cell classification model with the augmented dataset.
|
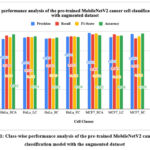 |
Figure 21: Class-wise performance analysis of the pre-trained MobileNetV2 cancer cells classification model with the augmented dataset.
|
Fig. 21 depicts the class-wise performance analysis of the pre-trained MobileNetV2 cancer cells classification model with the augmented dataset. The highest accuracy of 97.5% and lowest accuracy of 92.2% have resulted in classes MCF7_SC and HeLa_SC, respectively.
Fig. 22 depicts the overall performance analysis of the pre-trained MobileNetV2 cancer cells classification model with the augmented dataset. The highest accuracy, precision, recall, and F1-score of the model have been resulted as 94.3%, 0.933, 0.939, and 0.936, respectively.
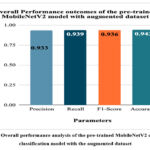 |
Figure 22: Overall performance analysis of the pre-trained MobileNetV2 cancer cells classification model with the augmented dataset.
|
The results of the pre-trained InceptinV3 model for cancer cell classification using an augmented dataset have been discussed in this section. This section shows the class-wise and overall performance prediction outcomes of the InceptinV3 model.
Fig. 23 shows the heatmap for cancer cell classification using a pre-trained InceptionV3 model with the augmented dataset. The highest precision with class HeLa_LC was 0.89, recall of 0.81 with HeLa_LC, F1-score of 0.848 with HeLa_LC, and highest accuracy with HeLa_SC as 80.1%.
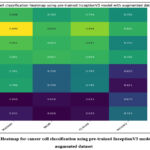 |
Figure 23: Heatmap for cancer cell classification using pre-trained InceptionV3 model with the augmented dataset.
|
Fig. 24 shows the training and testing accuracy of the pre-trained InceptionV3 cancer cell classification model with the augmented dataset. The highest training and testing accuracies have resulted at epoch 46 and epoch 48, as 0.741 and 0.752, respectively.
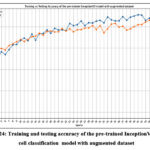 |
Figure 24: Training and testing accuracy of the pre-trained InceptionV3 cancer cell classification model with augmented dataset.
|
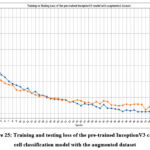 |
Figure 25: Training and testing loss of the pre-trained InceptionV3 cancer cell classification model with the augmented dataset.
|
Fig. 25 shows the training and testing loss of the pre-trained InceptionV3 cancer cell classification model with the augmented dataset. The lowest loss at the training phase and testing phase have been identified at epochs 50 and epoch 43, respectively.
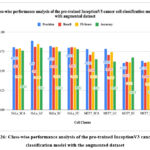 |
Figure 26: Class-wise performance analysis of the pre-trained InceptionV3 cancer cells classification model with the augmented dataset.
|
Fig. 26 shows the class-wise performance analysis of the pre-trained InceptionV3 cancer cells classification model with the augmented dataset. The highest accuracy of HeLa_FC was 78.2%, whereas the lowest accuracy of 62.1% was resulted with class MCF7_LC.
Fig. 27 depicts the overall performance analysis of the pre-trained InceptionV3 cancer cells classification model with the augmented dataset. The highest accuracy, precision, recall, and F1-score resulted by the model were 66.84%, 0.6409, 0.6929, and 0.672, respectively.
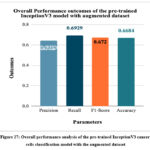 |
Figure 27: Overall performance analysis of the pre-trained InceptionV3 cancer cells classification model with the augmented dataset.
|
Results achieved by pre-trained Xception model with augmented data
The results of the pre-trained Xception model for cancer cell classification using an augmented dataset have been discussed in this section. This section shows the class-wise and overall performance prediction outcomes of the Xception model.
Fig. 28 shows the heatmap for cancer cell classification using pre-trained Xception model with the augmented dataset. The highest precision of 0.97 with HeLa_SC, recall of MCF7_SC, F1-score of HeLa_LC, and accuracy of 91.1% have been resulted with HeLa_SC.
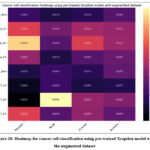 |
Figure 28: Heatmap for cancer cell classification using pre-trained Xception model with the augmented dataset.
|
Fig. 29 depicts the training and testing accuracy of the pre-trained Xception cancer cell classification model with the augmented dataset. The highest training accuracy of 0.981 has been resulted at epoch 47, whereas the highest testing accuracy of 98.99% has been achieved at epoch 47.
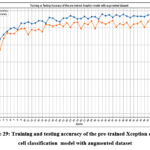 |
Figure 29: Training and testing accuracy of the pre-trained Xception cancer cell classification model with augmented dataset.
|
Fig. 30 shows the training and testing loss of the pre-trained Xception cancer cell classification model with the augmented dataset. The minimum train and testing loss have been resulted at epochs 47 and 31, respectively.
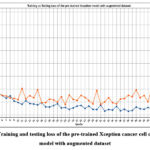 |
Figure 30: Training and testing loss of the pre-trained Xception cancer cell classification model with augmented dataset.
|
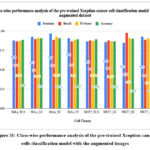 |
Figure 31: Class-wise performance analysis of the pre-trained Xception cancer cells classification model with the augmented images.
|
Fig. 31 shows class-wise performance analysis of the pre-trained Xception cancer cells classification model with the augmented images. The highest accuracy of 91% has been resulted with HeLa_LC, whereas the lowest accuracy was identified for the MCF7_LC class as 0.872.
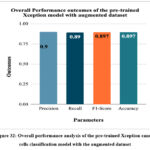 |
Figure 32: Overall performance analysis of the pre-trained Xception cancer cells classification model with the augmented dataset.
|
Fig. 32 depicts the overall performance analysis of the pre-trained Xception cancer cells classification model with the augmented dataset. The highest accuracy, recall, precision, and F1-score have been resulted as 89.7%, 0.89, 0.9, and 0.897, respectively.
Discussion
This section compares the performance of the pre-trained MobileNetV2, Xception, and InceptionV3 with augmented and without augmented datasets.
Fig. 33 depicts the comparative analysis of the results obtained by the pre-trained MobileNetV2, Xception, and InceptionV3 with augmented and without augmented datasets. The analysis shows that the MobileNetV2 model outperforms in both augmented and non-augmented datasets by resulting in 94.3% and 81.5% accuracy, respectively.
These results show that the augmented data improves the performance of the pre-trained models and generalizes better outcomes on unseen datasets. The performance comparison of the pre-trained models with and without augmentation is evident that the augmented dataset outperforms and improves the accuracy. These outcomes achieved with the augmented dataset not only improve the accuracy, precision, recall, and F1-score but also balance the true positives and reduce false negatives/ positives.
Further, the model comparison also shows that the MobileNetV2 outperforms by showing the highest accuracy of 94.3%, resulting it in capturing patterns while reducing the error rate. This architecture is lightweight and suitable for predictions where high computational efficiency is needed along with better outcomes. In addition, the Xception model also performs better and represents an accuracy of 89.7% with the augmented dataset. Lastly, the outcome of InceptionV3 shows an accuracy of 66.84% with the augmented dataset, resulting in poor generalization of the results. The accuracy shows that the InceptionV3 model struggles in terms of varied and complex datasets, and the architecture may be less suitable for predictions that require high recall and precision.
Data augmentation is a powerful technique for generalizing better performance. In the comparison of the pre-trained models, it has been analyzed that the MobileNetV2 model provides the most effective outcomes with augmentation offering better accuracy for cancer cell classification. Further, Xception has also resulted as one of the strong contenders for the MobileNetV2 model, resulting in improved performance in comparison to InceptionV3.
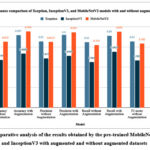 |
Figure 33: Comparative analysis of the results obtained by the pre-trained MobileNetV2, Xception, and InceptionV3 with augmented and without augmented datasets.
|
Conclusion
The proposed work utilizes three pre-trained DL models, namely, Xception, InceptionV3, and MobileNetV2, for breast cancer cell classification. These models reduce the time complexity of the manual classification and handle the multidimensionality of the biological datasets. The pre-trained models were trained using an actual and augmented cancer cell line dataset created in the Centre for In Vitro Studies and Translational Research laboratory, and the best performance was achieved with the MobileNetV2+ augmented dataset, obtaining 94.3% accuracy. This model is lightweight and works efficiently in constrained environments, and also enhances its practical utility. The results achieved in the proposed work show the most prominent and promising method for clinical applications, including breast cancer cell classification in real-time in vitro labs.
Acknowledgement
The authors of this work are thankful to the Centre for In Vitro Studies and Translational Research, Chitkara University, Punjab, for providing the dataset for this research.
Funding Source
The author(s) received no financial support for the research, authorship, and/or publication of this article.
Conflict of Interest
The author(s) do not have any conflict of interest.
Data Availability
The dataset can be made available on a reasonable request from the corresponding author.
Ethics Statement
This research did not involve human participants, animal subjects, or any material that requires ethical approval.
Informed Consent Statement
This study did not involve human participants, and therefore, informed consent was not required.
Clinical Trial Registration
This research does not involve any clinical trials.
Permission to reproduce material from other sources
Not Applicable
Author contributions:
- Conceptualization: Shagun Sharma, Kalpna Guleria; Methodology: Shagun Sharma, Kalpna Guleria; Software: Shagun Sharma, Kalpna Guleria, Ayush Dogra;
- Data curation: Satyam Kumar Agrawal, Monika Sharma;
- Formal Analysis: Shagun Sharma, Kalpna Guleria, Ayush Dogra, Satyam Kumar Agrawal;
- Validation: Shagun Sharma, Kalpna Guleria, Ayush Dogra, Satyam Kumar Agrawal;
- Investigation: Shagun Sharma, Kalpna Guleria, Ayush Dogra;
- Writing—original draft preparation: Shagun Sharma;
- Writing—Review and editing: Kalpna Guleria, Ayush Dogra, Satyam Kumar Agrawal;
- Supervision: Kalpna Guleria;
Reference
- Kandaswamy C, Silva LM, Alexandre LA, Santos JM. High-Content Analysis of Breast Cancer Using Single-Cell Deep Transfer Learning. J Biomol Screen. 2016;21(3):252-259.
CrossRef - Wang Z, Zhu X, Li A, Wang Y, Meng G, Wang M. Global and local attentional feature alignment for domain adaptive nuclei detection in histopathology images. Artif Intell Med. 2022;132:102341.
CrossRef - Piansaddhayanon C, Koracharkornradt C, Laosaengpha N, et al. Label-free tumor cells classification using deep learning and high-content imaging. Sci Data. 2023;10(1):570.
CrossRef - Liao M, Di S, Zhao Y, Liang W, Yang Z. FA-Net: A hierarchical feature fusion and interactive attention-based network for dose prediction in liver cancer patients. Artif Intell Med. 2024;156:102961.
CrossRef - Berryman S, Matthews K, Lee JH, Duffy SP, Ma H. Image-based phenotyping of disaggregated cells using deep learning. Commun Biol. 2020;3(1):674.
CrossRef - Mzurikwao D, Khan MU, Samuel OW, et al. Towards image-based cancer cell lines authentication using deep neural networks. Sci Rep. 2020;10(1):19857.
CrossRef - Subramanian V, Syeda-Mahmood T, Do MN. Modelling-based joint embedding of histology and genomics using canonical correlation analysis for breast cancer survival prediction. Artif Intell Med. 2024;149:102787.
CrossRef - Karabağ C, Jones ML, Peddie CJ, Weston AE, Collinson LM, Reyes-Aldasoro CC. Semantic segmentation of HeLa cells: An objective comparison between one traditional algorithm and four deep-learning architectures. PLoS One. 2020;15(10):e0230605.
CrossRef - Alizadeh E, Castle J, Quirk A, Taylor CDL, Xu W, Prasad A. Cellular morphological features are predictive markers of cancer cell state. Comput Biol Med. 2020;126:104044.
CrossRef - Pattarone G, Acion L, Simian M, Mertelsmann R, Follo M, Iarussi E. Learning deep features for dead and living breast cancer cell classification without staining. Sci Rep. 2021;11(1):10304.
CrossRef - Wang H, Li Y, Khan SA, Luo Y. Prediction of breast cancer distant recurrence using natural language processing and knowledge-guided convolutional neural network. Artif Intell Med. 2020;110:101977.
CrossRef - Sharma S, Guleria K. A comprehensive review on federated learning based models for healthcare applications. Artif Intell Med. 2023;146(102691):102691.
CrossRef - Kovacs KD, Beres B, Kanyo N, et al. Single-cell classification based on label-free high-resolution optical data of cell adhesion kinetics. Sci Rep. 2024;14(1):11231.
CrossRef - Ghaznavi A, Rychtáriková R, Císař P, Ziaei MM, Štys D. Symmetry breaking in the U-Net: Hybrid deep-learning multi-class segmentation of HeLa cells in reflected light microscopy images. Symmetry . 2024;16(2):227.
CrossRef - Cheraghi H, Kovács KD, Székács I, Horvath R, Szabó B. Continuous distribution of cancer cells in the cell cycle unveiled by AI-segmented imaging of 37,000 HeLa FUCCI cells. Heliyon. 2024;10(9):e30239.
CrossRef - Zhou B, Liu Q, Wang M, Wu H. Deep neural network models for cell type prediction based on single-cell Hi-C data. BMC Genomics. 2024;22(Suppl 5):922.
CrossRef - Li H, Seada H, Madnick S, et al. Machine learning-assisted high-content imaging analysis of 3D MCF7 microtissues for estrogenic effect prediction. Sci Rep. 2024;14(1):2999.
CrossRef - Cheraghi H, Kovács KD, Székács I, Horvath R, Szabó B. Continuous distribution of cancer cells in the cell cycle unveiled by AI-segmented imaging of 37,000 HeLa FUCCI cells. Heliyon. 2024;10(9):e30239.
CrossRef - Li H, Seada H, Madnick S, et al. Machine learning-assisted high-content imaging analysis of 3D MCF7 microtissues for estrogenic effect prediction. Sci Rep. 2024;14(1):2999.
CrossRef - Agrawal M, Saxena AK, Agrawal SK. Essential oil from Ocimum carnosum induces ROS mediated mitochondrial dysfunction and intrinsic apoptosis in HL-60 cells. Toxicol In Vitro. 2025;104:105988.
CrossRef - Agrawal SK, Agrawal M, Sharma PR, et al. Induces Apoptosis in HL-60 Cells Through ROS-Mediated Mitochondrial Pathway. Nutr Cancer. 2021;73(11-12):2720-2731.
CrossRef - Agrawal M, Saxena AK, Agrawal SK. Essential oil from Ocimum carnosum induces ROS mediated mitochondrial dysfunction and intrinsic apoptosis in HL-60 cells. Toxicol In Vitro. 2025;104:105988.
CrossRef

