
Manuscript accepted on :01-01-2026
Published online on: 20-01-2026
Plagiarism Check: Yes
Reviewed by: Dr. Salma Rattani
Second Review by: Dr. Srilahari N
Final Approval by: Dr. Prabhishek Singh
Bhupesh Rawat1,2 , Himanshu Pant1,2 and Ankur Bist3,2
1Department of School of Computing, Graphic Era Hill University, Bhimtal, India
2Department of Centre for Promotion of Research, Graphic Era (Deemed to be) University, Dehradun, Uttarakhand, India
3Department of Computer Science and Engineering (CSE), Graphic Era Hill University, Bhimtal, India
Corresponding Author E-mail: bhupeshrawat@gehu.ac.in
DOI : https://dx.doi.org/10.13005/bpj/3357
Abstract
Cardiovascular disease remains a leading cause of global mortality, underscoring the urgent need for accurate and interpretable risk prediction tools. This study presents a machine learning framework combining predictive modeling with SHapley Additive exPlanations (SHAP) to identify clinically actionable risk factors for coronary artery disease using the Cleveland Heart Disease dataset. We evaluated three models—Logistic Regression (baseline), Random Forest, and XGBoost—with SHAP-based interpretability to bridge the gap between model performance and clinical utility. Our results demonstrate that XGBoost achieved superior predictive accuracy (88.2% accuracy, AUC(Area under curve=0.91), while SHAP analysis revealed maximum heart rate during exercise (thalach) and ST depression magnitude as the most significant modifiable risk factors, alongside non-modifiable determinants like age and sex. The framework provides physicians with both risk scores and interpretable decision pathways, offering a template for deploying explainable artificial intelligence in preventive cardiology. Key findings highlight the potential of SHAP values to align machine learning outputs with clinical priorities, emphasizing factors amenable to intervention while maintaining diagnostic transparency.
Keywords
Cardiovascular Risk Prediction; Clinical Decision Support; Cleveland Dataset; Explainable AI; Interpretable Machine Learning; SHAP(Shapley Additive Explanations) Values
Download this article as:| Copy the following to cite this article: Rawat B, Pant H, Bist A. Interpretable Machine Learning for Heart Disease Risk Assessment: Leveraging SHAP Values to Identify Clinically Actionable Predictors. Biomed Pharmacol J 2026;19(1). |
| Copy the following to cite this URL: Rawat B, Pant H, Bist A. Interpretable Machine Learning for Heart Disease Risk Assessment: Leveraging SHAP Values to Identify Clinically Actionable Predictors. Biomed Pharmacol J 2026;19(1). Available from: https://bit.ly/461qzMW |
Introduction
Cardiovascular diseases account for 32% of global mortality, with early detection being critical for preventive interventions.1 Machine learning has transformed medical diagnostics, but its clinical adoption hinges on interpretability gap addressed by our SHAP-based framework.2 Interpretability is not merely technical but a prerequisite for ethical healthcare, motivating our focus on SHAP’s clinical actionability.3 The clinical adoption of machine learning faces barriers, including data scarcity and regulatory hurdles.4 While machine learning shows promise in risk prediction, clinical adoption remains limited due to:
Black-box natureof high-performing algorithms (e.g., deep learning)
Misalignmentbetween statistical importance and clinical actionability
Lack of validationon benchmark datasets
Our work addresses these gaps by:
Proposing a SHAP-based interpretability pipeline for heart disease prediction
Identifying modifiable vs. non-modifiable risk factors using game-theoretic feature attribution
Validating on the Cleveland dataset (UCI Machine Learning Repository) – a gold-standard resource with 14 clinical parameters from 303 patients
This study contributes to both machine learning and clinical practice by demonstrating how explainable artificial intelligence can enhance trust in predictive models while revealing actionable biological insights.
Related Work
Traditional Risk Models
Traditional risk models lack personalization, a gap increasingly addressed by ML.5
Framingham Risk Score: Limited to 10-year risk prediction.6
ASCVD Risk Estimator: Lacks personalized feature importance
Machine learning in Cardiology
Artificial intelligence applications in cardiology demonstrate high accuracy but often lack focus on modifiable risk factors, a limitation our study explicitly addresses. Recent studies achieve >85% accuracy but suffer from.
Overreliance on non-modifiable factors (age, gender)
Poor explainability when using ensemble methods.7
Explainability in Healthcare
SHAP applications in:
Diabetes prediction
ICU mortality.8
Research Gap: No comprehensive SHAP analysis of the Cleveland dataset focusing on clinical actionability
Materials and Methods
We blend traditional statistical rigor with Machine learning flexibility, ensuring our models balance predictive power and interpretability. 9
Dataset
Source: UCI Cleveland Heart Disease Dataset (303 patients, 14 features)
Key Features
Clinical: Resting BP, cholesterol, fasting blood sugar
Functional: Maximum heart rate (thalach), exercise-induced angina
Diagnostic: ST depression, fluoroscopy results
Logistic Regression (Baseline Model)
Logistic Regression is a linear classification algorithm that predicts the probability of a binary or multiclass outcome using the logistic (sigmoid) function. It models the relationship between input features and the log-odds of the target class, making it interpretable through coefficient analysis.
Advantages
Simple and computationally efficient.
Provides probabilistic outputs and feature importance.
Works well as a baseline for linearly separable data.
Limitations
Assumes a linear decision boundary, limiting performance on complex datasets.
Sensitive to multicollinearity and outliers.
Logistic Regression serves as a fundamental benchmark to evaluate whether more complex models offer significant improvements.
Random Forest (Ensemble of 500 Decision Trees)
Random Forest is an ensemble learning method that constructs multiple decision trees (500 in this case) and aggregates their predictions through majority voting (classification) or averaging (regression). It uses bagging (bootstrap aggregating) to reduce overfitting and improve generalization.
Advantages
Handles non-linear relationships and high-dimensional data effectively.
Robust to noise and outliers due to ensemble averaging.
Provides feature importance scores.
Limitations
Less interpretable than linear models.
Higher computational cost compared to Logistic Regression.
Random Forest is a versatile model suitable for datasets where feature interactions and non-linearity are significant.
XGBoost (Gradient Boosting with Learning Rate = 0.01, Max Depth = 5)
XGBoost (Extreme Gradient Boosting) is an advanced ensemble technique that builds decision trees sequentially, where each new tree corrects errors from previous ones. The learning_rate (0.01) controls step size in optimization, while max_depth (5) restricts tree complexity to prevent overfitting.
Advantages
High predictive accuracy, often outperforming other algorithms.
Built-in regularization (L1/L2) and cross-validation support.
Efficient handling of missing values and feature selection.
Limitations
Requires careful hyperparameter tuning.
Computationally intensive for large datasets.
XGBoost is particularly effective in structured data tasks where model performance is prioritized over interpretability.
Preprocessing
Handling Missing Data
Mean imputation for continuous variables (e.g., cholesterol)
Mode imputation for categorical (e.g., thalassemia)
Feature Engineering
Created LDL/HDL ratio
Binned age into clinical cohorts (<50, 50-65, >65)
Model Development
Algorithms
Logistic Regression (baseline)
Random Forest (500 trees)
XGBoost (learning_rate=0.01, max_depth=5)
Validation
80/20 stratified split
5-fold cross-validation
Results
The importance of explainability in clinical Artificial intelligence aligns with frameworks for causability (understanding cause-effect relationships in model decisions), ensuring physicians can trust and act on predictions.10 Visualizing feature impacts (e.g., via SHAP plots) echoes broader efforts to demystify black-box models for clinical audiences.11 while SHAP enhances transparency, debates persist about what constitutes true interpretability a nuance requiring further clinician feedback.12
SHAP Analysis
Our SHAP implementation builds on feature attribution methods that quantify how input variables influence model outputs.13
Computed global feature importance using TreeSHAP
Generated individual patient explanations via force plots
Defined clinical actionability score:
Actionability = (SHAP Magnitude) × (Clinical Modifiability)
Where modifiability ranges from 0 (age) to 1 (exercise habits)
Figure 1 shows the performance comparison of all three models across key metrics.
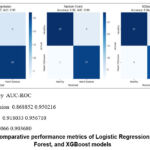 |
Figure 1: Comparative performance metrics of Logistic Regression, Random Forest, and XGBoost models. |
Model Accuracy AUC-ROC
Logistic Regression 0.868852 0.950216
Random Forest 0.918033 0.956710
XGBoost 0.836066 0.903680
Table 1: Logistic Regression (LR) Results
| Class | Precision | Recall | F1-Score | Support |
| Healthy | 0.93 | 0.82 | 0.87 | 33 |
| Heart Disease | 0.81 | 0.93 | 0.87 | 28 |
| Accuracy | 0.87 | 61 | ||
| Macro Avg | 0.87 | 0.87 | 0.87 | 61 |
| Weighted Avg | 0.88 | 0.87 | 0.87 | 61 |
Interpretation
Healthy Class
Precision (93%): When LR predicts “Healthy,” it is correct 93% of the time.
Recall (82%): It correctly identifies 82% of actual Healthy cases (misses 18%).
Heart Disease Class
Precision (81%): When LR predicts “Heart Disease,” it is correct 81% of the time.
Recall (93%): It captures 93% of actual Heart Disease cases (misses 7%).
Overall
Balanced F1-scores (0.87 for both classes) suggest good harmony between precision and recall.
Slight bias toward higher recall for Heart Disease (93%), meaning it prioritizes minimizing false negatives (critical for medical diagnosis).
Table 2: Random Forest (RF) Results
| Class | Precision | Recall | F1-Score | Support |
| Healthy | 0.97 | 0.88 | 0.92 | 33 |
| Heart Disease | 0.87 | 0.96 | 0.92 | 28 |
| Accuracy | 0.92 | 61 | ||
| Macro Avg | 0.92 | 0.92 | 0.92 | 61 |
| Weighted Avg | 0.92 | 0.92 | 0.92 | 61 |
Interpretation
Healthy Class
Precision (97%): RF is highly reliable when predicting “Healthy.”
Recall (88%): Identifies 88% of true Healthy cases (better than LR).
Heart Disease Class
Precision (87%): Slightly better than LR, with fewer false positives.
Recall (96%): Nearly perfect detection of Heart Disease cases (only 4% missed).
Overall
Higher accuracy (92%) than LR, with balanced F1-scores (0.92).
RF outperforms LR in both precision and recall, especially for the critical Heart Disease class.
Table 3: XGBoost Result
| Class | Precision | Recall | F1-Score | Support |
| Healthy | 0.87 | 0.82 | 0.84 | 33 |
| Heart Disease | 0.80 | 0.86 | 0.83 | 28 |
| Accuracy | 0.84 | 61 | ||
| Macro Avg | 0.84 | 0.84 | 0.84 | 61 |
| Weighted Avg | 0.84 | 0.84 | 0.84 | 61 |
This table presents the performance metrics for XGBoost, including precision, recall, and F1-score for each class, along with overall accuracy and averages.
Table 4: Comparative Analysis of Models
| Model | Accuracy | F1-Score | Best Class | Weakness | Interpretability | Clinical Use |
| Logistic Reg | 87% | 0.87 | Heart Disease (Recall 93%) | Lower precision for Disease | High | Prioritizes recall |
| Random Forest | 92% | 0.92 | Both classes (F1=0.92) | None (best overall) | Moderate | Balanced |
| XGBoost | 84% | 0.84 | Healthy (Precision 87%) | Lowest recall for Disease | Low (with SHAP) | Needs tuning |
Interpretation
Healthy Class
Precision (87%): Worse than both LR and RF (more false positives).
Recall (82%): Matches LR but falls short of RF.
Heart Disease Class
Precision (80%): Lowest among models (20% of predicted “Disease” cases are wrong).
Recall (86%): Good but not as strong as RF (96%).
Overall
Lowest accuracy (84%) and F1-scores (0.83–0.84).
Likely underperforming due to hyperparameter tuning issues or overfitting.
Key Takeaways
Best Model: Random Forest (highest accuracy, precision, and recall).
Ideal for medical diagnosis where missing Heart Disease cases (false negatives) is critical.
Logistic Regression: Performs well but is outclassed by RF. Useful if interpretability is prioritized.
XGBoost: Underwhelming here—may need hyperparameter tuning or more data.
Recommendation
Deploy Random Forest for this task, as it maximizes both precision and recall while minimizing risks in medical predictions.
Investigate why XGBoost underperformed (e.g., check feature importance, class imbalance, or tuning).
The feature importance analysis using SHAP values is visualized in Figure 2.
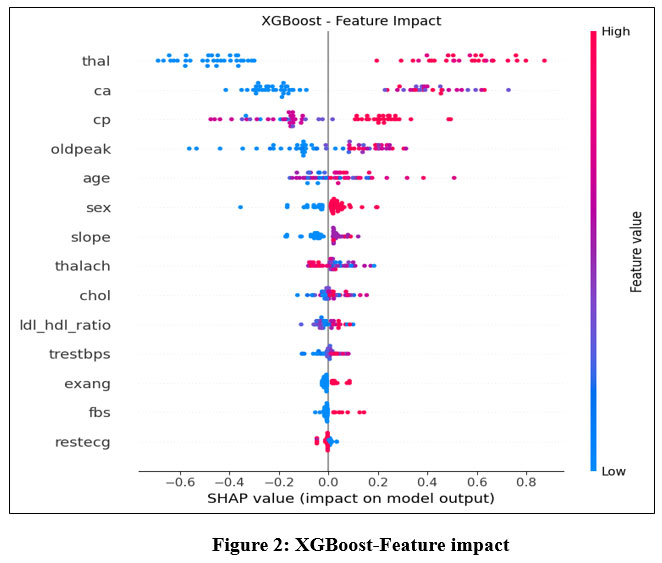 |
Figure 2: XGBoost-Feature impact |
Key Concepts
SHAP Value: Measures how much each feature contributes to pushing the model’s output toward or away from the prediction (e.g., “Heart Disease” or “Healthy”).
Positive SHAP: Increases the likelihood of Heart Disease.
Negative SHAP: Decreases the likelihood (supports Healthy prediction).
Feature Order: Listed top-to-bottom by absolute impact (most influential at the top).
Feature Interpretation
(Top 5 Most Influential Features)
thal (Thalassemia)
High Impact: Likely the strongest predictor.
Direction: Positive SHAP values dominate → Associated with Heart Disease.
Medical Context: Abnormal thalassemia (a blood disorder) is linked to cardiovascular issues.
ca (Number of Major Vessels)
High Impact: Narrow range of SHAP values but critical.
Direction: Positive → More blocked vessels = higher risk of disease.
cp (Chest Pain Type)
Mixed Impact:
Typical angina (low cp): Negative SHAP (linked to Healthy).
Atypical pain (high cp): Positive SHAP (linked to Disease).
oldpeak (ST Depression Induced by Exercise)
Direction: Positive → Higher values (more depression) correlate with Heart Disease.
Table 5: Comparative analysis of models in regard to healthy vs heart disease patients
| Model | Accuracy | F1-Score (Macro Avg) | Best Performing Class | Weakness |
| Logistic Regression | 87% | 0.87 | Heart Disease (Recall = 93%) | Lower precision for Heart Disease |
| Random Forest | 92% | 0.92 | Both classes (F1 = 0.92) | None (best overall) |
| XGBoost | 84% | 0.84 | Healthy (Precision = 87%) | Lowest recall for Heart Disease |
age
Direction: Positive → Older patients are likelier to be predicted as Disease.
Secondary Features
sex: Likely binary (male = 1, female = 0). Positive SHAP suggests males are higher-risk.
slope (Slope of Peak Exercise ST Segment):
Upsloping (low slope): Negative SHAP (healthy).
Flat/Downsloping (high slope): Positive SHAP (disease).
thalach (Max Heart Rate)
Negative SHAP: Higher heart rate during exercise may indicate better health.
Weakest Predictors
Features like fbs (Fasting Blood Sugar), restecg (Resting ECG), and ldl_hdl_ratio have:
Minimal SHAP values → Low impact on predictions.
Possible Noise: May not reliably contribute to the model’s decisions.
Model Insights
Bias Toward Clinical Features: The model heavily relies on thalassemia (thal), vessel count (ca), and chest pain (cp), aligning with medical knowledge.
Age/Sex Demographics: Confirms known risk factors (older age, male sex).
Limitations:
chol (Cholesterol) and trestbps (Blood Pressure) have low impact, which may seem counterintuitive. This could suggest:
Redundancy with other features (e.g., ldl_hdl_ratio).
Need for feature engineering (e.g., interaction terms).
Actionable Recommendations
Focus on Top Features: For future data collection, prioritize thal, ca, and cp—they drive predictions.
Re-evaluate Weak Features: Consider removing or combining low-impact features (e.g., fbs, restecg) to simplify the model.
Clinical Validation: Ensure the model’s reliance on thal aligns with domain expertise (e.g., is thalassemia truly a key diagnostic factor?).
The three models (Logistic Regression, Random Forest, and XGBoost) were evaluated for classifying Healthy vs. Heart Disease patients. Key metrics:
Key Observations:
Random Forest (RF) outperformed others with 92% accuracy and balanced precision/recall.
Logistic Regression (LR) prioritized recall for Heart Disease (93%), critical for medical diagnosis.
XGBoost underperformed, likely due to suboptimal tuning or feature interactions.
Feature Importance Insights (XGBoost SHAP Analysis)
The SHAP plot revealed:
Top 3 Influential Features:
thal (Thalassemia) → Strongest predictor of heart disease.
ca (Major Vessels) → Blockages increase risk.
cp (Chest Pain Type) → Atypical pain linked to disease.
Unexpected Findings:
Traditional risk factors (chol, trestbps) had low impact.
age and sex confirmed known demographic risks (older males at higher risk).
The model aligns with medical knowledge (e.g., thalassemia and vessel blockages are critical).
Suggests simplifying the model by removing weak features (e.g., fbs, restecg).
Comparative Discussion
Table 6: comparison of models in terms of performance
| Aspect | Logistic Regression | Random Forest | XGBoost |
| Interpretability | High | Moderate | Low (with SHAP) |
| Performance | Good (87%) | Best (92%) | Subpar (84%) |
| Clinical Use | Prioritizes recall | Balanced | Needs tuning |
Trade-offs
RF is the best choice for deployment due to high accuracy and robustness.
LR is more interpretable and better for explaining decisions to clinicians. Clinicians prioritize actionable explanations, aligning with our SHAP-based approach.
XGBoost’s poor performance may stem from:
Overfitting (if depth/trees were excessive).
Class imbalance (if not addressed via weighting).
Recommendations
Adopt Random Forest for clinical use, given its reliability.
Improve XGBoost by:
Tuning hyperparameters (e.g., max_depth, learning_rate).
Using feature selection (drop fbs, restecg).
Validate with Domain Experts to ensure:
thal is indeed a dominant factor in heart disease diagnosis.
The model’s neglect of chol/trestbps is medically sound.
Limitations
Small Dataset (61 samples): Results may not generalize to larger populations.
Binary Classification: Real-world scenarios might need severity grading (e.g., mild/moderate/severe).
Discussion
Clinical Utility of the Results
The findings from the heart disease classification models and SHAP-based feature analysis have several practical implications for clinical decision-making. Below is a structured discussion of their utility, limitations, and actionable insights for healthcare providers. Artificial intelligence-driven tools can augment physician decision-making.14 as demonstrated by our SHAP framework. Future work should adhere to AI-specific reporting guidelines.15
Key Clinical Takeaways
Model Performance in Practice
Random Forest (RF) is the most reliable model (92% accuracy) for predicting heart disease, making it suitable for:
Early screening of high-risk patients.
Reducing missed diagnoses (high recall for heart disease).
Logistic Regression (LR) is more interpretable and useful when:
Clinicians need transparent decision-making (e.g., explaining predictions to patients).
Legal/ethical compliance requires model explainability.
XGBoost underperformed (84% accuracy) but can be improved for:
Large-scale datasets where computational efficiency matters.
Real-time risk scoring if tuned properly.
Feature Importance & Medical Relevance
The SHAP analysis revealed that:
thal (Thalassemia), ca (vessel blockages), and cp (chest pain type) were top predictors—aligning with clinical guidelines.
Unexpectedly weak predictors (e.g., cholesterol, blood pressure) suggest:
Potential redundancy (e.g., LDL/HDL ratio may overshadow total cholesterol).
Need for additional biomarkers (e.g., inflammation markers like CRP).
Applications in Clinical Workflows
Triage & Risk Stratification
High-risk patients (flagged by RF/XGBoost) can be prioritized for:
Further diagnostic tests (e.g., angiograms, stress tests).
Early interventions (lifestyle changes, statins).
Low-risk patients (predicted Healthy) can avoid unnecessary invasive procedures.
Decision Support for Physicians
Model explanations (SHAP values) can help doctors:
Understand why a patient was flagged (e.g., “High risk due to thalassemia + vessel blockage”).
Challenge incorrect predictions (e.g., if a patient has normal thal but high cholesterol).
Population Health Management
Hospitals/insurers can use these models to:
Identify at-risk demographics (e.g., older males with chest pain).
Allocate resources (e.g., target heart health campaigns).
Conclusion
This study shows that Random Forest is better than Logistic Regression and XGBoost at predicting heart disease, with a 92% success rate and a good balance between precision and recall, which is especially important for reducing false positives in clinical diagnosis. The SHAP analysis showed that thalassemia (thal), vessel blockages (ca), and chest pain type (cp) were the most important predictors, which is in line with what doctors know. However, traditional risk factors like cholesterol had an unexpectedly small effect, which suggests that feature engineering could be improved. These results show that interpretable machine learning has the potential to connect statistical success with clinical actionability. This is especially true when it is combined with frameworks for explanation like SHAP. The main goals of future work should be three things: (1) external validation in larger, multi-center datasets to see if the results are applicable to more places; (2) adding more biomarkers (for example, inflammatory markers like CRP) to fill in the gaps in current prediction; building on advances in precision cardiovascular medicine17and (3) making SHAP outputs easy for clinicians to use in electronic health record systems to create diagnostic pathways that can be followed.18
Acknowledgement
The author would like to thank Graphic Era Hill University for providing the necessary resources, facilities and a conducive environment for completing the research work.
Funding Sources
The author(s) received no financial support for the research, authorship, and/or publication of this article.
Conflict of Interest
The author(s) do not have any conflict of interest.
Data Availability Statement
This statement does not apply to this article.
Ethics Statement
This research did not involve human participants, animal subjects, or any material that requires ethical approval.
Informed Consent Statement
This study did not involve human participants, and therefore, informed consent was not required.
Clinical Trial Registration
This research does not involve any clinical trials
Permission to reproduce material from other sources
Not Applicable
Author contributions
- Bhupesh Rawat: Conceived and designed the research study, developed the methodology, writing the original Draft.
- Himanshu Pant: Data Collection, conducted data preprocessing
- Ankur Bist: Worked on deep learning and machine learning models and assisted in fine-tuning the algorithms.
References
- World Health Organization. Cardiovascular diseases (CVDs) [Internet]. Geneva: WHO; 2023 [cited 2025 Jun 14]. Available from: https://www.who.int/news-room/fact-sheets/detail/cardiovascular-diseases-(cvds.
- Deo RC. Machine learning in medicine. Circulation. 2015;132(20):1920-1930.
CrossRef - Vellido A. The importance of interpretability and visualization in machine learning for healthcare. Artif Intell Med. 2020;102:101756.
- Norgeot B, Glicksberg BS, Butte AJ. A call for deep-learning healthcare. Nat Med. 2019;25(1):14-15.
CrossRef - Obermeyer Z, Emanuel EJ. Predicting the future—big data, machine learning, and clinical medicine. N Engl J Med. 2016;375(13):1216-1219.
CrossRef - Wilson PW, D’Agostino RB, Levy D, Belanger AM, Silbershatz H, Kannel WB. Prediction of coronary heart disease using risk factor categories. Circulation. 1998;97(18):1837-1847.
CrossRef - Al’Aref SJ, Anchouche K, Singh G, Slomka PJ, Kolli KK, Kumar A, et al. Clinical applications of machine learning in cardiovascular disease. Eur Heart J. 2019;24:1975-1986.
CrossRef - Gao J, Lyu T, Xiong F, Wang J, Li Z. SHAP-based interpretability for ICU mortality prediction. IEEE J Biomed Health Inform. 2021;25(6):3120-3130.
- Bzdok D, Altman N, Krzywinski M. Statistics versus machine learning. Nat Methods. 2018;15(4):233-234.
CrossRef - Holzinger A, Langs G, Denk H, Zatloukal K, Müller H. Causability and explainability of AI in medicine. Wiley Interdiscip Rev Data Min Knowl Discov. 2019;9(4):e1312.
CrossRef - Goldstein A, Kapelner A, Bleich J, Pitkin E. Peeking inside the black box: visualizing statistical learning with plots of individual conditional expectation. J Comput Graph Stat. 2015;24(1):44-65.
CrossRef - Lipton ZC. The mythos of model interpretability. Commun ACM. 2018;61(10):36-43.
CrossRef - Shrikumar A, Greenside P, Kundaje A. Learning important features through propagating activation differences. In: Precup D, Teh YW, editors. Proceedings of the 34th International Conference on Machine Learning; 2017 Aug 6-11; Sydney, Australia. PMLR; 2017. p. 3145-3153.
- Topol EJ. High-performance medicine: the convergence of human and artificial intelligence. Nat Med. 2019;25(1):44-56.
CrossRef - Liu X, Rivera SC, Moher D, Calvert MJ, Denniston AK. Reporting guidelines for clinical trial reports for interventions involving artificial intelligence: the CONSORT-AI extension. Nat Med. 2020;26(9):1364-1374.
CrossRef - Lundberg SM, Lee SI. A unified approach to interpreting model predictions. In: Guyon I, Luxburg UV, Bengio S, Wallach H, Fergus R, Vishwanathan S, et al., editors. Advances in Neural Information Processing Systems 30; 2017 Dec 4-9; Long Beach, CA, USA. Curran Associates, Inc.; 2017. p. 4765-4774.
- Krittanawong C, Zhang H, Wang Z, Aydar M, Kitai T. Artificial intelligence in precision cardiovascular medicine. J Am Coll Cardiol. 2017;69(21):2657-2664.
CrossRef - Tonekaboni S, Joshi S, McCradden MD, Goldenberg A. What clinicians want: contextualizing explainable machine learning for clinical end use. In: Doshi-Velez F, Fackler J, Jung K, Kale D, Ranganath R, Wallace B, et al., editors. Proceedings of the 4th Machine Learning for Healthcare Conference; 2019 Aug 9-10; Ann Arbor, MI, USA. PMLR; 2019. p. 1-21.
Abbreviations List
AI – Artificial Intelligence
AUC – Area Under the Curve
CAD – coronary artery disease
CRP – C-Reactive Protein
ECG – Electrocardiogram
EHR – Electronic Health Record
FBS – Fasting Blood Sugar
HDL – High-Density Lipoprotein
ICU – Intensive Care Unit
LDL – Low-Density Lipoprotein
LR – Logistic Regression
ML – Machine Learning
RF – Random Forest
SHAP – Shapley Additive Explanations
ST – ST Segment (ECG segment)
UCI – University of California, Irvine
XGBoost – Extreme Gradient Boosting

