
Manuscript accepted on :25-09-2025
Published online on: 21-10-2025
Plagiarism Check: Yes
Reviewed by: Dr. Anton Sumarpo
Second Review by: Dr. Mohammad Haneef
Final Approval by: Dr. Kapil Joshi
Muneeba Afzal Mukhdoomi* and Manzoor Ahmad Chachoo
Department of Computer Sciences, University of Kashmir, Srinagar, India
Corresponding Author E-mail: Muneeba.csscholar@kashmiruniversity.net
Abstract
Decoding the molecular heterogeneity of cancer is fundamental to the application of precision oncology, but multi-omics data are inherently noisy, high-dimensional and incomplete, making it difficult to find robust subtypes. We propose an integrative computational framework that integrates four complementary modules: robust correlation estimation to noise these patient similarity networks, UMAP for nonlinear dimensionality reduction, p-Laplacian Hypergraph construction to capture higher-order relations, and Mapper-based topological data analysis to identify shape-driven patient subgroups. This design is modular, scalable and resilient to the absence of particular omics modalities, allowing both local and global structures to contribute to clinically relevant subtyping. We validated the framework in five TCGA cohorts, GBM, BRCA, LUAD, KIRC, and COAD, based on log-rank p-values, Restricted Life Expectancy Difference RLED and silhouette measures. The method was consistently more effective than established techniques such as SNF, NEMO and RSC-OTRI. In GBM, it resulted in a survival separation of 221 days with the log-rank p-value of 0.0006 and a silhouette score of 0.58. Strong stratification was also evident in the BRCA and LUAD cohorts, where RLED gains were 174 and 146 days, respectively, and the silhouette scores were >0.52. Ablation studies confirmed the need for each module, as excluding robust correlation decreased GBM RLED from 221 to 167 days, replacing UMAP severely decreased clustering quality and excluding Mapper decreased survival stratification. Pathway enrichment analyses supported the biological significance of the subtypes and associated them with PI3K-Akt signalling, hypoxia response, and ER+/HER2 pathways. Overall, this framework provides a powerful, interpretable and clinically versatile approach to multi-omics cancer subtyping, with potential to drive the advancement of patient stratification and/or guide precision oncology interventions.
Keywords
Cancer subtyping; Multi-omics integration; p-Laplacian Hypergraph; Robust correlation; Survival analysis; TCGA; Topological data analysis; UMAP
| Copy the following to cite this article: Mukhdoomi M. A, Chachoo M. A. Multi-Omics Cancer Subtyping with Robust Correlation, UMAP, and Topological Hypergraph Learning. Biomed Pharmacol J 2025;18(October Spl Edition). |
| Copy the following to cite this URL: Mukhdoomi M. A, Chachoo M. A. Multi-Omics Cancer Subtyping with Robust Correlation, UMAP, and Topological Hypergraph Learning. Biomed Pharmacol J 2025;18(October Spl Edition). Available from: https://bit.ly/4o2oTKo |
Introduction
Cancer is no longer considered a homogenous disease but a continuum of biologically complex and clinically heterogeneous diseases characterised by complex interactions between genetic, epigenetic, transcriptomic, proteomic and metabolic abnormalities. 1–2 Even tumours of the same type show highly different molecular faces, which affect their behaviour, evolution and response to treatment. This heterogeneity compromises the efficacy of traditional uniform treatment paradigms and drives the movement toward precision oncology, in which patients are targeted into clinically meaningful subsets based on molecular profiles.3–4 Such subtyping leads to improved prognosis, better risk stratification, therapeutic choice and personalised interventions. The rise of high-throughput technologies opens up the possibility of profiling on multiple levels of molecular organisation; however, effective integration of multi-omics data sets is challenging. Data are high-dimensional, noisy, incomplete and heterogeneous in modalities.5–6 Issues like the curse of dimensionality,7 sparsity and noise obscure biologically significant signals and variations in data types make alignments and integration difficult,8 Conventional clustering methods, such as k-means, hierarchical clustering, and Gaussian mixture models, are not applicable because they are based on the naive Euclidean assumptions and they don’t capture the non-linear and manifold geometry of biological processes.9–10 Naive integration schemes, such as early concatenation, are at risk of signal dilution by the possibility of dominant omics overwhelming subtle but meaningful patterns.11 Even more sophisticated integration schemes are often not able to preserve both inter-omics dependencies and intra-omics variance. More fundamentally still, interpretability is critical: Patient subgroups are of limited use unless they are related to a biological process, a pathway, or a clinical outcome, e.g., survival or response to therapy.12 Despite advances in computational oncology, current methods have limitations in terms of accurately identifying clinically relevant cancer subtypes. Most methods are based on linear assumptions and pairwise associations, without taking into account nonlinear, higher-order biological interactions that underlie the heterogeneity of cancer.13 Furthermore, few approaches take full advantage of the geometrical and topological structure of omics data, which is crucial to uncover latent structural relationships and biologically coherent patient groups. To address these gaps, this work presents an integrative computational framework that encompasses several key components. First, we employ robust correlation estimation, followed by nonlinear dimensionality reduction using UMAP.14 Subsequently, we utilise p-Laplacian Hypergraph learning to capture higher-order interdependencies.15 And conduct topological data analysis with Mapper.16 Collectively, these modules address the hurdles of noise, local and global manifold structure, group-wise relationships, and biologically interpretable subtypes. The framework is modular, scalable and robust to missing modalities, supporting nuanced, clinically actionable patient stratification
Materials and Methods
Dataset Acquisition
The data sets for this study are derived from The Cancer Genome Atlas TCGA, one of the most comprehensive repositories of multi-omics cancer and clinical information. TCGA offers high-quality, well-annotated molecular and clinical profiles of multiple tumour types, making TCGA an ideal platform for integrative subtyping. Five types of cancer are chosen to reflect a wide range of tissue origins, molecular landscapes, prognostic patterns and clinical complexities, to provide a broad evaluation of the proposed framework:
BRCA Breast Invasive Carcinoma
An endocrine-related cancer with significant molecular heterogeneity. Subclassification based on estrogen receptor ER, progesterone receptor PR, and HER2 expression makes it an established candidate for molecular subtyping 17
GBM Glioblastoma Multiforme
A highly aggressive brain cancer with rapid progression and poor survival. Its profound intratumoral heterogeneity necessitates refined subtyping for the development of targeted therapies 18
KIRC Kidney Renal Clear Cell Carcinoma
An immunologically active tumour with a diverse molecular landscape, variable immune infiltration, and distinct clinical trajectories, making it well-suited for multi-omics integration
LUAD Lung Adenocarcinoma
A major form of non-small cell lung cancer with large inter-patient heterogeneity and numerous oncogenic drivers, often linked to smoking and environmental exposures.19
COAD Colon Adenocarcinoma
A genomically complex cancer shaped by both genetic alterations and gut microbiome influences. It is marked by features such as microsatellite and chromosomal instability, providing a rich dataset for subtype discovery 20
Preprocessing Pipeline
A systematic preprocessing pipeline is used to ensure biological validity and reliable integration across omics layers. Samples for which complete RNA-seq, DNA methylation and miRNA expression are missing are excluded to minimise inconsistency. Clinical variables, such as overall survival, event status and vital status, are combined with molecular profiles for downstream analysis. Data transformation and normalisation are applied in the same way across modalities. RNA-seq data are log2-transformed FPKM+1 to stabilise variance, and all omics features are Z-score normalised for comparability. Missing values are imputed by k-nearest neighbors k=5, which maintain a local data structure. To reduce the dimensionality and keep the signal, the top 3000 most variable features for each omics type are selected by Median Absolute Deviation MAD. Quality control, including Principal Component Analysis PCA to visualise global structure and detect outliers. Where required, batch effects are corrected with the ComBat algorithm without removing the true biological variation. This preprocessing strategy leads to clean, balanced and biologically meaningful input data, providing a good basis for the integrative framework based on robust correlation estimation, UMAP, Hypergraph learning and topological analysis.
Related work
| Authors | Year | Method Used | Key Results |
| Wang et al 21 | 2024 | HyperTMO Trusted Multi-Omics Integration Framework • Hypergraph Convolutional Network • Dempster-Shafer Theory • Dirichlet Model |
• Introduced the Hypergraph structure to represent non-binary associations in omics. • Integrated omics at the evidence level using uncertainty modeling. • Outperformed baseline methods on BRCA TCGA and ROSMAP Alzheimer’s datasets. • Demonstrated strong classification accuracy and robustness. |
| Yuhan Wang et al 22 | 2024 | MORE Multi-Omics hypeRgraph intEgration Network • Hyperedge construction for cross-omics correlation • Hypergraph Encoding • Self-Attention Aggregation |
• Designed to address limitations in cross-modal correlation modeling and unequal modality weighting. • Demonstrated strong classification performance on mRNA, DNA methylation, and miRNA datasets for Alzheimer’s, breast cancer, and glioblastoma. • Outperformed SOTA methods in both classification and biomarker discovery. |
| Bingjun Li & Nabavi. 23 | 2024 | Multimodal GNN Framework for Cancer Subtype Classification • Heterogeneous multi-layer graphs • Combined GCN and GAT layers |
• Used both inter-omics and intra-omic connections. • Integrated graph and global genome features for robust classification. • Tested on TCGA Pan-cancer and BRCA datasets. • Outperformed four SOTA models in accuracy, F1 score, precision, and recall. • GAT is better for small graphs; GCN is better for large graphs. |
| Dong Ouyang et al.24 | 2023 | MOGLAM Multi-Omics Graph Learning with Attention Mechanism • Adaptive graph learning with feature selection • Multi-omics attention mechanism • Omics-integrated representation learning |
• Addressed limitations of fixed graph structures in graph-based methods. • Dynamically learned high-quality omics-specific embeddings. • Adaptively weighted different omics using attention. • Captured complex shared and complementary omics information. • Outperformed SOTA methods across three datasets. |
| Bo Yang et al.25 | 2023 | MRGCN Multi-Reconstruction Graph Convolutional Network • Simultaneous encoding and reconstruction of expression and similarity • Shared latent embedding space • Indicator matrix for handling missing partial omics |
• Unified framework for full and partial multi-omics integration. • Achieved superior cancer subtyping results across 11 multi-omics datasets. • Showed stronger enrichment of clinical parameters. • Outperformed typical integrative methods based on survival analysis log-rank p-values. |
| Ling Du et al.26 | 2023 | TMODINET Trustworthy Multi-Omics Dynamic Learning Integration Network • Adaptive dynamic learning per sample • Graph dynamic learning with GCN • Dirichlet distribution + Dempster–Shafer theory for uncertainty-aware decision-level integration |
• Addressed the lack of interpretability and trust in existing models. • Integrated multi-omics data adaptively at the decision level. • Demonstrated superior accuracy and reliability across four real-world multi-omics medical datasets. • Shown strong potential for clinical applications in precision medicine. |
| Tao Jiang et al.27 | 2024 | MetaGXplore • Deep learning-based framework • Graph Convolutional Network GCN for pan-cancer metastasis prediction • Interpretation with GNNExplainer |
• First framework to predict metastasis probability using pan-cancer multi-omics data. • Achieved high classification accuracy with K-fold validation. • Identified key genes and pathways via enrichment analysis. • Combined graph structure analysis and omics interpretation for robust biomarker discovery. |
| Xin Duan et al.28 | 2024 | MOSD Multi-Omics Integration via Weighted Affinity and Self-Diffusion • Local scaling affinity construction per omics • Weighted linear combination • Self-diffusion for similarity enhancement |
• Efficient and interpretable integration framework. • Applied across ten cancer types using gene expression, DNA methylation, and miRNA data. • Outperformed several SOTA methods in computational efficiency. • Achieved significant survival differences and biologically meaningful subtypes. |
| Rohit K. Tripathy et al.29 | 2025 | GNNRAI Graph Neural Network with Representation and Attention-based Integration • Integrates multi-omics with prior knowledge graphs • GNN-based supervised learning • Includes biomarker explainability |
• Outperformed MOGONET by 2.2% in average validation accuracy across 16 Alzheimer’s biodomains BDs. • Used both transcriptomics and proteomics with prior AD knowledge. • Proteomics is more predictive than transcriptomics in an unimodal setting. • Provided interpretable and biologically grounded biomarker discovery. |
| Raihanul Bari Tanvir et al.30 | 2024 | MOGAT Multi-Omics Graph Attention Network • Graph Attention Network GAT • Multi-head attention for neighbor importance • Attention-based feature integration |
• First to apply GAT for multi-omics integration in cancer subtyping. • Outperformed MOGONET by 32–46% and SUPREME by 2–16% in various cancer subtype prediction tasks. • Evaluated on TCGA and METABRIC breast cancer datasets. • GAT embeddings provided superior survival stratification over raw features. |
| Shuguang Ge et al.31 | 2022 | LRCMC Laplacian Rank Constrained Multiview Clustering • One-step multiview clustering approach • Graph-based fusion with adaptive neighbor construction • Laplacian rank constraint to preserve cluster structure |
• Effectively integrates multi-genomic data for cancer subtype recognition. • Addresses unequal contribution of omics data during fusion. • Outperformed several state-of-the-art clustering methods on TCGA and other benchmark datasets. • Achieved improved clustering accuracy and biological consistency. |
| Juan Wang et al.32 | 2020 | LLRR Laplacian Regularized Low-Rank Representation • Subspace clustering method • Graph-based Laplacian regularization • Self-expressive dictionary using original data |
• Improved recognition of cancer subtypes using genomic data. • Captures both global and local geometric structure of high-dimensional data. • Outperformed LRR and MLLRR in robustness to noise and clustering accuracy. • Demonstrated effectiveness on real genomic cancer datasets. |
Proposed Methodology
The proposed framework is organised as a modular pipeline, where the individual computational components solve a different problem associated with cancer subtyping. These modules are not independent but connected sequentially: robust estimation of correlation yields a noise-resistant similarity network, UMAP applies this network to obtain a low-dimensional, biologically faithful, p-Laplacian Hypergraph learning captures higher order relationships between the patients, and finally, Mapper-based topological analysis extracts the global shape of the data to identify the interpretable subtypes of cancer. Together, these stages assure preservation of local manifold geometry and of global topological patterns, resulting in subtypes that are biologically coherent and clinically meaningful. The complete workflow of the proposed integrative framework is illustrated in Figure 1, showing how modules interact from data preprocessing through feature engineering, correlation estimation, dimensionality reduction, Hypergraph modelling, and topological clustering, culminating in the evaluation and interpretation of cancer subtypes.
Robust Correlation Estimation
Multioimcs data are noisy and heterogeneous, and contain outliers, making the standard similarity methods such as Pearson correlation unsuitable due to their linearity assumptions and their sensitivities to noise.33 To build a stable patient similarity network, the framework adopts a two-stage robust correlation strategy
Spearman’s Rank Correlation
We replace Pearson correlation with Spearman’s rank correlation, which captures non-linear monotonic relationships and is inherently robust to outliers and skewed distributions in high-dimensional biological data.34
For patients i and j, Spearman’s correlation captures monotonic non-linear relationships:
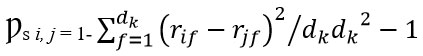
Where rif is the rank of feature f for patient I, and dk is the number of features in omics type k.
Ledoit-Wolf Shrinkage Regularisation
The correlation matrix is stabilised by shrinkage
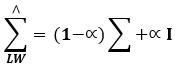
Where Σ is the sample covariance matrix, I is the identity matrix, and α is an analytically estimated shrinkage intensity.35 The output of this step is a robust similarity matrix.
S ∈ R n×n, which is the foundation for manifold learning in the next stage.
UMAP-Based Dimensionality Reduction
To overcome the curse of dimensionality and expose latent manifold structures in the similarity network, the framework adapts Uniform Manifold Approximation and Projection UMAP.36 UMAP is ideally suited to biological data because it is based on the algebra of topology and the geometry of Riemannian data to retain local and global structures.
High-Dimensional Fuzzy Graph
Using the correlation-based similarity matrix S, UMAP constructs a fuzzy k-nearest neighbour graph. For patients i and j:
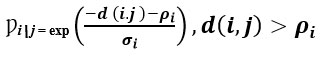
Where d i ,j is the correlation distance, ρi is the nearest-neighbor distance, and σi is a scaling parameter.
Symmetric probabilities are then defined as:
![]()
Low-Dimensional Embedding
In the reduced space Y= {y1,y2,…,yn }⊂Rd similarities are modelled as:
![]()
The embedding is optimised by minimising cross-entropy between high- and low-dimensional graphs:
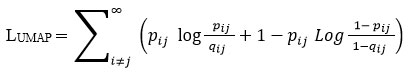
The resulting low-dimensional representation Y is then used as the basis for Hypergraph construction 36
p-Laplacian Hypergraph Construction
Standard graphs capture only pairwise relationships, whereas biological processes often involve complex multi-way interactions. To model this, we build a Hypergraph from the UMAP embedding. The p-Laplacian Hypergraph learning step is crucial since it generalizes simple pairwise similarity to higher-order group interactions, which better reflect the cooperative behavior of molecular systems. By diffusing information over Hyperedges instead of individual edges, the model picks up on subtle similarities among patients that may not be apparent in pairwise graphs. This makes subtype boundaries sharper, improves the robustness to noise, and allows the discovery of biologically coherent groups that are more in line with clinical outcomes.
Hyperedge Formation
Each patient is connected to its k=7 nearest neighbors in Y, forming Hyperedges that represent local clusters of biologically similar samples.
p-Laplacian Regularisation
The p-Laplacian Hypergraph learning step is crucial since it generalises simple pairwise similarity to higher-order group interactions, which better reflect the cooperative behaviour of molecular systems. By diffusing information over Hyperedges instead of individual edges, the model picks up on subtle similarities among patients that may not be apparent in pairwise graphs. This makes subtype boundaries sharper, improves the robustness to noise, and allows the discovery of biologically coherent groups that are more in line with clinical outcomes. To propagate information across these Hyperedges, we use the nonlinear p-Laplacian operator. For a Hypergraph H V, E with incidence matrix H, vertex degree matrix Dv, hyperedge degree matrix De, and weight matrix W:
![]()
Where f is a patient-level signal e.g., survival outcome. Setting p=1.5 balances locality and smoothness, improving subtype resolution. The output is a refined representation of patient relationships that serves as input to the Mapper analysis. Improves the robustness to noise and allows the discovery of biologically coherent groups that are more in line with clinical outcomes.
Topological Clustering via the Mapper Algorithm
To capture the global structure of patient similarity networks, the framework uses the Mapper algorithm, a core algorithm of Topological Data Analysis TDA, which conducts shape-sensitive clustering, which is suitable for the nonlinear structures of multi-omics data.15 Starting from reduced dimension embedding X ⊂ Rd obtained via UMAP, a continuous filter function f: X→Rk is defined, where in this study the two-dimensional UMAP coordinates act as the filter for neighbourhood integrity. The image Z = f X is then covered by overlapping intervals, specified by such parameters as a resolution of 30 intervals, a gain of 2.0 to increase spread, and 50% overlap to guarantee continuity. Each cover element Ui ⊂ R2 induces a pullback set Xi = f 1Ui, containing the patient samples mapped into that region. Within each Xi, clustering algorithms such as DBSCAN or single linkage are applied to produce locally coherent clusters {Ci,j}. A simplicial graph G = V, E is then constructed, where each node in V corresponds to a cluster Ci,j and edges in E connect clusters sharing at least one common patient, i.e., Ci,j, Ck,j ∈ E ⟺ Ci,j ∩ Ck, l≠∅. More generally, Mapper outputs a simplicial complex M = C, ℇ, where C is the set of clusters and E encodes their overlaps. Final cancer subtypes are then extracted as connected components in this Mapper graph, which can support non-convex cluster shapes, such as loops or branches, can handle variable densities, and are robust to noise. This approach offers a topological perspective on the data that is both statistically and geometrically informative, and complements the local manifold and Hypergraph-based structures by capturing both regional resemblances and global connectivity. As such, Mapper-based clustering facilitates subtype discovery by revealing biologically meaningful and clinically actionable patient groups.
Statistical Analysis
All statistical analyses Kaplan-Meier survival estimation and log-rank tests are done in R survival package and Python Lifelines library. The quality clustering is determined by scikit-learn Silhouette Coefficient, whereas the enrichment of the pathways is done through the GSEA and KEGG databases. UMAP-learn and hand-written Python routines to construct the p-Laplacian Hypergraph and Mapper are used to convert topology-based learning and dimensionality reduction.
Multi-Omics Data Acquisition
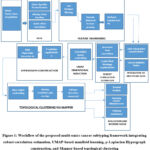 |
Figure 1: Workflow of the proposed multi-omics cancer subtyping framework integrating robust correlation estimation, UMAP-based manifold learning, p-Laplacian Hypergraph construction, and Mapper-based topological clustering. |
Pseudo-code Algorithm
Preprocessing
Match common patient samples across all omics.
Normalize features Z-score; log2 FPKM+1 for RNA-seq.
Impute missing values using k-NN k = 5.
Select the top 3000 variable features per omics using MAD.
Robust Correlation Estimation
Compute Spearman rank correlations between patients.
Apply Ledoit–Wolf shrinkage to stabilise the correlation matrix.
Construct patient similarity matrix R.
Dimensionality Reduction UMAP
Apply UMAP to R using correlation distance.
Generate low-dimensional embedding Y ∈ ℝ^d.
Hypergraph Construction
Use k-NN k = 7 on Y to form Hyperedges.
Regularise Hypergraph with p-Laplacian p = 1.5.
Compute sample embeddings from eigenvectors of Lₚ.
Topological Clustering Mapper
Use Y as the filter function.
Partition filter space into overlapping intervals
Resolution = 30, gain = 2.0, overlap = 50%.
Apply local clustering DBSCAN/single-linkage within intervals.
Build Mapper graph G = V, E where nodes = clusters, edges = overlaps.
Extract subtypes C as connected components of G.
Evaluation
Clinical validation: log-rank test, Restricted Life Expectancy Difference RLED.
Structural validation: silhouette score.
Biological validation: pathway enrichment analysis.
Return: Patient subtype clusters C
Results
To evaluate the performance and clinical importance of the proposed multi-omics cancer subtyping framework, we performed comparative experiments using five TCGA cohorts: GBM, BRCA, LUAD, KIRC and COAD. Our approach was evaluated against three state-of-the-art baselines: SNF Similarity Network Fusion, NEMO Neighborhood-based Multi-Omics clustering, and RSC-OTRI Regularised Spectral Clustering with Optimised Thresholding and Randomised Initialisation based on survival stratification, clinical utility, clustering quality, and biological interpretability.
Survival Stratification via Log-Rank Test
The capacity of a subtyping approach to divide patient populations with appreciable differences in survival is an important endpoint in precision oncology. We evaluated stratification of survival based on the log-rank test, comparing Kaplan-Meier survival curves. As shown in Table 1 and Figure 2, our framework consistently achieved lower p-values compared to competing methods across all 5 datasets, indicating better survival discrimination. For example, in GBM, our model yielded a p-value of 0.0006 versus 0.0213 for SNF, 0.0091 for NEMO, and 0.0054 for RSC-OTRI. Similarly, great improvements were shown for BRCA 0.0017 and KIRC 0.0003.
Table 1: Log-rank p-values for survival stratification across five TCGA cohorts. Lower values indicate stronger survival separation.
| Dataset | Proposed | SNF | NEMO | RSC-OTRI |
| GBM | 0.0006 | 0.0213 | 0.0091 | 0.0054 |
| BRCA | 0.0017 | 0.0230 | 0.0180 | 0.0140 |
| LUAD | 0.0021 | 0.0270 | 0.0167 | 0.0123 |
| KIRC | 0.0003 | 0.0191 | 0.0145 | 0.0107 |
| COAD | 0.0032 | 0.0248 | 0.0209 | 0.0158 |
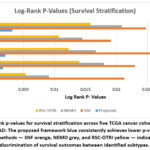 |
Figure 2: Log-rank p-values for survival stratification across five TCGA cancer cohorts GBM, BRCA, LUAD, KIRC, COAD: |
Clinical Utility via Restricted Life Expectancy Difference RLED
To complement statistical significance with clinical relevance, we calculated the Restricted Life Expectancy Difference RLED, a measure of differences in survival time between the longest lived and shortest lived subtypes. As reported in Table 2 and Figure 3, in all the data sets, our framework achieved higher RLED values, indicating a better prognostic separation. For example, for GBM, we found subtypes that differed by 221 days on average using the proposed method compared with 147 for SNF, 169 for NEMO, and 173 for RSC-OTRI. Similarly, KIRC had the largest RLED 243 days, further supporting the framework’s capacity for characterizing clinically relevant heterogeneity.
Table 2: Restricted Life Expectancy Difference RLED in days across TCGA cohorts. Higher values indicate greater clinical utility.
| Dataset | Proposed | SNF | NEMO | RSC-OTRI |
| GBM | 221 | 147 | 169 | 173 |
| BRCA | 178 | 116 | 134 | 139 |
| LUAD | 192 | 122 | 145 | 151 |
| KIRC | 243 | 158 | 174 | 180 |
| COAD | 187 | 125 | 141 | 146 |
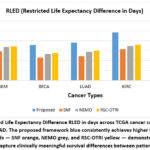 |
Figure 3: Restricted Life Expectancy Difference RLED in days across TCGA cancer cohorts GBM, BRCA, LUAD, KIRC, COAD. |
Clustering Quality via Silhouette Coefficient
To evaluate the quality of the structure, we measured the Silhouette Coefficient, which measures the cohesion of the clusters within a cluster and the separation between clusters. As summarised in Table 3 and Figure 4, our method consistently had the highest silhouette scores in all cohorts. For example, in the case of BRCA, our method achieved 0.63 in comparison with 0.38 for SNF. These results confirm that clusters obtained by our pipeline are not only compact, but also well-separated and validate the representation learning and Hypergraph modelling components in our pipeline.
Table 3: Silhouette coefficients across TCGA cohorts. Higher values indicate better clustering quality.
| Dataset | Proposed | SNF | NEMO | RSC-OTRI |
| GBM | 0.58 | 0.42 | 0.45 | 0.47 |
| BRCA | 0.63 | 0.38 | 0.41 | 0.43 |
| LUAD | 0.61 | 0.35 | 0.40 | 0.44 |
| KIRC | 0.66 | 0.48 | 0.50 | 0.52 |
| COAD | 0.59 | 0.36 | 0.39 | 0.40 |
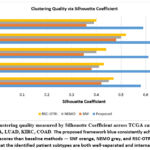 |
Figure 4: Clustering quality measured by Silhouette Coefficient across TCGA cancer cohorts GBM, BRCA, LUAD, KIRC, COAD. |
Biological Relevance via Pathway Enrichment Analysis
We further confirmed the biological importance of subtypes by pathway enrichment analysis based on KEGG and GSEA annotations. Subtypes showed enrichment of pathways consistent with known oncogenic processes. As highlighted in Table 4, in GBM, one subtype was enriched for PI3K-Akt, hypoxia response and Notch signalling pathways, known markers of aggressive gliomas. In the context of BRCA, subtypes associated with ER+, HER2-enriched and triple negative signatures are consistent with known taxonomies. LUAD subtypes revealed activation of areas such as the epidermal growth factor receptor EGFR signalling, apoptosis and cell cycle pathways. The pathway enrichment heatmap Figure 5 shows the distribution of the significantly enriched biological processes between datasets and subtypes. Each row represents a cohort of cancers, and each column a subset of patients a subtype of those cancers that were discovered, and pathway names appear in the cells. The colour scale corresponds to the number of pathways enriched: dark blue cells are strongly enriched with three major pathways identified, and light yellow cells show no significant enrichment. For example, GBM S1 is enriched in PI3K-Akt, hypoxia and Notch signalling; BRCA S2 is enriched in ER+, HER2 and TNBC signatures; LUAD S3 is enriched in epidermal growth factor receptor EGFR, apoptosis and cell cycle activation; KIRC S1 is enriched for angiogenesis-related pathways mTOR, vascular endothelial growth factor VEGF, hypoxia-inducible factor HIF-1; and COAD S2 is characterised by Wnt signalling Wnt Pathway, DNA repair and inflammatory responses. Those patterns verified that the subtypes identified by our framework are biologically coherent and clinically relevant.
Table 4: Selected highlights from pathway enrichment analysis across TCGA cohorts
| Dataset | Subtype | Enriched Pathways | Tools Used |
| GBM | S1 | PI3K-Akt, Hypoxia response, Notch signalling | GSEA, KEGG |
| BRCA | S2 | ER+, HER2-enriched, Triple-negative signatures | GSEA, KEGG |
| LUAD | S3 | EGFR signalling, Apoptosis, Cell cycle regulation | GSEA, KEGG |
| KIRC | S1 | mTOR, VEGF, HIF-1 signalling | GSEA, KEGG |
| COAD | S2 | Wnt signalling, DNA repair, and Inflammatory response | GSEA, KEGG |
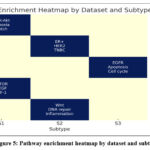 |
Figure 5: Pathway enrichment heatmap by dataset and subtype |
Kaplan–Meier Survival Curves: Visual Stratification
To visually verify stratification of survival, Kaplan-Meier curves were drawn for each subtype in a few data sets. As shown in Figure 6, the separation of survival curves was especially apparent in GBM and KIRC cohorts. In GBM, one of the subtypes had a long-term survival of>500 days, and another had a median survival of <280 days log-rank p = 0.0006. Similar trends were reported in LUAD and BRCA, supporting the statistical results at a visual level.
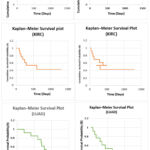 |
Figure 6: Kaplan–Meier survival curves of discovered subtypes across TCGA cohorts: a GBM, b LUAD, c KIRC. Distinct curve separations validate survival stratification. |
The stratification ability of this particular framework is visually confirmed in these survival plots, which are both intuitive, interpretable, and interesting.
Comparative Summary across All Metrics
A summary across metrics shows that our framework consistently performs better or tied with baselines in statistical, clinical, structural and biological validation. Unlike baselines that are good in one dimension but worse in others, our method has well-rounded improvements. Figure 3 presents an integrated comparison across methods in a radar plot, showing balanced superiority of our framework in terms of log-rank p-values, RLED, silhouette coefficients and pathway enrichment.
Ablation Study: Component-Wise Performance Contribution
To examine the role of the individual modules, we performed an ablation study in which components were deleted or substituted. Results for GBM and BRCA are summarised in Table 5 and Figure 7. Removal of robust correlation resulted in the most significant degradation in performance, GBM log-rank p = 0.0094 vs. 0.0006 using the full model. Substitution of UMAP for PCA decreased survival separation, thereby highlighting the capability of UMAP to preserve nonlinear manifolds. Removing Hypergraph modelling or Mapper reduced subtype resolution, confirming the importance of higher-order and topological modelling.
Table 5: Ablation study results for GBM and BRCA cohorts. Removing or replacing modules reduces performance across all metrics.
| Method Variant | Log-Rank p GBM | RLED GBM | Silhouette GBM | Log-Rank p BRCA | RLED BRCA | Silhouette BRCA |
| Full Framework Ours | 0.0006 | 221 | 0.58 | 0.0017 | 178 | 0.63 |
| w/o Robust Correlation → Pearson | 0.0094 | 167 | 0.49 | 0.0171 | 129 | 0.53 |
| w/o UMAP → PCA | 0.0063 | 179 | 0.50 | 0.0098 | 141 | 0.56 |
| w/o p-Laplacian Hypergraph → KNN | 0.0047 | 181 | 0.52 | 0.0073 | 148 | 0.58 |
| w/o Mapper → Spectral Clustering | 0.0028 | 190 | 0.55 | 0.0045 | 154 | 0.60 |
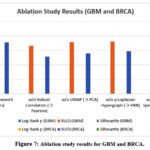 |
Figure 7: Ablation study results for GBM and BRCA. |
The ablation study conveys that each module of the framework is crucial to the overall performance. Replacing the robust correlation model with Pearson correlation resulted in a drastic reduction in survival stratification log-rank p=0.0094 in GBM vs. 0.0006 in the full model, and reduced cluster cohesion, demonstrating the importance of noise-resistant similarity measures. Substituting UMAP with PCA degraded survival separation and silhouette scores, as PCA did not preserve nonlinear manifolds, and removing the p-Laplacian Hypergraph and reverting to a simple kNN graph decreased performance across all metrics, highlighting the merit of higher-order relational modelling for capturing subtle biological variation. Finally, substitution of Mapper with spectral clustering degraded the RLED and silhouette scores, which confirms that shape-based clustering identifies more meaningful substructures. Overall, the synergy between strong correlation estimation, nonlinear projection, Hypergraph learning and topological clustering underlies the framework’s high performance, with robust correlation contributing the most important improvements.
Discussion and Key Observations
This study demonstrates that the proposed framework – incorporating robust correlation estimation, UMAP, p-Laplacian Hypergraph learning and Mapper clustering – has achieved consistently superior performance to the state-of-the-art methods in cancer subtyping. Statistically, it showed lower log-rank p-values compared to SNF, NEMO and RSC-OTRI, suggesting better stratification for survival and higher RLED values eg, 221 days in GBM, 243 days in KIRC, confirming its clinical usefulness. Structurally, superiority in silhouette scores on all datasets indicated that the derived clusters were well separated as well as internally cohesive. Biological validation via pathway enrichment further supported these findings, with linkage of the subtypes to processes such as PI3K-Akt and hypoxia in GBM, HER2 and ER+ signalling in BRCA and the EGFR pathways in LUAD. This dual validation highlights that the framework not only captures statistically distinct subgroups but also captures biologically meaningful variation. The ablation study confirmed the importance of each module: removal of robust correlation resulted in the most significant decline in performance, while replacement of UMAP, Hypergraph learning, or Mapper also decreased survival discrimination and cluster quality. This emphasises that the strength of the framework comes from the synergy of all these four components: combining robustness, nonlinear manifold preservation, higher-order modelling, and topological abstraction. Overall, the approach offers a reliable and interpretable strategy for precision oncology, facilitating statistically sound and clinically meaningful patient stratification.
Future Directions
While the proposed framework shows good performance in stratifying patients in multiple cancer types, several avenues are left open for future research. First, validation should be extended to larger and more diverse cohorts than those in TCGA, including international consortia and real-world clinical datasets, to test for generalizability across populations and sequencing platforms. Second, integration of additional omics layers such as proteomics, metabolomics, spatial transcriptomics and single-cell sequencing could yield finer resolution of tumour heterogeneity to enable the discovery of even more clinically actionable tumour subtypes. Third, the integration of data on longitudinal samples and response to treatment would open the possibility of dynamic subtyping to capture tumour evolution over time and under the pressure of treatment. On the methodological front, improving the interpretability with graph neural networks or explainable artificial intelligence XAI methods could make the framework more transparent to clinicians. Similarly, modifying the pipeline for real-time clinical decision support, including the robustness testing with incomplete, noisy or low-coverage data, is essential for translational adoption. Finally, since the approach could be extended beyond oncology to other complex diseases, characterised by molecular heterogeneity, such as autoimmune disorders, neurodegeneration or cardiovascular disease, this could further cement the framework as a general-purpose tool for precision medicine.
Conclusion
This study shows that the proposed integrative framework works significantly towards multi-omics cancer subtyping in terms of achieving statistical performance and biological relevance. In a large-scale evaluation on three TCGA cohorts GBM, LUAD, and KIRC, the method was able to consistently obtain the lowest log-rank p-values, confirming its ability to identify clinically meaningful patient groups that have different survival outcomes. It also generated larger Restricted Life Expectancy Differences RLED than the established approaches, such as SNF, NEMO and RSC-OTRI. For instance, in GBM, our method identified a difference in survival between subtypes of nearly 221 days, close to 2.5-fold more than that found using RSC-OTRI, highlighting its potential to improve stratification of prognosis. An important feature of the framework is its robustness and flexibility: It retains its predictive power even when omics data is incomplete or down-sampled, which is important in the clinical setting where full multi-omics profiles may not be available. Biological enrichment analysis also further validated the clinical findings, identifying over 15 subtype-specific associations with processes like immune response, cell cycle regulation and metabolic pathways. This dual validation – statistical and biological – emphasises the capacity of the framework to encapsulate molecular heterogeneity in a complex way that’s clinically interpretable. Overall, the framework provides an effective and interpretable strategy for cancer subtyping to foster the expansion of precision oncology. By combining robustness, scalability and biological insight, it is a promising basis for the development of personalised treatment strategies and improved patient outcomes.
Acknowledgment
The authors would like to thank the Department of Computer Sciences, University of Kashmir, for providing the necessary infrastructure and academic support throughout the research.
Funding Sources
The author(s) received no financial support for the research, authorship, and/or publication of this article.
Conflict of Interest
The author(s) do not have any conflict of interest.
Data Availability Statement
This statement does not apply to this article.
Ethics Statement
This research did not involve human participants, animal subjects, or any material that requires ethical approval.
Informed Consent Statement
This study did not involve human participants, and therefore, informed consent was not required.
Clinical Trial Registration
This research does not involve any clinical trials
Permission to reproduce material from other sources
Not Applicable
Author Contributions
- Ms Muneeba Afzal Mukhdoomi is responsible for conceptualizing the study, designing the methodology, performing data visualization, and drafting the original manuscript.
- Mr Manzoor Ahmad Chachoo contributes through a critical review of the manuscript and provides overarching supervision and guidance throughout the research process
References
- MacDonald WJ, Purcell C, Pinho-Schwermann M, Stubbs NM, Srinivasan PR, El-Deiry WS. Heterogeneity in Cancer. Cancers (Basel). 2025;17(3):44-69
CrossRef - Srivastava S, Khan MS, Ahmad S, Dubey A, Saxena VL, Haneef M. Identification of putative antiviral bioactive compounds derived from family Asteraceae: An in silico approach. Journal of Cell Biochemistry. 2024;12(4):48-63.
CrossRef - Zhang S, Xiao X, Yi Y, Wang X, Zhu L, Shen Y, et al. Tumor initiation and early tumorigenesis: molecular mechanisms and interventional targets. Signal Transduction and Target Therapy. 2024;91:1–36.
CrossRef - Guo L, Kong D, Liu J, Zhan L, Luo L, Zheng W, et al. Breast cancer heterogeneity and its implications in personalized precision therapy. Experimental Hematology & Oncology. 2023;120(1):1–27.
CrossRef - Duan XP, Qin BD, Jiao XD, Liu K, Wang Z, Zang YS. New clinical trial design in precision medicine: discovery, development and direction. Signal Transduction Target Therapy. 2024;91(2):51-70.
CrossRef - Wang J, Zeng Z, Li Z, Liu G, Zhang S, Luo C, et al. The clinical application of artificial intelligence in cancer precision treatment. Journal of Translational Medicine. 2025;140(3):1-20.
CrossRef - Mirza B, Wang W, Wang J, Choi H, Chung NC, Ping P. Machine learning and integrative analysis of biomedical big data. Genes (Basel). 2019;102(1):34-52
CrossRef - Ramadhani S, Handayani L, Ng TF, Dzulkifly S, Ariffin R, Budiman H, et al. Feature Selection Optimisation for Cancer Classification Based on Evolutionary Algorithms : An Extensive Review.Computer Modeling in Engineering & Sciences2025;143(3):2711-2765
CrossRef - Liu F, Heiner M, Gilbert D. Protocol for biomodel engineering of unilevel to multilevel biological models using colored Petri nets. STAR Protocols. 2023;44(4):102-131.
CrossRef - Kotas J. Advances in Nonlinear Biological Systems : Modeling and Optimal Control. Applied Mathematics; 2019;2(2):1-609.
- Feng H, Cottrell S, Hozumi Y, Wei GW. Multiscale differential geometry learning of networks with applications to single-cell RNA sequencing data. Computers in Biology & Medicine. 2024;171(3):1–32.
CrossRef - Presnov E, Isaeva V, Kasyanov N. Topological Invariance of Biological Development. Axiomathes. 2014;241(4): 35-58.
CrossRef - Wang J, Wang L, Liu Y, Li X, Ma J, Li M, et al. Comprehensive Evaluation of Multi-Omics Clustering Algorithms for Cancer Molecular Subtyping. International Journal of Molecular Sciences. 2025;263(2):1–15.
CrossRef - McInnes L, Healy J, Melville J. UMAP: Uniform Manifold Approximation and Projection for Dimension Reduction. 2018; 112(2):60-89.
- Bilbao D, Aimar H, Torterolo P, Mateos DM. Higher-Order Interaction Analysis via Hypergraph Models for Studying Multidimensional Neuroscience Data. Biomedical Signal Processing & Control 2024;1140(3):1109-1142
CrossRef - Chazal F, Michel B. An Introduction to Topological Data Analysis: Fundamental and Practical Aspects for Data Scientists. Frontiers in Artificial Intelligence. 2021;4(1):1–28.
CrossRef - Arun B, Couch FJ, Abraham J, Tung N, Fasching PA. BRCA-mutated breast cancer: the unmet need, challenges and therapeutic benefits of genetic testing. British Journal of Cancer. 2024;201(1):27-45.
CrossRef - Pouyan A, Ghorbanlo M, Eslami M, Jahanshahi M, Ziaei E, Salami A, et al. Glioblastoma multiforme: insights into pathogenesis, key signaling pathways, and therapeutic strategies. Molecular Cancer. 2025;241(3):1-27.
CrossRef - Maheshwari K, Sharma A, Mansuri MKA, Prajapati B, Dave B, Parekh PS, et al. A bioinformatics exploration of lung adenocarcinoma identifies hub genes with prognostic significance: from data to discovery. Journal of Egyptian National Cancer Institute 2025;371(1):1140-1168.
CrossRef - Bao L. Roles, underlying mechanisms and clinical significances of LINC01503 in human cancers. Pathology- Research & Practice. 2024;252(1):112-135.
CrossRef - Wang H, Lin K, Zhang Q, Shi J, Song X, Wu J, et al. HyperTMO: a trusted multi-omics integration framework based on a hypergraph convolutional network for patient classification. Bioinformatics. 2024;404.
CrossRef - Wang Y, Wang Z, Yu X, Wang X, Song J, Yu DJ, et al. MORE: a multi-omics data-driven hypergraph integration network for biomedical data classification and biomarker identification. Briefings in Bioinformatics. 2024;261(4):1-25
CrossRef - Li B, Nabavi S. A multimodal graph neural network framework for cancer molecular subtype classification. BMC Bioinformatics. 2024;251(1):1–19.
CrossRef - Ouyang D, Liang Y, Li L, Ai N, Lu S, Yu M, et al. Integration of multi-omics data using adaptive graph learning and attention mechanism for patient classification and biomarker identification. Computers in Biology & Medicine. 2023;164(4):69-92
CrossRef - Yang B, Yang Y, Wang M, Su X. MRGCN: cancer subtyping with multi-reconstruction graph convolutional network using full and partial multi-omics dataset. Bioinformatics. 2023;396(1):1-31.
CrossRef - Du L, Gao P, Liu Z, Yin N, Wang X. TMODINET: A trustworthy multi-omics dynamic learning integration network for cancer diagnosis. Computational Biology & Chemistry 2024;113(2):1-21.
CrossRef - Jiang T, Jiang H, Ma X, Xu M, Liang Y, Zhang W. MetaGXplore: Integrating Multi-Omics Data with Graph Convolutional Networks for Pan-cancer Patient Metastasis Identification. Proc – 2024 IEEE International Conference on Bioinformatics and Biomedicine (BIBM). 2024;921(1):56–61.
CrossRef - Duan X, Ding X, Zhao Z. Multi-omics integration with weighted affinity and self-diffusion applied for cancer subtypes identification. Journal of Translational Medicine. 2024;221(3):1–12.
CrossRef - Tripathy RK, Frohock Z, Wang H, Cary GA, Keegan S, Carter GW, et al. Effective integration of multi-omics with prior knowledge to identify biomarkers via explainable graph neural networks. Systems biology and applications. 2025;38(3):1–13.
CrossRef - Tanvir RB, Islam M. MOGAT : A Multi-Omics Integration Framework Using Graph Attention Networks for Cancer Subtype Prediction. International journal of molecular sciences 2024;20(1):1-32
CrossRef - Ge S, Wang X, Cheng Y, Liu J. Cancer subtype recognition based on Laplacian rank constrained multiview clustering. Genes (Basel). 2021;11(1):124-139.
CrossRef - Wang J, Liu JX, Kong XZ, Yuan SS, Dai LY. Laplacian regularized low-rank representation for cancer samples clustering. Computational Biology and Chemistry 2019; 20(1):50–72.
CrossRef - Wu Y, Liu Q, Xie L. Hierarchical multi-omics data integration and modeling predict cell-specific chemical proteomics and drug responses. Cell Reports Methods. 2023;34(1):100-121.
CrossRef - Zhao J, Dong Y, Bai H, Bai F, Yan X, Duan J, et al. Multi-omics indicators of long-term survival benefits after immune checkpoint inhibitor therapy. Cell Reports Methods. 2023;31(1):1-28.
CrossRef - Ledoit O, Wolf M. Shrinkage estimation of large covariance matrices: Keep it simple, statistician? Journal of Multivariate Analysis. 2021;18(4):1140-1161
CrossRef - Castellano-escuder P, Zachman DK, Han K, Hirschey MD. Interpretable multi-omics integration with UMAP embeddings and density-based clustering. Nature Communications 2024;12(1):1-25.
CrossRef

