
Manuscript accepted on :16-10-2025
Published online on: 07-11-2025
Plagiarism Check: Yes
Reviewed by: Dr. Sudhanshu and Dr. Nataliya Kitsera
Second Review by: Dr. Abidin Çalişkan
Final Approval by: Dr. Anton R Keslav
Richa Gupta1,2* , Vidit Kumar1 and Vikas Tripathi1
1Department of CSE, Graphic Era Deemed to be University, Dehradun, India.
2Department of CSE, Graphic Era Hill University, Dehradun, India.
Corresponding Author E-mail: Richa1883gupta@gmail.com
DOI : https://dx.doi.org/10.13005/bpj/3292
Abstract
Colour fundus photography is a valuable tool for detecting key biomarkers and early-stage lesions linked to various illnesses, including diabetic retinopathy (DR). DR remains a leading cause of vision impairment and blindness globally, resulting from capillary endothelial damage, increased vascular permeability. In recent years, substantial advancements have been made in developing automated DR classification techniques utilizing retinal fundus imaging. However, the detection of multiple DR stages remains an underexplored domain. Furthermore, challenges such as high interclass similarity, subtle lesion size variations, and redundant features within fundus images significantly complicate the classification process. Existing methodologies often suffer from either inefficient lesion-specific feature extraction or rely heavily on manual lesion annotations, leading to suboptimal grading performance or increased annotation burden. To mitigate these challenges, this study introduces a novel attention-driven technique, termed Efficient Spatial Attentional Deep Learning approach (ESADL), which enhances multistage DR classification by improving feature selection and lesion localization. Given a feature map extracted from intermediate layer of CNN, our module called Efficient Spatial Attention Module (ESAM) parallelly infers attention map along four separate pathways, then the attention map is multiplied to the input feature map for feature refinement. By leveraging multi-branch convolutions, diverse receptive fields, and efficient attention mechanisms, ESAM enhances the model’s ability to distinguish subtle retinal abnormalities, leading to more accurate and reliable DR classification. The ESADL model is evaluated on multiple retinal fundus image datasets, including IDRID_Rgrade, Messidor, IDRID_Edema, and Mendley. The proposed model achieves superior performance on IDRID_Edema dataset, attaining an accuracy of 84% with EfficientNet-B0 and 80% with MobileNetV2, On IDRID_Rgrade proposed model achieves 65% using the EfficientNet-B0 base model and 57% using the MobileNetV2 base model, on Messidor Fold1 got 61% accuracy with MobileNetV2 and 60% with EfficientNetB0.
Keywords
Attention based model; CBAM; Deep learning; EfficieNetB0; MobileNetV2
Download this article as:| Copy the following to cite this article: Gupta R, Kumar V, Tripathi V. ESAM: Efficient Spatial Attention based Deep Learning Approach for Fundus Images Classification. Biomed Pharmacol J 2025;18(4). |
| Copy the following to cite this URL: Gupta R, Kumar V, Tripathi V. ESAM: Efficient Spatial Attention based Deep Learning Approach for Fundus Images Classification. Biomed Pharmacol J 2025;18(4). Available from: https://bit.ly/4nKwSuG |
Introduction
OCULAR disease is another name for eye diseases. Ocular diseases are the abnormalities in eye’s external and internal conditions of the eye. These abnormalities can be results in improper vision or vision loss.1 Some diseases can be normal and some of them are rare. According to WHO 2020 report, approx. 2.2 billion people live with vision impairment, in which 1 billion can be treated and can be prevented. According to a report, these visual impairment cases can be raised to 3.5 billion in 2030. These statistics demonstrate the prevalence of eye illnesses worldwide and the significance of having access to high-quality eye care services as well as early detection and treatment. In India vision impairment cases are 137.6 million in the year 2020, this data is provided by the two international bodies. Various eye diseases can cause visual impairment, such as Age-related Macular Degeneration (AMD), Glaucoma, Cataract, and Diabetic Retinopathy (DR).2
In Table 1 all the medical eye images and their usage has been explained. In Ophthalmology, there are three types of retinal images used, i.e., Fundus images, OCT images, OCTA images. All of these images are described in the following sections, along with their sample illustrations. Deep Learning has a significant effect on medical field as it is used to automate the process of disease diagnosis, detection and treatment. Various Deep learning techniques and methodologies are used in this area, like- Image Segmentation,3 Diseases Detection and Classification, Early Detection, Quantitative analysis, Customized treatment, Multi modal Integration, Automation, Real-Time Analysis.9 Various deep learning models had been used till date for the detection and the classification of medical images.25,26 Traditional CNN-based approaches for medical image analysis, including Diabetic Retinopathy (DR) classification and segmentation, primarily rely on convolutional layers to extract spatial and hierarchical features.4,12 However, these methods struggle with high interclass similarity and small lesions detection. These approaches have some challenges in capturing the long-range dependencies.5,22 The irrelevant features can be used through the skip connections and the deep layers which can increase the noise.6,21 So, there is need a new approach that can mitigate the above limitations of CNN. For the above context CBAM (Convolutional Block Attention Module7,11) is introduced by the researchers to overcome the challenges in CNN, it is the attention module used with the CNN for the sake of segmentation. The CBAM enhances feature representation by sequentially applying channel and spatial attention mechanisms to an intermediate feature map. First, channel attention prioritizes the most significant feature channels, followed by spatial attention, which focuses on essential regions within the feature map. After this many approaches are developed with this attention module, like SE-Net, ADCNet8 and CDAM-Net.9 These existing attention models have their own limitations. Like CBAM only use a single branch for the feature extraction which cannot capture the multi-scale lesion information.23 In contrast SE-Net24 focuses only on the channel-wise importance of features but ignores spatial dependencies, which are crucial in localizing fine details in medical images. For the above-mentioned limitations, we have proposed a new attention module ESAM. It is a multi-branch convolutional block attention module that integrates multi-scale feature extraction with attention mechanism. This model learns hierarchical lesion specific features more effectively. This ESAM dynamically suppresses irrelevant features while enhancing the most relevant ones for precise DR classification.
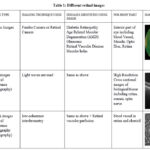 |
Table 1: Different retinal imagesClick here to view Table |
It’s important to keep in mind that a variety of factors affect how well deep learning works in medical imaging like the quantity and quality of labelled data, the architecture of the neural networks, and the interaction between medical specialists and AI experts.9
In this study, we thoroughly investigate emerging deep learning methods and their applications in creating new model for medical eye imaging. Given the constraints of the most prominent published works available at the moment, the following are our contributions:
We propose an Efficient Spatial Attentional Deep Learning approach (ESADL) for effective eye disease diagnosis.
We proposed an efficient attention module ESAM which is attached at different blocks of deep learning model. We explored 7 different models with different combinations of ESAM and EfficientNet and MobileNet at different blocks.
The proposed model is validated using 4 different datasets. Compared to the current models, the suggested model performs better.
Literature Survey
This section presents the overview of some previous works done by the researchers by using deep learning approaches and the attention module. First
Deep Learning utilized Approaches
Several automated models have been developed in the past few years for the classification of DR using deep learning models in the retinal images. These deep learning models reduces the work load of ophthalmologists and increase the efficiency for the classification and detection of the ocular diseases. First Machine learning models were utilized for this purpose. Later Deep learning models was used like Esfahani, M. T. et. Al.15 developed an automated model for the detection of DR by using CNN, ResNet34 on retinal images. The researchers increase the depth of the network and prevent gradient saturation so that the error has been reduced. In the same year Wang, X., Lu13 used AlexNet, VGG16 and InceptionV3 models of CNN for the classification of DR. They apply SGDM to find the minimum cost function to all three CNN. This rule follows an exponential weight average of the gradient of the cost function. Li, T., Gao et.al.14 Introduce a new dataset for the detection of DR. They applied different Deep learning models on their dataset. They perform the classification, segmentation and object detection on the generated dataset. They applied DL models like VGG16, Resnet, GoogleNet, DenseNet and Inception models on the dataset. In 2021 Martinez-Murcia16 employ a RCNN to extract discriminative features without requiring any prior complex image transformations to enhance image quality or emphasize specific structures. Additionally, we leverage the transfer learning paradigm, utilizing pre-trained layers from deep neural networks trained on the ImageNet dataset. This approach is based on the hypothesis that early layer’s capture abstract, transferable features that can be effectively reused across different tasks. To validate our method, we conducted experiments with various convolutional architectures and assessed their performance on the MESSIDOR database using cross-validation. In 2022 Mondal, S. S17 developed an Ensembling deep learning models enhances predictive accuracy and overall performance compared to individual models. In this approach, two deep learning architectures—a modified DenseNet101 and ResNeXt—are combined for diabetic retinopathy detection. ResNeXt builds upon the ResNet architecture by incorporating shortcuts between blocks, stacked layers, and a split–transform–merge strategy. It also introduces a cardinality parameter that determines the number of transformations, improving feature extraction. Meanwhile, DenseNet101 enhances feature utilization efficiency by employing dense block concatenation. The ensemble is constructed by normalizing class probabilities followed by maximum a posteriori (MAP) estimation to determine the final classification label. In 2024 author Santos, M. S.18 presents a novel Siamese CNN (SCNN) for the detection of DR. To extract the features, they made advantage of shared weights in the layers. Key features are extracted from fundus eye pictures using the Siamese network technique, which uses two identical CNNs with shared weights. In order to ascertain the links between input pairs, it then calculates output-level similarity. This methodology is particularly evaluated to test the hypothesis that Siamese networks can effectively handle limited data and imbalanced class distributions, ensuring robust performance in such challenging scenarios.
Attention Utilized Modules
Attention module is utilized for improving the performance of Deep Learning techniques for the identification of diseases, semantic segmentation and for the object localization. First Woo, S.11 introduces CBAM module for the feed forward CNN. Since CBAM is lightweight and architecture-agnostic, it can be seamlessly integrated into any CNN model with minimal computational overhead while remaining fully trainable in an end-to-end fashion alongside the base network. After this work multiple new attention module have introduced by the researchers. In 2017 He, A.21 proposed a novel Category Attention Block (CAB), designed to extract more discriminative region-specific features for each diabetic retinopathy (DR) grade while ensuring equal treatment of all categories. Furthermore, class-agnostic global attention feature maps for fundus pictures are generated via a Global Attention Block (GAB) in order to capture fine-grained lesion details. For DR grading, the CABNet model is created by combining these attention modules with a backbone network. Because of their adaptability and ability to be integrated into a variety of backbone networks, the suggested attention blocks allow for effective end-to-end training. By utilising their inherent link, Li, X., and Hu23 created a unique Cross-Disease Attention Network (CANet) in 2019 that uses only image-level supervision to grade diabetic macular oedema (DME) and diabetic retinopathy (DR) simultaneously. An attention module tailored to a particular disease that extracts pertinent features for each one separately. A Disease-Dependent Attention Module, which captures the interconnections between DR and DME to enhance feature learning. These attention mechanisms are seamlessly integrated into a deep learning framework, enabling the network to learn both disease-specific and disease-dependent features. This joint learning approach improves overall classification performance for DR and DME grading. In 2021 Al-Antary, M. T20 explains how to classify diabetic retinopathy using the Multi-Scale Attention Network (MSA-Net). The suggested technique maps retinal pictures into a high-level representational space using an encoder network, where mid- and high-level features are integrated to improve representation. After that, a multi-scale feature pyramid is added to record retinal structures at various granularities. Moreover, the high-level representation is subjected to a multi-scale attention mechanism to enhance the derived features’ discriminative power. The proposed technique by Alahmadi, M. D.22 in 2022 involves processing the input image first using an encoder module that extracts both semantic and high-level data. A content and style separation technique are used to improve feature representation by breaking down the feature space into content representation (such as semantic and contextual information) and style representation (such as texture features). The Texture Attention Module highlights texture details by applying a high-pass filter to the style representation, while the Spatial Normalisation Module uses convolutional procedures to find the most useful areas of the retinal image for the purpose of identifying diabetes symptoms. The Fusion Module combines both feature representations after implementing these attention methods, creating a fine-tuned, normalised feature space for the decoding path. Lastly, the decoder module carries out activities for healthy versus non-healthy classification as well as diabetic retinopathy grading. A unique attention method that targets both bright and dark retinal regions independently through an initial picture breakdown process was proposed by Romero-Oraá, R.19 in 2024. Through the use of explainable AI (XAI), this process produces different attention maps for bright and red lesions. Deep learning methods like data augmentation, transfer learning, and fine-tuning are also included in the system, along with an image quality evaluation step. The Xception architecture is used to improve feature extraction, and the focus loss function is applied to correct for data imbalance.
Proposed Methodology
ESADL is proposed in this work depicted in Figure 1, It is a deep learning attention model with the attention module named ESAM. ESAM is a convolutional attention module with multiple branches that integrates multi-scale feature extraction with attention mechanisms can be seen in Figure 2: Unlike single-stream attention modules, ESAM, introduces three different convolutional branches, each learning distinct feature representations (Block 1: Extracts shallow features (low-level textures), Block 2: Captures mid-level feature representations, Block 3: Focuses on deep semantic information, refining the final decision-making process). By using multi-scale convolutional layers + ReLU activations, our method learns hierarchical lesion-specific features more effectively. ESAM dynamically suppresses irrelevant features while enhancing the most relevant ones for precise DR classification.
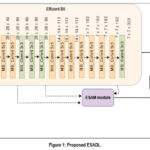 |
Figure 1: Proposed ESADL |
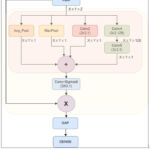 |
Figure 2: Proposed ESAM module |
ESADL
This work proposed an Efficient Spatial Attentional Deep Learning approach called ESADL shown in Figure 1. This includes an attention module called ESAM, which is a multi-branch convolutional block attention mechanism. It consists of four distinct branches—Block1, Block2, and Block3—each containing a different number of convolutional layers followed by ReLU activation. There are four branches, first branch (block1) consists one pair of Conv+ReLu layers with size [3×3, 1], second branch (block2) consist two pairs of Conv + ReLu layers in which first size is [1×1, 64] and second pair size is [3×3, 1]. One branch is of Mean max layer which performs Average pool operation and last branch consist of Maxpool layer.
The size of these branches like filter and kernel size is dependent on the layer at which this module is attached. This ESAM module is attached at different layers in deep learning models like MobileNetV2 and EfficientNetB0.
We have used a given intermediate input feature map f ∈ Rx×y×z as the input to the new improved ESAM, then this input is parallelly fed into one mean_max layer (Mx), block1, block2 and block3.
![]()
Where, f is the input intermediate feature map to the Mean_max layer and the output is generated f1=Mx(f) where the f1 ∈ R3×3×1
![]()
Where f is the input to one Convolution layer and the output generated is f2=Conv (f) where f 2 ∈ R3×3×1 ,
![]()
f feature map is inserted to the second block which has 2 convolution layers in sequence, the function generated is f 3 =Conv (Conv (f)) where f 3 ∈ R3×3×1,
![]()
f is also inserted to block 3 which has 3 convolution layers in sequence, with block 3 the function generated is f 4= Maxpool (f))) where f 4 ∈ R3×3×1 .
After this the aggregation of all these outputs is performed
![]()
R1 is the output generated by the Add function, Where R1 ∈ R7×7×1 , then a Convolution layer is applied
![]()
Where R2 ∈ R7×7×1, Then a Sigmoid function is applied
![]()
Where R3 ∈ R7×7×1, Then multiplication operation is performed
![]()
Where X is the output of the base model last layer where the ESAM is applied with the feature map and R4 ∈ R7×7×1
So, with this the output for this ESAM is R6.
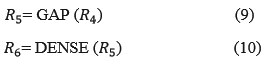
The ESAM module primarily supports the learning and extraction of features of different receptive field (RF) sizes (i.e., multi-scale features) via a set of tiny filters, hence increasing feature learning capability. Figure 2 shows the proposed ESAM block, which includes 1 × 1 convolutional, 3 × 3 convolutional, and depth-wise convolutional layers. It’s worth noting that each Conv layer includes ReLu activation layer. Small-size filters (e.g., 1×1 and 3×3) extract fine details like changes in optic discs and cups in fundus pictures, while large-size filters (e.g., 14×14 and 7×7) retrieve coarse features like lesion shape and structure. Filters of different sizes (e.g., 3×3,7×7, 14×14 etc.) have been applied in deep learning models for multi-scale feature learning to extract features with varying receptive field (RF) sizes. Large-size filters have higher parameters compared to smaller filters (1×1 and 3×3). As a result, small-size filters are now commonly used in efficient deep learning models like MobileNetV2 and EfficientNetB0. To enable multi-scale feature learning, we used ESAM at various layers of the deep learning models. However, unlike the prior models, the ESAM block uses these filters in an efficient manner, which promotes learning features. The output of all the blocks is added together with the Mean_Max (Average Pool) layer also. Then output of this Add function given to the conv2d layer with the size (3×3, 1) that uses SoftMax function as the activation function. At the end the output of this Conv2d layer and the base model’s output from the same layer is multiplied together. The output of the same is followed by the GAP layer. The output of the base model and the ESAM output is concatenated together, which is followed by the Dense layer with Sigmoid function.
| ALGORITHM: ESAM# Input: Feature map f ∈ R^(x×y×z) (intermediate feature map)
# Output: R6 (processed output) # Step 1: Parallel Operations f1 = MeanMaxLayer(f) # f1 ∈ R(x×y×1) f2 = ConvLayer(f) # f2 ∈ R(x×y×1) f3 = ConvLayer(ConvLayer(f)) # f3 ∈ R(x×y×1) f4 = Maxpool(f) # f4 ∈ R(x×y×1) # Step 2: Aggregation R1 = Add(f1, f2, f3, f4) # R1 ∈ R(7×7×1) # Step 3: Convolution on Aggregated Features R2 = ConvLayer(R1) # R2 ∈ R(7×7×1) # Step 4: Apply Sigmoid R3 = Sigmoid(R2) # R3 ∈ R(7×7×1) # Step 5: Multiplication with Base Model Output R4 = Multiply(BaseModelOutput, R3) # R4 ∈ R(7×7×z) # Step 6: Global Average Pooling R5 = GlobalAveragePooling(R4) # R5 ∈ R(1×1×z) # Step 7: Dense Layer R6 = DenseLayer(R5) # R6 ∈ Output Dimension # Return the final output return R6 |
Algorithm for the above ESAM module
Materials and Methods
This research introduces a novel attention-guided deep learning architecture named Efficient Spatial Attentional Deep Learning (ESADL), aimed at enhancing multistage Diabetic Retinopathy (DR) classification by improving feature discrimination and lesion localization. The core innovation lies in the Efficient Spatial Attention Module (ESAM), which is integrated into lightweight CNN architectures such as EfficientNetB0 and MobileNetV2 to strengthen feature extraction and improve classification performance.
ESAM is a multi-branch convolutional attention mechanism that brings several benefits to DR detection and broader medical image analysis. By utilizing multiple convolutional branches with varied receptive fields and incorporating efficient attention strategies, ESAM increases the model’s capability to detect subtle retinal anomalies. This leads to more accurate and robust DR classification outcomes.
The effectiveness of the ESADL framework is validated using multiple retinal fundus image datasets, including IDRID_Rgrade, Messidor, IDRID_Edema, and Mendley.
First, we conduct the experiments with CBAM attention module on both deep learning models i.e. EfficientB0 and MobileNetV2. CBAM is connected to the efficientNetB0 at block6d_add layer, then at block5c_add layer and at the end it is connected at block4c_add layer. After this CBAM is connected to the MobileNetV2 at block_16_project_BN layer, then at block _15_add layer and at the end it is connected to the block_12_add layer. We use these different layers to connect the CBAM module because of different size of kernel and filters.
After all this the proposed ESAM is connected to the EfficientNetB0 and MobileNetV2 at the same layers as explained above. But the difference is that we have changed the size of Kernel in the ESAM’s second and third pair according to the output of the respective layer at which it is attached.
Efficient NetB0
At block6d_add layer- with Input (7, 7, 192) (7, 7, 192) and output is (7, 7, 192)-
At block5c_add layer – with Input (14, 14, 112) (14, 14, 112) and output is (14, 14, 112)
At block4c_add layer- with Input (14, 14, 80) (14, 14, 80) and output is (14, 14, 80)
MobileNetV2
At block_16_project_BN layer- with Input (7,7,320) and output is (7,7,320)
At block_15_add layer- with Input (7,7,160) (7,7,160) and output is (7,7,160)
At block_12_add layer- with Input (14,14,96) (14,14,96) and output is (14,14,96)
Dataset
The experiment is performed on the IDRID_Rgrade data set, it has fundus images for DR. It has 413 training images and 103 testing images with five classes 0 to 4 based on the severity level. 0 represents the no DR present weather 4 shows highest severity in DR. Data is available at https://ieee-dataport.org/open-access/indian-diabetic-retinopathy-image-dataset-idrid
Using the Messidor dataset, we test our method and compare the outcomes to earlier research. 1200 fundus photos from three ophthalmologic departments are included in it. Based on a severity rating, the DR classified photos into four classes class 0 for normal to class 3 severity. Data is available at https://www.adcis.net/en/third-party/messidor/
The experiment is performed on the IDRID_Edema data set, it has fundus images for Macular Edema. It has 413 training images and 103 testing images with three classes 0 to 2 based on the severity level. 0 for no Macular Edema, 1 shows mild Macular Edema and 2 shows highest severity in Macular Edema. Data is available at https://ieee-dataport.org/open-access/indian-diabetic-retinopathy-image-dataset-idrid
Using the Mendley dataset, we test our method and compare the outcomes to earlier research. It has two versions, first is the original dataset which has 5335 images in total for 10 classes and second version has 16242 images for 10 classes. We have used the original dataset with 5335 images, 3742 for training and 1603 for testing. The detail about the classes and their respective number of images are given below in the table 2. Data is available at https://drive.google.com/drive/folders/16rQzSt7-SxghL99nohNJbF_FUFiQd-QJ
Table 2: Mendley Data Set Description
| Class_name | Original | Augmented |
| Myopia | 500 | 2251 |
| Retinitis Pigmentosa | 139 | 834 |
| Retinal Detachment | 125 | 750 |
| Central Serous Chorioretinopathy [Color undus] | 101 | 606 |
| Macular Scar | 444 | 1937 |
| Healthy | 1024 | 2676 |
| Diabetic Retinopathy | 1509 | 3444 |
| Glaucoma | 1349 | 2880 |
| Pterygium | 17 | 102 |
| Disc Edema | 127 | 762 |
| Total | 5,335 | 16,242 |
Results
The results of the suggested method are shown in this section. By contrasting it with current attention models, we assess the suggested attention mechanism’s efficacy. To examine the role of every element in our attention process, we also carry out ablation research.
Experimental Setup and performance Measures
To evaluate the suggested model and the most recent techniques, we used three datasets of retinal fundus images (two benchmark datasets and one private dataset). Every image was reduced to 224 × 224 pixels, and in order to reduce overfitting, a variety of data augmentation methods were used, including rotation, scaling, and flipping images vertically and horizontally. The models were trained for 100 epochs with the Adam optimiser and the Sparse Categorical cross-entropy loss function. The learning rate was set at 0.001 for the first 50 epochs and then decayed to 0.0001 for the subsequent 50 epochs. The Adam optimizer was selected due to its benefits, including faster convergence, lower memory usage, and reduced need for hyperparameter tuning compared to other optimizers. It should be noted that all hyperparameters were determined empirically in this study. The proposed model built using Keras library with Tensorflow in backend. All experiments performed on Google Colab with TPU.
Several evaluation criteria, such as accuracy (Acc), precision (Prec), recall, area under the ROC curve (AUC), and F1-Score, have been used to compare the performance of the suggested model to current methods for multistage glaucoma classification.
Performance of Proposed ESADL on IDRID_Rgrade dataset
The classification results on IDRID_Rgrade dataset with efficientNetB0 and MobileNetV2 (MBV2), with CBAM, With ESAM and without ESAM are listed in Table 3 and Table 4. Here we can observe that the results are improved with the ESADL. The highest accuracy achieved by the proposed method is 65% for efficientB0 base model and 57% for MBV2base model.
Table 3: Results for EfficientNet with CBAM and ESAM on IDRID_Rgrade dataset
| Execution | CBAM | ESAM | |
| Effbo base model(without CBAM and ESAM) | 1 | 60 | |
| 2 | 60 | ||
| 3 | 59 | ||
| Effnetb0_6d_add | 2 | 53 | 60 |
| 3 | 56 | 54 | |
| 3 | 60 | 56 | |
| Effnetb0_5cadd | 1 | 60 | 62 |
| 2 | 57 | 57 | |
| 3 | 55 | 53 | |
| Effnetb0_4cadd | 1 | 58 | 56 |
| 2 | 59 | 58 | |
| 3 | 59 | 56 | |
| Effnetb0_end | 1 | 52 | 59 |
| 2 | 54 | 59 | |
| 3 | 58 | 65 | |
Table 4: Results for MobileNet with CBAM and ESAM on IDRID_Rgrade dataset
| Execution | CBAM | ESAM | |
| MBV2 base model(without CBAM and ESAM) | 1 | 51 | |
| 2 | 50 | ||
| 3 | 51 | ||
| MBV2_16BN | 1 | 45 | 50 |
| 2 | 51 | 48 | |
| 3 | 56 | 49 | |
| MBV2_15add | 1 | 46 | 45 |
| 2 | 50 | 55 | |
| 3 | 55 | 55 | |
| MBV2_12add | 1 | 45 | 48 |
| 2 | 44 | 54 | |
| 3 | 53 | 57 | |
Performance of Proposed ESADL on IDRID_Edema dataset
We also implement the model on IDRID_EDEMA dataset. The results of EfficientNet and MBV2 are shown in Table 5 and 7. The proposed model outperforms on the dataset with 84% accuracy for efficientB0 at the 6d_add and 80% for MBV2 at 16 BN. The confusion matrix of our model is also given in Table 6. Graph 1 shows the results of validation accuracy with respect of epoch for efficient net model. Table 8 is the confusion matrix of MBV2+proposed model. And the graph of validation accuracy is shown in Graph 2.
Graph 1 demonstrate that efficientB06d_Add likely outperforms because its deeper attention branch processes features at more levels, giving richer spatial cues for classification, and because ESAM’s design prevents the extra depth from overfitting, allowing higher accuracy and better stability in later training stages. It can be observed from the graph that efficientB06d-Add lines remain closer together in the final ~50 epochs with less fluctuation compared to 5D_Add and 4c_add. In table 6 the confusion matrix for the same model is shown. In the confusion matrix it is clear that the class 0 has the high recall value means all the samples from class 0 are detected correctly and for class 2 prediction is correct in most of the cases.
Table 5: Results for EfficientNet with CBAM and ESAM on IDRID_Edema dataset
| Execution | CBAM | ESAM | |
| Effbo base model(without CBAM and ESAM) | 1 | 707172 | |
| 2 | |||
| 3 | |||
| Effnetb0_6d_add | 1 | 82 | 78 |
| 2 | 83 | 84 | |
| 3 | 80 | 81 | |
| Effnetb0_5cadd | 1 | 84 | 78 |
| 2 | 82 | 77 | |
| 3 | 79 | 80 | |
| Effnetb0_4cadd | 1 | 81 | 80 |
| 2 | 79 | 80 | |
| 3 | 81 | 82 | |
| Effnetb0_end | 1 | 82 | 79 |
| 2 | 80 | 75 | |
| 3 | 81 | 78 | |
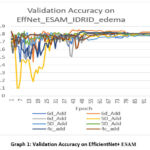 |
Graph 1: Validation Accuracy on EfficientNet+ ESAM |
Table 6: Confusion matrix for IDRID_Edema , with EfficientNet 6d_add and ESAM
| Predicted/Actual | 0 | 1 | 2 |
| 0 | 41 | 3 | 1 |
| 1 | 4 | 4 | 2 |
| 2 | 51 | 1 | 42 |
MobleNetV2 performs well with the ESAM module at 16BN layer as it gives the accuracy 80%. In graph 2 it can easily be interpret that 16BN_1 and 16BN_3 appear to be the most consistent and highest-performing by the end, maintaining accuracy close to 0.80. Batch normalization configuration (BN) strongly influences stability and final accuracy. By the confusion matrix shown in Table 8, we can find that Class 0 has the best classification performance, with very few misclassifications. Class 1 is the hardest to classify correctly as many samples are confused with Class 0 and Class 2. Class 2 performs reasonably well but still has notable confusion with Class 1.
Table 7: Results for MobileNet with CBAM and ESAM on IDRID_Edema dataset
| Execution | CBAM | ESAM | |
| MBV2base model(without CBAM and ESAM) | 1 | 707069 | |
| 2 | |||
| 3 | |||
| MBV2_16BN | 1 | 78 | 80 |
| 2 | 69 | 69 | |
| 3 | 73 | 65 | |
| MBV2_15add | 1 | 67 | 60 |
| 2 | 71 | 70 | |
| 3 | 79 | 78 | |
| MBV2_12add | 1 | 73 | 54 |
| 2 | 68 | 63 | |
| 3 | 72 | 59 | |
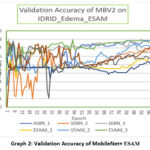 |
Graph 2: Validation Accuracy of MobileNet+ ESAM |
Table 8: Confusion matrix for MobileNet with CBAM and ESAM on IDRID_Edema dataset
| 0 | 1 | 2 | |
| 0 | 43 | 1 | 1 |
| 1 | 4 | 4 | 2 |
| 2 | 5 | 8 | 35 |
Performance of Proposed ESADL on Messidor-Fold1 dataset
Table 9 and Table 10 presents the classification results on the Messidor-Fold1 dataset using EfficientNetB0 and MobileNetV2 (MBV2), with and without CBAM and ESAM. The findings clearly indicate that integrating ESAM enhances the model’s performance. This improvement highlights the effectiveness of the proposed attention mechanism in capturing relevant features, ultimately leading to more accurate classification.
Table 9: Results for MobileNet with CBAM and ESAM on Messidor-Fold1 dataset
| Execution | CBAM | ESAM | |
| MBV2 base model(without CBAM and ESAM) | 1 | 56 | |
| 2 | 55 | ||
| 3 | 56 | ||
| MBV2_16BN | 1 | 51 | 44 |
| 2 | 49 | 57 | |
| 3 | 52 | 58 | |
| MBV2_15add | 1 | 27 | 53 |
| 2 | 54 | 57 | |
| 3 | 50 | 61 | |
| MBV2_12add | 1 | 52 | 59 |
| 2 | 53 | 58 | |
| 3 | 55 | 56 | |
Table 10: Results for EfficientNet with CBAM and ESAM on Messidor-Fold1 dataset
| Execution | CBAM | ESAM | |
| Effbo base model(without CBAM and ESAM) | 1 | 606059 | |
| 2 | |||
| 3 | |||
| Effnetb0_6d_add | 1 | 53 | 55 |
| 2 | 54 | 57 | |
| 3 | 57 | 58 | |
| Effnetb0_5cadd | 1 | 58 | 58 |
| 2 | 56 | 57 | |
| 3 | 57 | 59 | |
| Effnetb0_4cadd | 1 | 58 | 57 |
| 2 | 60 | 53 | |
| 3 | 62 | 54 | |
| Effnetb0_end | 1 | 54 | 59 |
| 2 | 56 | 60 | |
| 3 | 57 | 58 | |
Performance of Proposed ESADL on Mendley original dataset
The classification results for the Mendley dataset, using EfficientNetB0 and MobileNetV2 (MBV2) with CBAM, ESAM, and without ESAM, are summarized in Table 11 and Table 12. The results demonstrate a noticeable improvement when incorporating ESAM, emphasizing its effectiveness in enhancing feature extraction and boosting overall classification accuracy. With efficient Base model it is 93 and with MBV2 it is 74 %.
Table 11: Results for EfficientNet with CBAM and ESAM on Mendley original dataset
| CBAM | ESAM | |
| Effbo base model(without CBAM and ESAM) | 80 | |
| Effnetb0_6d_add+cbam | 92 | 93 |
| Effnetb0_5cadd+cbam | 92 | 93 |
| Effnetb0_4cadd | 91 | 93 |
| Effnetb0_end | 91 | 93 |
Table 12: Results for MobileNet with CBAM and ESAM on Mendley Original dataset
| CBAM | ESAM | |
| MBV2 base model | 71 | |
| MBV2_16BN | 74 | 74 |
| MBV2_15add | 73 | 73 |
| MBV2_12add | 72 | 72 |
Performance comparison of other previous models
The effectiveness of each component within the ESAM is validated through ablation studies, with results presented in Tables 13 and 14 for the Harvard IDRID dataset and Messidor datasets, respectively. We assess the performance of proposed model, observing that classification accuracy. However, our proposed ESAM demonstrates a notable improvement, enhancing accuracy by 4% on the IDRID dataset and 5% on Messidor dataset compared to the baseline. These findings further highlight the efficiency and strong learning capability of our approach.
Table 13: Comparison on IDRID dataset
| Model | Accuracy |
| Mammonth | 54 |
| HarangiM1 | 55 |
| MobileNet+1improved block | 56 |
| MobileNet+2improved block | 51 |
| MobileNet+3improved block | 53 |
| Our Proposed Model | 60 |
Table 14: comparison on 5 folds of other previous models on messidor dataset (4 class)
| Model | Accuracy |
| Vgg-16 [31] | 55.2 |
| Vgg-19 [31] | 55.1 |
| R50 | 57 |
| MobileNet+1improved block | 59 |
| MobileNet+2improved block | 60 |
| Our Proposed Model | 65 |
Figure 3 presents the Gradient-weighted Class Activation Mapping (Grad-CAM) visualization of retinal fundus images, highlighting the discriminative regions utilized by the proposed model during decision-making. Each row contains the original retinal image alongside the corresponding Grad-CAM heatmap. The green boundaries indicate correctly classified cases (where the predicted label matches the true label), whereas the red boundaries highlight misclassified samples. From the visualization, it is evident that the model consistently focuses on clinically relevant retinal regions, such as the macula, optic disc, and areas surrounding pathological lesions (e.g., exudates or edema), when making correct predictions. For instance, in images with a true label of class 2 (severe edema), the highlighted Grad-CAM regions correspond to the localized pathological changes, validating the interpretability of the proposed network. Conversely, in misclassified cases (red-bordered images), the heatmaps show that the network attends to irrelevant or less discriminative regions, leading to erroneous classification. This observation underscores the challenge of inter-class similarity in retinal diseases, where subtle lesions or low-contrast abnormalities can mislead the model. The results affirm that our prposed model enhances the network’s focus on discriminative vascular and lesion-specific regions, compared to baseline attention models.
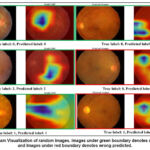 |
Figure 3: Grad-Cam Visualization of random images. Images under green boundary denotes correct predicted and Images under red boundary denotes wrong predicted. |
Discussion
To assess the impact of each element in the proposed approach, ablation studies are conducted. Importantly, all trials were conducted with the same number of training and testing samples for the baseline methods and the proposed strategy, and under the same conditions. All tests were performed using the Retinal Fundus Images dataset. The classification outcomes on the IDRID_Rgrade dataset using EfficientNetB0 and MobileNetV2 (MBV2)—both with CBAM, with ESAM, and without any attention modules—are summarized in Tables 3 and 4. The results clearly show that the proposed ESADL approach leads to performance improvements. Notably, the highest classification accuracy achieved is 65% with the EfficientNetB0-based model and 57% with the MBV2-based model. The model was also evaluated on the IDRID_EDEMA dataset. The results for EfficientNetB0 and MBV2 are presented in Tables 5 and 7, showing that the proposed model significantly outperforms the baseline. It achieves an accuracy of 84% with EfficientNetB0 and 80% with MBV2. The corresponding confusion matrices are provided in Tables 6 and 8, while Graphs 1 and 2 illustrate the validation accuracy over training epochs for both models. Tables 9 and 10 report the classification performance on the Messidor-Fold1 dataset using EfficientNetB0 and MBV2, comparing results with and without CBAM and ESAM. The integration of ESAM clearly enhances model performance, validating the module’s effectiveness in capturing discriminative features and leading to improved classification accuracy. The classification results for the Mendley dataset, using both EfficientNetB0 and MBV2 architectures with CBAM, ESAM, and without attention modules, are detailed in Tables 11 and 12. Incorporating ESAM results in a marked improvement in performance, confirming its capability to enhance feature representation. The best accuracy recorded is 93% with EfficientNetB0 and 74% with MBV2. The impact of individual components within the ESAM module is further evaluated through ablation studies, with results presented in Tables 13 and 14 for the Harvard IDRID and Messidor datasets, respectively. These studies confirm the superiority of the proposed ESAM, which improves classification accuracy by 4% on the IDRID dataset and 5% on the Messidor dataset compared to baseline models. This reinforces the effectiveness and strong feature learning capability of the ESADL framework. The multi-branch design of proposed model takes advantage of pretrained weights by distributing them across branches specialized for different receptive fields and pooling strategies, improving lesion localization and classification accuracy. ESAM works as a background cutter, it learns to highlight relevant retinal lesions, supress background. High data quality improves feature consistency, allowing ESADL’s attention branches to extract meaningful lesion-aware patterns without confusion from artifacts. E.g. On Mendley dataset the model performance with MobileNet is modest because of the image quality, low resolution and lack of clear lesions/feature boundary. For imbalance and hard examples ESAM enhance hard to learn spatial features. ESAM creates attention maps that emphasize subtle or important spatial features — like microaneurysms, hemorrhages, or exudates. Overfitting is more evident when training solely on small datasets like IDRiD subsets without transfer learning, while larger datasets like Messidor offer better generalization.
Conclusion
In this paper, we introduce a multi-label classification network for diagnosing fundus diseases using a single model. The main innovation of our method is the use of focused loss and the integration of spatial attention with EfficientNet-B0 to mitigate the effect of multi-label data imbalance on model performance. In order to improve the robustness of the model and optimize its processing outcomes, we also suggest error correction techniques. There are certain intrinsic limits to the existing model. Further research is necessary to determine the ideal value, even if focus loss can lessen the effect of data imbalance on model performance. It may be possible to further enhance the multi-label classification model’s performance by improving the loss function. Although the model’s interpretability is also very important, advancements in CNN-based medical image classification models still face obstacles related to accessibility, mobility, and interpretability. In medical detection tasks, it is critical to comprehend the underlying assumptions that inform the model’s decision-making process.
In the following stage, representative lesions are found, categorized, and evaluated to see if the network’s classification logic matches the features of the sample lesions. Furthermore, we must investigate if feature extraction for a classification model may be supervised when classification and lesion detection are carried out concurrently.
Acknowledgement
The author would like to express deepest gratitude to Graphic Era Deemed to be University for providing the opportunity, resources, and academic environment necessary to carry out this research. The Department of Computer Science and Engineering, Graphic Era Deemed to be University of Dehradun is highly appreciated for allowing the computer laboratory work.
Funding Sources
The author(s) received no financial support for the research, authorship, and/or publication of this article.
Conflict of Interest
The author(s) do not have any conflict of interest.
Data Availability Statement-
IDRID_Rgrade Data is available at https://ieee-dataport.org/open-access/indian-diabetic-retinopathy-image-dataset-idrid
IDRID_Edema Data is available at https://ieee-dataport.org/open-access/indian-diabetic-retinopathy-image-dataset-idrid
Mendley Data is available at https://drive.google.com/drive/folders/16rQzSt7-SxghL99nohNJbF_FUFiQd-QJ
Ethics Statement
This research did not involve human participants, animal subjects, or any material that requires ethical approval.
Informed Consent Statement
This study did not involve human participants, and therefore, informed consent was not required.
Clinical Trial Registration
This research does not involve any clinical trials
Permission to reproduce material from other sources
Not Applicable
Author Contributions
- Richa Gupta: Conceptualization, Methodology, Writing – Original Draft.
- Vidit Kumar: Analysis, Writing – Review & Editing.
- Vikas Tripathi: Visualization, Supervision.
References
- Gupta R., Kumar V, Tripathi V. An Efficient Deep Learning Approach for Diabetic Retinopathy Classification. 15th International Conference on Computing Communication and Networking Technologies (ICCCNT) 2024; 1-5.
CrossRef - Gupta R, Tripathi V, Gupta A. Diabetic retinopathy detection using an efficient artificial intelligence method. In AIP Conference Proceedings. 2022; 2481:
CrossRef - Sarki R, Ahmed K, Wang H, Zhang Y. Automated detection of mild and multi-class diabetic eye diseases using deep learning. Health Information Science and Systems. 2020;8(1):32.
CrossRef - Nazir T, Irtaza A, Javed A, Malik H, Hussain D, Naqvi RA. Retinal image analysis for diabetes-based eye disease detection using deep learning. Applied Sciences. 2020;10(18):6185.
CrossRef - Sarki R, Ahmed K, Wang H, Zhang Y, Ma J, Wang K. Image preprocessing in classification and identification of diabetic eye diseases. Data Science and Engineering. 2021;6(4):455-71.
CrossRef - García-Floriano A, Ferreira-Santiago Á, Camacho-Nieto O, Yáñez-Márquez C. A machine learning approach to medical image classification: Detecting age-related macular degeneration in fundus images. Computers & Electrical Engineering. 2019;75:218-29.
CrossRef - Vellakani S, Pushbam I. An enhanced OCT image captioning system to assist ophthalmologists in detecting and classifying eye diseases. Journal of X-Ray Science and Technology. 2020;28(5):975-88.
CrossRef - Yue G, Li Y, Zhou T, Zhou X, Liu Y, Wang T. Attention-driven cascaded network for diabetic retinopathy grading from fundus images. Biomedical Signal Processing and Control. 2023;80:104370.
CrossRef - Das D, Nayak DR, Bhandary SV, Acharya UR. CDAM-Net: Channel shuffle dual attention based multi-scale CNN for efficient glaucoma detection using fundus images. Engineering Applications of Artificial Intelligence. 2024 ;133:108454.
CrossRef - Singh U, Kumar V, Pant B. Spatial attention enhanced deep learning model for Alzheimer’s disease diagnosis. 15th International Conference on Computing Communication and Networking Technologies (ICCCNT) .2024: 1-5.
CrossRef - Woo S, Park J, Lee JY, Kweon IS. Cbam: Convolutional block attention module. In Proceedings of the European conference on computer vision (ECCV). 2018: 3-19.
CrossRef - Alyoubi WL, Shalash WM, Abulkhair MF. Diabetic retinopathy detection through deep learning techniques: A review. Informatics in Medicine Unlocked. 2020;20:100377.
CrossRef - Wang X, Lu Y, Wang Y, Chen WB. Diabetic retinopathy stage classification using convolutional neural networks. In2018 IEEE international conference on information reuse and integration (IRI). 2018 : 465-471.
CrossRef - Li T, Gao Y, Wang K, Guo S, Liu H, Kang H. Diagnostic assessment of deep learning algorithms for diabetic retinopathy screening. Information Sciences. 2019;501:511-22.
CrossRef - Esfahani MT, Ghaderi M, Kafiyeh R. Classification of diabetic and normal fundus images using new deep learning method. Leonardo Electron J Pract Technol. 2018;17(32):233-48.
- Martinez-Murcia FJ, Ortiz A, Ramírez J, Górriz JM, Cruz R. Deep residual transfer learning for automatic diagnosis and grading of diabetic retinopathy. Neurocomputing. 2021;452:424-34.
CrossRef - Mondal SS, Mandal N, Singh KK, Singh A, Izonin I. Edldr: An ensemble deep learning technique for detection and classification of diabetic retinopathy. Diagnostics. 2022;13(1):124.
CrossRef - Santos MS, Valadao CT, Resende CZ, Cavalieri DC. Predicting diabetic retinopathy stage using Siamese Convolutional Neural Network. Computer Methods in Biomechanics and Biomedical Engineering: Imaging & Visualization. 2024;12(1):2297017.
CrossRef - Romero-Oraá R, Herrero-Tudela M, López MI, Hornero R, García M. Attention-based deep learning framework for automatic fundus image processing to aid in diabetic retinopathy grading. Computer Methods and Programs in Biomedicine. 2024;249:108160.
CrossRef - Al-Antary MT, Arafa Y. Multi-scale attention network for diabetic retinopathy classification. IEEE Access. 2021;9:54190-200.
CrossRef - He A, Li T, Li N, Wang K, Fu H. CABNet: Category attention block for imbalanced diabetic retinopathy grading. IEEE Transactions on Medical Imaging. 2020;40(1):143-53.
CrossRef - Alahmadi MD. Texture attention network for diabetic retinopathy classification. IEEE Access. 2022 May 23;10:55522-32.
CrossRef - Li X, Hu X, Yu L, Zhu L, Fu CW, Heng PA. CANet: cross-disease attention network for joint diabetic retinopathy and diabetic macular edema grading. IEEE transactions on medical imaging. 2019;39(5):1483-93.
CrossRef - Hu J, Shen L, Sun G. Squeeze-and-excitation networks. In Proceedings of the IEEE conference on computer vision and pattern recognition.2018; pp. 7132-7141.
CrossRef - Aslım C, Çalışkan A. Improving Brain Tumor Detection with Deep Learning Models: A Comparative Analysis Using MRI and RO-SVM Classification. Bitlis Eren Üniversitesi Fen Bilimleri Dergisi.2025;14(2):647-63.
CrossRef - Çalışkan A. Diagnosis of malaria disease by integrating chi-square feature selection algorithm with convolutional neural networks and autoencoder network. Transactions of the Institute of Measurement and Control. 2023;45(5):975-85.
CrossRef
Abbreviations List
ESAM– Efficient Spatial Attention Module,
DR– Diabetic Retinopathy,
ESADL– Efficient Spatial Attentional Deep Learning approach

