
Manuscript accepted on :15-11-2025
Published online on: 02-12-2025
Plagiarism Check: Yes
Reviewed by: Dr. Inamullah Khan
Second Review by: Dr. Shwetha Kumari
Final Approval by: Dr. Prabhishek Singh
Wafaa Abdel Samie Kandeel1 , Ahmed Sayed Ismail1, Mona Abdelkader Mohamed Awad2, Eman Refaat Youness3*and Hanaa Reyad Abdallah1
1Biological Anthropology Department, Medical Research and Clinical Studies Institute, National Research Centre, Cairo, Egypt.
2Clinical and Chemical Pathology Department, Medical Research and Clinical Studies Institute, National Research Centre, Cairo, Egypt.
3Medical biochemistry Department, Medical Research and Clinical Studies Institute, National Research Centre, Cairo, Egypt.
Corresponding Author E-mail: hoctober2000@yahoo.com
DOI : https://dx.doi.org/10.13005/bpj/3291
Abstract
Vitamin D is increasingly recognized for its immunomodulatory and metabolic effects, with growing evidence linking deficiency to the development and progression of type 1 diabetes mellitus (T1DM).We aimed To evaluate vitamin D status among Egyptian T1D pediatric patients and explore its relationship with glycemic control and body physique. A cross-sectional study was conducted on pediatric patients with T1DM. Serum 25-hydroxyvitamin D [25(OH)D] levels were assessed and categorized as deficient, insufficient, or sufficient. Clinical, anthropometric and biochemical parameters, including glycated hemoglobin (HbA1c), were assessed to determine associations with vitamin D status. Body composition was also analyzed. Vitamin D deficiency was highly prevalent, with the majority of patients demonstrating either deficient or insufficient levels. Lower VD levels were significantly associated with poorer glycemic control and higher BMI and body fat. There was no direct correlation between VD and HbA1c. We concluded that Vitamin D deficiency is common in Egyptian diabetic pediatric patients and is associated with adverse glycemic outcomes and higher BMI and body fat. Routine screening and appropriate supplementation may represent a valuable adjunct in disease management, although further future researches are required to confirm causality and establish evidence-based supplementation strategies.
Keywords
Adiposity; Body composition; Glycemic control; Type 1 diabetes mellitus; Vitamin D; Vitamin D deficiency
Download this article as:| Copy the following to cite this article: Kandeel W. A. S, Ismail A. S, Awad M. A. M, Youness E. R, Abdallah H. R. Correlation of Vitamin D Level with Body Physique and Glycemic Control in Type1 Diabetic Egyptian Children and Adolescents. Biomed Pharmacol J 2025;18(4). |
| Copy the following to cite this URL: Kandeel W. A. S, Ismail A. S, Awad M. A. M, Youness E. R, Abdallah H. R. Correlation of Vitamin D Level with Body Physique and Glycemic Control in Type1 Diabetic Egyptian Children and Adolescents. Biomed Pharmacol J 2025;18(4). Available from: https://bit.ly/3M6jLa3 |
Introduction
Type 1 diabetes mellitus (T1DM) is a common chronic autoimmune disease of childhood and adolescence, caused by damage of β-cells of the pancreas and leading to incomplete or complete deficiency of insulin, which could lead to severe complications if untreated.1 It accounts for 5–10% of all diabetes cases and about 90% of diabetic pediatric patients.2 Globally, more than 1.1 million children and adolescents (0–19 years) live with T1DM, with about 128,900 new cases diagnosed annually and an incidence increase of nearly 3% per year.3 Onset most frequently occurs in childhood (ages 4–6) and early puberty (10–14 years), with a peak at 13–14 years.4
Most individuals with T1DM are lean, though some may present with higher weight.5 The condition is influenced by genetic susceptibility, environmental triggers, and adaptive immune dysfunction, with chronic inflammation and progressive β-cell loss causing impaired insulin secretion.6 Optimizing glycemic control is particularly challenging in children; the Diabetes Control and Complications Trial (DCCT) showed that normalization of glucose levels in adolescents is more difficult than in adults.7
Although children with T1DM have traditionally tended to be underweight, sedentary lifestyles and increased consumption of energy-dense foods have led to higher rates of overweight and obesity. Excess adiposity, especially visceral fat, and reduced lean mass are associated with poorer glycemic control, adverse lipid profiles, systemic inflammation, and higher risks of vascular complications. 8,9 Intensive insulin therapy, while crucial, may contribute to weight gain if not balanced with proper diet and activity, with body mass increase largely reflecting fat accumulation.10
BMI alone cannot distinguish between fat and lean tissue and therefore cannot clarify whether overweight and obesity in children with T1DM reflect true increases in adiposity.11 This is especially concerning during growth and development.12 Few studies have comprehensively examined fat and lean mass in pediatric T1DM, or the role of HbA1c and disease-related factors in body composition. 13 Glycated hemoglobin remains the standard marker of glycemic control, strongly linked to long-term complication risk.14 Moreover, regional fat distribution may influence insulin sensitivity, lipids, adipokines, and inflammation differently. 15
Vitamin D, a fat-soluble steroid hormone, is essential for calcium and bone homeostasis but also exerts wider effects due to receptors expressed in pancreatic β-cells and immune cells.16 Beyond skeletal health, vitamin D regulates immunity, reduces inflammation, and modulates glucose metabolism. Deficiency is a global health problem across all ages and sexes, 17 particularly in the Middle East. 18
In recent years, vitamin D’s extra-skeletal roles have attracted attention. Its receptors in β-cells and immune cells suggest potential involvement in T1DM pathogenesis.19 Evidence indicates that vitamin D modulates autoimmunity, enhances insulin secretion and sensitivity, and reduces complications.20 Supplementation in infancy has been linked to reduced risk of developing T1DM.21 Vitamin D also supports glycemic control by inhibiting inflammation, promoting insulin synthesis, and improving sensitivity.22
Vitamin D deficiency is highly prevalent in Egyptian pediatric population. In the general adolescent population, 94.8% were deficient and 4.2% insufficient.23 Among children with T1DM, deficiency rates were 84.9% versus 15.1% insufficiency, 24 while a more recent study reported 91.7% deficiency. 25
Overall, vitamin D deficiency is closely linked to T1DM occurrence, progression, and complications.26 It has been associated with ketoacidosis at onset, 27 poor glycemic control, 28 increased insulin needs, reduced sensitivity, higher fasting glucose, and elevated HbA1c. 29 Vitamin D also protects β-cells from immune attack, 30 and modulates T-cell differentiation and cytokine production, promoting anti-inflammatory pathways.31 Despite its importance, deficiency remains underestimated, highlighting the need for routine screening and supplementation in pediatric T1DM. 19
Finally, vitamin D deficiency has been inversely associated with obesity measures such as BMI, fat mass, and waist-to-hip ratio.32,33 Potential explanations include volumetric dilution, diminished hepatic hydroxylation, impaired cutaneous synthesis, decreased exposure to the sun, and altered receptor expression in adipose tissue. 34
Despite conflicting evidence, vitamin D deficiency remains a major concern in T1DM progression and prognosis. Data in Egyptian children with T1DM are scarce; therefore, we thought to investigate vitamin D state and its relation to body composition and glycemic control among the pediatric population. Therefore, the aim of this work was to: (i) assess vitamin D deficiency and insufficiency prevalence among T1DM pediatric patients (ii) identify factors associated with its deficiency, and (iii) examine associations between VD, body adiposity, and glycemic control among these patients.
Materials and Methods
Ethical approval
The study was approved by the National Research Centre Ethical Committee (Approval 16390). Written informed consents were obtained after explaining the study to the children’s parents or care givers.
Study design and settings
This present study was a cross-sectional study comprised 62 children with T1DM of both sexes aged 7-18 y. Patients were enrolled from the Diabetic Endocrine Metabolic Pediatric Unit outpatient clinic of Abu El-Rish Hospital Cairo University during the time from January 2018 – December 2018.
Participants
62 cases aged 7-18y already diagnosed with Type1 Diabetes and receiving insulin treatment > 1 year were enrolled. The diagnosis of T1DM was performed according to the International Society for Pediatric and Adolescent Diabetes (ISPAD) criteria.35 Only those not on vitamin D supplementation in the past 6 months were included.
Children with chronic diseases, e.g. hepatic, hyperparathyroidism, Celiac disease or receiving any drugs that can affect VD metabolism such as; phenytoin, phenobarbital, and thyroid hormone were excluded from the study. Children with micro- or macro-vascular complications, patients having serious pathological risk factors accompanying deficiency of vitamin D, like; osteogenesis imperfecta, renal affection or cystic fibrosis were not included.
The demographic and clinical data including onset of diabetes, insulin requirement (IU/Kg/day) were collected from medical records.
Each child was subjected to
Complete clinical examination.
Anthropometric examination
Confirming that the child wore minimal clothes and took off shoes, measures including weight assessed via a Seca scale (Seca Balance Beam Scale Model 700, seca deutschland Medical Scales and Measuring Systems; seca GmBH&Co. KG, Hamburg, Germany) to the nearest 0.01 kg, height assessed via Holtain stadiometer (The Harpenden Portable Stadiometer; Holtain Ltd, Cross well Pembrokeshire Wales, UK) to the nearest 0.1 cm. Mid-upper arm, waist, and hip circumferences assessed via non-elastic measuring tape to the nearest 0.1cm. Skinfold thicknesses were measured including; Biceps, triceps, suprailiac and subscapular skinfolds using Holtain skinfold caliper to the nearest 0.1 mm. The mean of three successive measurements was recorded. The instructions of the International Biological Program were followed.36 Some indices were calculated as BMI according to the following equation: BMI = weight (kg)/height (m2) and waist/hip ratio.
Fat % was estimated via body composition analyzer (Computerized Holtain Body Composition Analyzer, Holtain’s BCA, Crosswell No.646512; Holtain Ltd, Wales, UK).
The children’s nutritional status was assessed, conferring to the BMI-for-age Z-scores proposed by the WHO. 37 According to the WHO Growth Reference data for 5-19; BMI was classified as :
Normal: BMI for age z- score of < +1SD to > – 2SD
Overweight: BMI for age z- score of > +1SD
Obesity: BMI for age z- score of > +2 SD
Thinness: BMI for age z- score of <−2SD.
Severe thinness: BMI for age z- score of <−3SD.
Laboratory investigations: 5mL of blood were withdrawn from our cases and transferred within 1–2 h of collection time to the Clinical and Chemical pathology laboratory at the Medical Research center of Excellence at the National Research Centre for processing: part of the blood samples was used immediately for:
HbA1c: Glycated Hb (HbA1c) was done using nephelometric assay on mispa I2 from AGAPPE.
Glycemic control was determined as follows: HbA1c < 7% (‘good’ control). The HbA1c concentration ranged from 7 to 8% was considered as ‘inadequate’ control and ‘poor’ at concentrations more than 8%.38
The remaining blood samples were centrifuged and sera were separated and stored at −80C freezer for further evaluation of
25(OH) vitamin D: Serum 25-hydroxyvitamin D [25(OH) D] is the standard indicator of VD status.39 Concentrations of 25(OH) D were assayed by chemiluminescence immunoassay on Cobas e 411 (Roche).
Vitamin D deficiency threshold was 12 ng/mL and insufficiency level was 12-20 ng/mL. 25-OHD serum concentrations > 20 ng/mL were defined as vitamin D sufficiency. 40
Statistical analysis
Data were analyzed using the statistical package for social sciences, version 23.0 (SPSS Inc., Chicago, Illinois, USA). The normality of Data was examined using Kolmogorov-Smirnov and Shapiro-Wilk Test. The quantitative data were expressed as mean± SD when they were normally distributed and parametric tests were used, whereas data with non-normal distribution (non-parametric data) were expressed as median with inter-quartile range (IQR). Qualitative variables were expressed as number and percentages. The subsequent tests were used: Independent-samples t-test to compare between two means & Mann Whitney U test to compare two-groups with non-parametric data. Chi-square test and Fisher’s exact test were used to compare groups with qualitative data. Correlation was tested by Spearman’s correlation tests. P < 0.05 was considered significant.
Results
Demographic data
This study included 62 children with type 1 diabetes (T1D), comprising 34 (54.8%) females and 28 (45.2%) males, with a mean age of 10.88 ± 2.66 y (range: 6.9–17.4 y). The duration of diabetes ranged from 0 to 10 y, with a median of 2 years (IQR: 0.75–5).
Anthropometric Characteristics
The median BMI Z-score was –0.13 (IQR: –0.58 to 0.44; range: –1.56 to 2.46 kg/m²), while the mean body fat percentage was 22.00 ± 6.14%. Most participants (85.5%) had a normal BMI Z-score (< +1SD to > –2SD), whereas 11.3% were overweight and 3.2% were obese (Table 1).
Table 1: Z BMI distribution among the total studied patients.
| Z BMI | Total (n=62) |
| Normal (< +1SD to > – 2SD) | 53 (85.5%) |
| Overweight (> +1SD) | 7 (11.3%) |
| Obese (> +2 SD) | 2 (3.2%) |
| Total | 62 (100%) |
Vitamin D status
Serum vitamin D levels ranged between 1.4 and 15.2 ng/mL, with a median of 5.8 ng/mL (IQR: 3.78–9.6). The majority (90.3%) had vitamin D deficiency (mean = 6.15 ± 2.85 ng/mL), while 9.7% had vitamin D insufficiency (mean = 14.05 ± 1.00 ng/mL). None had sufficient vitamin D levels (> 20 ng/mL), table (2). Vitamin D concentrations were normally distributed (Kolmogorov–Smirnov p > 0.05), figure (1). No significant sex difference was detected in vitamin D levels (males: 6.23 ± 3.35 ng/mL; females: 7.47 ± 3.75 ng/mL; p = 0.177).
Table 2: Vitamin D level distribution and glycemic control among the total studied patients.
| Vitamin D level (ng/ml) | No. | % | |
| Deficiency | 56 | 90.3% | |
| Insufficiency | 6 | 9.7% | |
| Total | 62 | 100.0% | |
| HbA1C Level | No. | % | |
| Poor | 42 | 67.7% | |
| Inadequate | 12 | 19.4% | |
| Good Control | 8 | 12.9% | |
| Total | 62 | 100% |
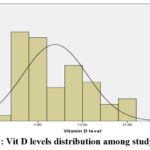 |
Figure 1: Vit D levels distribution among study group. |
The normality of Data was examined via Kolmogorov-Smirnov test of normality. The results of Kolmogorov-Smirnov test demonstrated that VD level had normal distribution among the study group (parametric data).
Comparison by Vitamin D Status
Children with vitamin D deficiency had significantly higher BMI (p < 0.001), higher body fat % (p = 0.024), and lower height Z-scores (p = 0.016) than those with insufficiency (Tables 3, 4). No significant differences were found in age, diabetes duration, or waist/hip indices (p > 0.05).
Table 3: Comparison of demographic parameters and Z BMI according to vitamin D distribution.
| Characteristics | Level of Vit. D | p-value | |
| DeficiencyN= 56 | InsufficiencyN=6 | ||
| Sex | |||
| Male | 27 (48.2%) | 1 (16.7%) | 0.140 |
| Female | 29 (51.8%) | 5 (83.3%) | |
| Duration | 2.5 (0.77 – 5.50) | 1.25 (0.15 – 2.75) | 0.169 |
| Age (years) | 11.05 ± 2.63 | 9.33 ± 2.67 | 0.135 |
| BMI | |||
| Normal | 49 (87.5%) | 4(66.7%) | <0.001* |
| Overweight | 5 (8.9%) | 2 (33.3%) | |
| Obese | 2 (3.6%) | 0 (0.0%) | |
IQR: Interquartile range, Using: U=Mann-Whitney test for Non-parametric data “Median (IQR)”; t-Independent Sample t-test for Mean±SD; x2: Chi-square test for Number (%) or Fisher’s exact test, when appropriate. *p-value <0.05 is significant.
Table 4: Comparing the anthropometric measurements according to vitamin D distribution.
| Anthropometric measurements | Level of Vit. D | p-value | |
| Deficiency | Insufficiency | ||
| ZWt | -0.44 (-0.84 – 0.28) | 0.03 (- 0.48 – 0.64) | 0.213 |
| ZHt | – 0.62 (-1.39 – 0.10) | – 0.56 (-5.32 – 0.43) | 0.016* |
| Z BMI | 0.52 (- 0.61 – 2.22) | – 0.14 (- 0.58- 0.30) | 0.024* |
| ZMUAC | -0.36(-0.91- 0.17) | 0.37(-0.80 – 0.98) | 0.185 |
| Waist C | 66.61 ± 7.92 | 66.33 ± 11.54 | 0.939 |
| Hip C | 77.54 ± 14.55 | 77.17 ± 12.92 | 0.952 |
| Waist/Hip | 0.85 (0.81 – 0.91) | 0.88 (0.81 – 0.89) | 0.760 |
| MUAC | 21.50 ± 3.82 | 21.49 ± 3.66 | 0.994 |
| Biceps | 7.75 (5.13 – 13.50) | 7.00 (6.00 – 9.88) | 0.724 |
| Triceps | 15.00 (9.75 – 25.63) | 15.00(11.13-19.38) | 0.478 |
| SubscapSF | 11.00 (6.75 – 23.38) | 11.00 (7.13 – 14.75) | 0.478 |
| SupraIlSF | 10.25 (7.00 – 14.00) | 7.50 (6.00 – 21.63) | 0.679 |
| Fat % | 27.33 ± 7.04 | 21.43 ± 5.82 | 0.024* |
IQR: Interquartile range, Using: U=Mann-Whitney test for Non-parametric data “Median (IQR)”; t-Independent Sample t-test for Mean±SD; *p-value <0.05 is significan
Glycemic Control
The mean HbA1c among all patients was 8.62 ± 1.58 % (range = 5.5–12). Most participants (67.7%) had poor glycemic control (HbA1c > 8%), while 12.9% achieved good control (HbA1c < 7%) (Table 2).
Vitamin D deficiency was present in 85.7% of patients with poor glycemic control and in all patients with good control. Although mean HbA1c was higher among vitamin D–deficient patients (9.70 ± 1.28%) than among those with insufficiency (8.50 ± 1.58%), the difference was not statistically significant (p = 0.077), table (5).
The duration of diabetes was significantly longer in those with poor glycemic control (median = 3.00 years; IQR: 1.15–5.71) than in those with inadequate (0.88 years; p < 0.05) or good control (1.04 years; p < 0.05), table (6).
Table 5: Comparison of laboratory findings according to vitamin D distribution.
| Laboratory data | Level of Vit. D | p-value | |
| DeficiencyN=56 | InsufficiencyN=6 | ||
| Vitamin D level(ng/ml) | 6.15±2.85 | 14.05±1.00 | <0.001** |
| HbA1C (gm%) | 9.70±1.28 | 8.50±1.58 | 0.077 |
| HbA1C Level | |||
| Poor | 36 (64.3%) | 6 (100 %) | 0.206 |
| Inadequate | 12 (21.4%) | 0(0.0%) | |
| Good Control | 8 (14.3%) | 0 (0.0%) | |
Using: t-Independent Sample t-test for Mean±SD; x2: Chi-square test for Number (%) or Fisher’s exact test, when appropriate. *p-value <0.05 is significant.
Table 6: Comparison of demographic parameters and Z BMI according to glycemic control.
| Characteristics | HbA1C Level | P value | ||
| PoorN=42 | InadequateN=12 | Good ControlN=8 | ||
| Sex | ||||
| Male | 18 (42.9%) | 7 (58.3%) | 3 (37.5%) | 0.571 |
| Female | 24 (57.1%) | 5 (41.7%) | 5 (62.5%) | |
| Duration of diabetes (years) | 3.00 (1.15- 5.71) A | 0.88 (0.35 – 1.75) B | 1.04 (0.56 – 4.92) B | 0.049* |
| Age (years) | 11.17±2.85 | 10.49±2.32 | 9.94±2.04 | 0.421 |
| ZBMI classification | ||||
| Normal | 37 (88.1%) | 10 (83.3%) | 6 (75.0%) | 0.611 |
| Overweight & Obese | 5 (11.9%) | 2 (16.7%) | 2 (25.0%) | |
IQR: Interquartile range, Using: One way Analysis of Variance test was performed for Mean±SD & Multiple comparison between groups through Post Hoc test: Tukey’s test, Kruskal–Wallis was performed for Median (IQR) & Multiple comparison between groups through Mann-Whitney test, x2: Chi-square test for Number (%) or Fisher’s exact test, when appropriate. Different capital letters indicate significant difference at (p<0.05) among means in the same row. *p-value <0.05 is significant.
Anthropometry and Glycemic Control
Hip circumference was significantly lower among patients with good glycemic control compared to those with inadequate or poor control (p = 0.008), whereas waist-to-hip ratio was significantly higher (p = 0.016). No significant differences were observed in BMI Z-scores or body fat % (p > 0.05), table (7).
Table 7: Comparison of anthropometric measurements according to the glycemic control.
| Anthropometric measurements | HbA1C Level | Pvalue | ||
| PoorN=42 | InadequateN=12 | Good ControlN=8 | ||
| zWt | -0.23(-0.80- 0.31) | -0.65(-0.87 – – 0.38) | -0.55 (-0.64 – 0.67) | 0.586 |
| zHt | -0.52(-1.23- 0.19) | -1.35(-2.15 – – 0.60) | -0.47(-0.71 – 0.06) | 0.904 |
| Waist C | 67.19±7.92 | 64.71±10.03 | 66.19±7.33 | 0.654 |
| Hip C | 80.55±11.48 A | 75.92±10.09 B | 63.94±24.11 C | 0.008* |
| zMUAC | -0.24(-0.84- 0.30) | -0.60 (-1.11 – 0.20) | -0.24(-0.90 – 0.94) | 0.708 |
| Biceps | 7.00(6.00- 10.15) | 6.25(5.00 – 11.25) | 8.25(6.25 – 10.55) | 0.688 |
| Triceps | 14.50(11.00-19.25) | 15.25(12.00 – 19.88) | 14.75(9.88 – 21.30) | 0.969 |
| SubscapSF | 11.00(7.75- 15.70) | 9.50(7.00 – 15.25) | 11.50(7.25 – 14.00) | 0.534 |
| SupraIlSF | 11.00(7.00- 14.00) | 8.60(6.05 – 13.00) | 10.00(6.65 – 15.25) | 0.484 |
| zBMI | – 0.08 (- 0.57- 0.57) | – 0.34 (-0.56 – 0.02) | -0.10 (- 0.60 – 0.89) | 0.727 |
| Waist/Hip | 0.84 (0.80- 0.88) B | 0.90 (0.83 – 0.93) A | 0.91(0.84 – 1.23) A | 0.016* |
| Fat Percent | 22.45±6.74 | 20.45±3.57 | 22.01±6.06 | 0.618 |
IQR: Interquartile range,Using: One way Analysis of Variance (ANOVA) test was performed for Mean±SD & Multiple comparison between groups through Post Hoc test: Tukey’s test, Kruskal–Wallis was performed for Median (IQR) & Multiple comparison between groups through Mann-Whitney test. Different capital letters indicate significant difference at (p<0.05) among means in the same row. *p-value <0.05 is significant.
Furthermore, there was no significant difference in vitamin D levels between the three groups of glycemic control (p > 0.05). While, there was a significant difference in HbA1c level between the three groups (p = 0.001), table (8).
Table 8: Comparison of laboratory findings according to glycemic control.
| Laboratory data | HbA1C Level | p-value | ||
| Poor | Inadequate | Good Control | ||
| Vitamin D level (ng/ml) | 4.58±2.46 | 6.58±2.98 | 7.45±3.80 | 0.109 |
| HbA1C (gm%) | 9.46±1.12 A | 7.29±0.28 B | 6.18±0.56 C | <0.001** |
Using: One way Analysis of Variance test was performed for Mean±SD & Multiple comparison between groups through Post Hoc test: Tukey’s test. Different capital letters indicate significant difference at (p<0.05) among means in the same row. *p-value <0.05 is significant.
Correlation Analysis
Vitamin D levels showed no significant correlation with anthropometric or metabolic parameters (p > 0.05). A weak negative correlation was noted between vitamin D and body fat % (r = –0.234, p = 0.068), and a weak positive but non-significant correlation with HbA1c (r = 0.210, p = 0.102), table (9).
Table 9: Correlation between vitamin D levels with different parameters among the T1D patients.
| Parameter | Vitamin D level | |
| R | P | |
| Duration | -0.029 | 0.823 |
| Age (years) | -0.148 | 0.252 |
| zWt | 0.006 | 0.965 |
| zHt | -0.044 | 0.736 |
| Waist C | -0.054 | 0.678 |
| Hip C | -0.073 | 0.575 |
| MUAC | -0.002 | 0.987 |
| Biceps SF | 0.021 | 0.872 |
| Triceps SF | 0.068 | 0.600 |
| Subscap SF | -0.077 | 0.554 |
| SupraIl SF | -0.117 | 0.367 |
| zBMI | -0.011 | 0.931 |
| Waist/Hip | 0.138 | 0.284 |
| Fat Percent | – 0.234 | 0.068 |
| HbA1C | 0.210 | 0.102 |
Using Spearman’s rank correlation coefficient (r), p< 0.05= significant.
Discussion
Vitamin D deficiency (VDD) is highly prevalent among children with type 1 diabetes mellitus (T1DM), although reported rates vary widely across populations. Despite growing global interest, Egyptian data remain limited. The present study evaluated vitamin D status in Egyptian pediatric T1DM patients and explored its relationship with anthropometric parameters and glycemic control. To our knowledge, this is the first Egyptian study to simultaneously investigate these associations in both children and adolescents with T1DM.
The main findings of this study were: (i) a remarkably high prevalence of vitamin D deficiency (90.3%), with no participants showing sufficiency; (ii) vitamin D–deficient patients had significantly higher BMI Z-scores, greater body-fat percentages, and lower height Z-scores compared with those who were insufficient; and (iii) poor glycemic control was common (67.7% with HbA1c > 8%), although no significant correlation was observed between vitamin D levels and HbA1c.
Previous studies have reported variable rates of VDD among diabetic children. One study found combined deficiency and insufficiency in 64.2% of newly diagnosed cases versus 41.6% in established patients. ⁴1 Similarly, others reported significantly lower mean vitamin D levels in pediatric T1DM patients than in controls, ⁴2 consistent with earlier evidence linking low vitamin D levels to increased T1DM risk. ⁴3 Conversely, a Finnish cohort found no relationship between serum 25(OH)D and diabetes development. ⁴4
Marked geographic differences have also been observed. In Turkey, deficiency reached 42.9% among adolescents, with vitamin D levels declining with age and being lowest in late-adolescent females. ⁴5 In contrast, our cohort showed universal deficiency or insufficiency, with no significant sex or age differences. Such discrepancies likely reflect differences in sunlight exposure, seasonal variation, diet, and lifestyle. Supporting this, a Ukrainian study reported predominantly normal vitamin D levels, ⁴6 while data from the UAE showed deficiency to be more frequent among controls than diabetic patients, likely due to routine supplementation in diabetics. ⁴7 In contrast, reports from Kuwait and Egypt consistently demonstrate markedly higher deficiency rates, 48˒49 although some investigators found comparable prevalence in diabetic and non-diabetic children .50 Additional mechanisms, such as urinary loss of vitamin D-binding protein, may also contribute. 51
The relationship between vitamin D and glycemic control remains controversial. In our study, most participants exhibited poor glycemic control, consistent with the Diabetes Control and Complications Trial (DCCT) findings that achieving optimal control in adolescents is particularly challenging. 52 Longer diabetes duration was significantly associated with poorer HbA1c values, supporting prior evidence that glycemic control tends to worsen over time due to β-cell exhaustion and behavioral factors. Despite widespread deficiency, vitamin D levels were not significantly correlated with HbA1c, suggesting that glycemic control is more influenced by adherence to insulin therapy and lifestyle factors than by vitamin D status alone.
Our findings are consistent with several reports showing no significant relationship between serum 25(OH)D and HbA1c. 45,53,54 Conversely, other studies have documented an inverse correlation between vitamin D and HbA1c, implying a contributory role of deficiency in poor glycemic control. 55-57 Interventional studies have also yielded mixed results, some reporting improved HbA1c after vitamin D supplementation, 58-60 while others observed no significant change. 61 These discrepancies likely reflect variations in baseline vitamin D status, study design, dosage, duration, and ethnic or genetic background.
The relationship between vitamin D and adiposity is equally complex. In our cohort, vitamin D–deficient patients had higher BMI Z-scores (p = 0.024) and greater body-fat percentages (p = 0.024), although no direct correlation between vitamin D levels and adiposity indices was detected. Similar inverse relationships have been described in both diabetic and non-diabetic populations, 62, 63 while some studies reported no association.64˒65 Proposed mechanisms include sequestration of vitamin D in adipose tissue, reducing its bioavailability, 66 and modulation of adipocyte differentiation and metabolism. 67 Meta-analyses have shown inconsistent outcomes, some indicating inverse associations with fat mass, 68 and modest benefits of supplementation on BMI and waist circumference, 69 whereas others found little or no effect. 70,71
Vitamin D status may also influence growth and body composition in T1DM. In this study, children with deficiency had significantly reduced height Z-scores compared with those with insufficiency (p = 0.016), and females demonstrated higher body-fat percentages, in line with previous observations. 53,72 These alterations may be attributed to the combined effects of vitamin D deficiency, insulin therapy, nutritional intake, and pubertal hormonal changes. Given vitamin D’s role in skeletal development and bone-mass accrual, maintaining optimal vitamin D status is crucial for long-term growth and bone health in pediatric T1DM.
Anthropometric analysis revealed that hip circumference was lowest among patients with good glycemic control, whereas the waist-to-hip ratio was highest. This may reflect differences in fat distribution patterns and their metabolic implications. Visceral adiposity is more strongly linked to insulin resistance and inflammation than subcutaneous fat, explaining why BMI alone may not sufficiently reflect metabolic risk. 73
Taken together, our findings highlight the multifaceted role of vitamin D in T1DM. Although deficiency is nearly universal in our cohort, its association with glycemic control, adiposity, and growth remains inconclusive. Geographic, environmental, and genetic factors likely contribute to these variations. Nonetheless, the consistently high prevalence of deficiency underscores the need for routine screening and correction as part of comprehensive care in children with T1DM.
Limitations
This study has several limitations that should be acknowledged. First, its cross-sectional design precludes establishing a causal relationship between vitamin D status and glycemic control, adiposity, or growth parameters. Longitudinal or interventional studies would be more suitable for assessing temporal associations. Second, the relatively small sample size may limit the generalizability of our findings to the wider Egyptian pediatric population. Third, seasonal variation in sunlight exposure was not accounted for, and since serum 25(OH)D levels fluctuate with sun exposure, this might have influenced the measured vitamin D concentrations. Fourth, dietary intake and supplement use were not quantitatively assessed, which could have contributed to individual variability in vitamin D levels. Finally, other relevant biochemical markers, such as parathyroid hormone (PTH), calcium, phosphorus, and bone mineral density, were not evaluated, which might have provided additional insight into vitamin D metabolism and skeletal outcomes in T1DM.
Despite these limitations, the study’s strengths include a well-characterized pediatric diabetic cohort, the use of standardized anthropometric and biochemical assessments, and focus on a geographically underrepresented population; Egyptian children and adolescents with T1DM, adding valuable regional data to the global literature.
Conclusion
This study demonstrates an alarmingly high prevalence of vitamin D deficiency among Egyptian children and adolescents with type 1 diabetes mellitus. Vitamin D deficient patients exhibited higher BMI Z-scores, increased body fat percentage, and lower height Z-scores. However, no significant relationship was observed between vitamin D levels and glycemic control.
These findings suggest that while vitamin D deficiency is highly prevalent and associated with adverse anthropometric outcomes, its impact on glycemic regulation remains uncertain. The study underscores the need for routine screening and supplementation strategies to correct vitamin D deficiency in pediatric T1DM patients as part of comprehensive disease management. Future prospective interventional studies are warranted to clarify the causal pathways linking vitamin D status, adiposity, and metabolic control in diabetic youth.
Acknowledgement
We thank the National research Centre of Egypt for the financial support and sponsorship.
Funding Source
Financial support and sponsorship was done by National Research Centre, Project Number (11010111) from 2016 to 2019.
Conflict of interest
The authors do not have any conflict of interest.
Data Availability Statement
This statement does not apply to this article.
Ethics Statement
The study was approved by the National Research Centre Ethical Committee (Approval 16390). Written informed consents were obtained after explaining the study to the children’s parents or care givers. The study was carried out accordance with national regulations, institutional guidelines, and The Declaration of Helsinki’s ethical guidelines.
Informed Consent Statement
Informed consent was obtained from the patients’ parents or guardians.
Clinical Trial Registration
This research does not involve any clinical trials.
Permission to reproduce material from other sources
Not Applicable
Author contributions
- Wafaa Abdel Samie Kandeel: Conceptualization, design of the study, supervision and revision of the final manuscript.
- Ahmed Sayed Ismail: clinical, anthropometric examination of patients and collection of data,
- Mona Abdelkader Mohamed Awad: laboratory investigations,
- Eman Refaat Youness: laboratory investigations.
- Hanaa Reyad Abdallah: clinical, anthropometric examination of patients and collection of data, interpretation of results, writing the original draft, reviewing and editing the final manuscript.
References
- Ferraz R.S., Silva C.S., Cavalcante G.C., de Queiroz N.N.M., Felício K.M., Felício J.S., Ribeiro-Dos-Santos Â. Variants in the VDR Gene May Influence 25(OH)D Levels in Type 1 Diabetes Mellitus in a Brazilian Population. Nutrients. 2022;14:1010. doi: 10.3390/nu14051010.
CrossRef - Shaker Al-Awady M, Mohammed Ali B. Effect of vitamin D supplementation on Glycemic control in type 1 diabetes mellitus. Cellular, Molecular and Biomedical Reports. 2024; 189-198. doi: 10.55705/cmbr.2024.436594.1218.
CrossRef
- Ogurtsova K., Guariguata L., Barengo N. C., et al. IDF diabetes atlas: global estimates of undiagnosed diabetes in adults for 2021. Diabetes Research and Clinical Practice. 2022;183:p. 109118. doi: 10.1016/j.diabres.2021.109118.
CrossRef - Centers for Disease Control and Prevention. Just Diagnosed with Type 1 Diabetes. Last Reviewed: December 30, 2022.
- Centers for Disease Control and Prevention (CDC). Prevalence of Diagnosed Diabetes. Last Reviewed: September 30, 2022.
- Guo L., Li Y., Zhang M., Xiao X., Kuang H., Yang T. et al. Efficacy of unblinded and blinded intermittently scanned continuous glucose monitoring for glycemic control in adults with type 1 diabetes. Front. Endocrinol. 2023;14:1110845. doi: 10.3389/fendo.2023.1110845.
CrossRef - Levran N., Levek N., Sher B., Gruber N., Afek A., Monsonego-Ornan E., Pinhas-Hamiel O. The Impact of a Low-Carbohydrate Diet on Micronutrient Intake and Status in Adolescents with Type 1 Diabetes. Nutrients. 2023;15:1418. doi: 10.3390/nu15061418. [DOI] [PMC free article] [PubMed] [Google Scholar] CrossRef
- Dos Santos Haber J.F., Barbalho S.M., Sgarbi J.A., de Argollo Haber R.S., de Labio R.W., Laurindo L.F., et al. The Relationship between Type 1 Diabetes Mellitus, TNF-α, and IL-10 Gene Expression. Biomedicines. 2023;11:1120. doi: 10.3390/biomedicines11041120. [DOI] [PMC free article] [PubMed] [Google Scholar] CrossRef
- Kahkoska A.R., Sarteau A.C., Igudesman D., Reboussin B.A., Dabelea D., Dolan L.M.,et al. Association of Insulin Regimen and Estimated Body Fat Over Time among Youths and Young Adults with Type 1 Diabetes: The SEARCH for Diabetes in Youth Study. J. Diabetes Res. 2022:1054042. doi: 10.1155/2022/1054042.
CrossRef - Calella P, Gallè F, Fornelli G, Liguori G, Valerio G. Type 1 diabetes and body composition in youth: a systematic review. Diabetes Metab Res Rev. 2020; 36:e3211. 10.1002/dmrr.3211.
CrossRef - Liang J, Chen Y, Zhang J, Ma B, Hu Y, Liu Y, et al. Associations of weight-adjusted body fat and fat distribution with bone mineral density in Chinese children aged 6–10 years. Int J Environ Res Public Health. 2020; 17:1763. 10.3390/ijerph17051763.
CrossRef - Zheng Y, Rostami Haji Abadi M, Gough J, Johnston JJD, Nour M, Kontulainen S. Higher Body Fat in Children and Adolescents With Type 1 Diabetes-A Systematic Review and Meta-Analysis. Front Pediatr. 2022;10:911061. doi: 10.3389/fped.2022.911061. PMID: 35813369; PMCID: PMC9263393.)
CrossRef - Gomez-Peralta F., Choudhary P., Cosson E., Irace C., Rami-Merhar B., Seibold A. Understanding the clinical implications of differences between glucose management indicator and glycated haemoglobin. Diabetes Obes. Metab. 2022;24:599–608. doi: 10.1111/dom.14638.
CrossRef - Guan Y., Zuo F., Zhao J., Nian X., Shi L., Xu Y., Huang J., Kazumi T., Wu B. Relationships of adiponectin to regional adiposity, insulin sensitivity, serum lipids, and inflammatory markers in sedentary and endurance-trained Japanese young women. Front. Endocrinol. 2023;14:1097034. doi: 10.3389/fendo.2023.1097034.
CrossRef - Rebelos E, Tentolouris N, Jude E. The role of vitamin D in health and disease: a narrative review on the mechanisms linking vitamin D with disease and the effects of supplementation. Drugs. 2023;83(8):665-85. doi:10.1007/s40265-023-01875-8.
CrossRef - Holick MF. The vitamin D deficiency pandemic: approaches for diagnosis, treatment and prevention. Rev Endocr Metab Disord. 2017;18(2):153–65. doi: 10.1007/s11154-017-9424-1.
CrossRef - Palacios C, Gonzalez L. Is vitamin D deficiency a major global public health problem? J Steroid Biochem Mol Biol. 2014;144:138–45. doi: 10.1016/j.jsbmb.2013.11.003.
CrossRef - Palacios C, Gonzalez L. Is vitamin D deficiency a major global public health problem? J Steroid Biochem Mol Biol. 2014;144:138–45. doi: 10.1016/j.jsbmb.2013.11.003.
CrossRef - Infante M, Ricordi C, Sanchez J, et al. Influence of vitamin D on islet autoimmunity and beta‐cell function in type 1 diabetes. Nutrients. 2019;11(9):2185. 10.3390/nu11092185. PMID: 31514368; PMCID: PMC6769474.
CrossRef - Lopes M, Laiginhas R, Madeira C, et al. Association between serum vitamin d and diabetic retinopathy in portuguese patients with type 1 diabetes. Acta Médica Portuguesa. 2020;33(7–8):459‐465.
CrossRef - Durá-Travé T, Gallinas-Victoriano F. Type 1 Diabetes Mellitus and Vitamin D. Int J Mol Sci. 2025 May 11;26(10):4593. doi: 10.3390/ijms26104593. PMID: 40429738; PMCID: PMC12110774.
CrossRef - Ge L, Gao S, Kia N, Wang Y, Hua L. Effect of vitamin D supplementation on body composition, lipid profile, and glycemic indices in patients with obesity-associated metabolic syndrome: a systematic review and meta-analysis. Diabetol Metab Syndr. 2025 Jul 18;17(1):287. doi: 10.1186/s13098-025-01799-1. PMID: 40682197; PMCID: PMC12275322.
CrossRef - Sherief LM, Ali A, Gaballa A, Abdellatif GM, Kamal NM, Afify MR, et l. Vitamin D status and healthy Egyptian adolescents: Where do we stand? Medicine (Baltimore). 2021;100(29):e26661. doi: 10.1097/MD.0000000000026661. PMID: 34398026; PMCID: PMC8294863.
CrossRef - Soliman GT, Ali BA, Mohamed AA, Mahmoud AM, Abdellatif AA () Assessment of Vitamin D Status in Egyptian Children with Type-1 Diabetes Mellitus. J Diabetes Metab. 2015; 6:573.
CrossRef - Hafez M., Hassan M., Musa N., Atty S.A., Azim S.A. Vitamin D status in Egyptian children with type 1 diabetes and the role of vitamin D replacement in glycemic control. Journal of Pediatric Endocrinology & Metabolism. 2016;29(12):1379-1385. doi:10.1515/jpem-2016-0292
CrossRef - Bae K. N., Nam H. K., Rhie Y. J., Song D. J., Lee K. H. Low levels of 25-hydroxyvitamin D in children and adolescents with type 1 diabetes mellitus: a single center experience. Annals of Pediatric Endocrinology & Metabolism . 2018;23(1):21–27. doi: 10.6065/apem.2018; 23.1.21.
CrossRef - Singh M. K., Sachdeva N., Singhi S., Attri S. V., Jayashree M., Bhalla A. K. Vitamin D levels during and after resolution of ketoacidosis in children with new onset type 1 diabetes. Diabetic Medicine, 2013;30(7):829–834. doi: 10.1111/dme.12200.
CrossRef - Ordooei M., Shojaoddiny-Ardekani A., Hoseinipoor S. H., Miroliai M., Zare-Zardini H. Effect of vitamin D on HbA1c levels of children and adolescents with diabetes mellitus type 1. Minerva Pediatrica . 2017;69(5):391–395. doi: 10.23736/S0026-4946.16.04145-1.
CrossRef - Jacobsen R, Frederiksen P, Heitmann BL. Exposure to sunshine early in life prevented the development of type 1 diabetes in Danish boys. J Pediatr Endocrinol Metab. 2016;29:417‐424.
CrossRef - Caprio M., Infante M., Calanchini M., Mammi C., Fabbri A. Vitamin D: not just the bone. Evidence for beneficial pleiotropic extraskeletal effects. Eating and Weight Disorders. 2017;22(1):27–41. doi: 10.1007/s40519-016-0312-6. [DOI] [PubMed] [Google Scholar] CrossRef
- Rak K., Bronkowska M. Immunomodulatory effect of vitamin D and its potential role in the prevention and treatment of type 1 diabetes mellitus-a narrative review. Molecules. 2019;24(1):p. 53. doi: 10.3390/molecules24010053
CrossRef - Lee HA, Kim YJ, Lee H, Gwak HS, Park EA, Cho SJ, et al. Association of vitamin D concentrations with adiposity indices among preadolescent children in Korea. J Pediatric Endocrinol Metab. 2013;26(9–10):849–854. doi: 10.1515/jpem-2012-0416.
CrossRef - Zakharova I, Klimov L, Kuryaninova V, Nikitina I, Malyavskaya S, Dolbnya S, et al. Vitamin D Insufficiency in Overweight and Obese Children and Adolescents. Front Endocrinol (Lausanne). 2019;10:103.
CrossRef - Karampela I, Sakelliou A, Vallianou N, Christodoulatos G-S, Magkos F, Dalamaga M. Vitamin D and Obesity: Current Evidence and Controversies. Curr Obes Rep. 2021;10(2):162–180. doi: 10.1007/s13679-021-00433-1.
CrossRef - Libman IM, Haynes A, Lyons S, Pradeep P, Rwagasor E, Tung JY-L, Jefferies CA, Oram RA, Dabelea D, Craig ME, et al. ISPAD Clinical Practice Consensus Guidelines 2022: Definition, epidemiology, and classification of diabetes in children and adolescents. Pediatric Diabetes. 2022;23(8):1160-1174. doi:10.1111/pedi.13454.
CrossRef - Hiernaux J, Tanner JM. Growth and physical studies. In: Weiner JS, Lourie SA, editors. Human biology: a guide to field methods. 2nd ed. IBP. London, Oxford: Blackwell Scientific Publications;
- https://www.who.int/tools/growth-reference-data-for-5to19-years/indicators/bmi-fora. accessed at 29 November, 2023.
- Glycemic targets: Standards of medical care in diabetes-2020. Diabetes Care. 2020; 43 (Supplement 1):S66-76.
CrossRef - Cashman KD, van den Heuvel EG, Schoemaker RJ, Prévéraud DP, Macdonald HM, Arcot J. 25-Hydroxyvitamin D as a biomarker of vitamin D status and its modeling to inform strategies for prevention of vitamin D deficiency within the population. Adv Nutr. 2017;8(6):947-957. 10.3945/an.117.015578. PMID: 29141976.
CrossRef - Munns CF, Shaw N, Kiely M, Specker BL, Thacher TD, Ozono K, et al.,. Global Consensus Recommendations on Prevention and Management of Nutritional Rickets. J Clin Endocrinol Metab.2016;101:394–415.
CrossRef - Liu X, Nelson K, Baylin A, Bertoni AG, Shoham D. Association of 25-hydroxyvitamin D with adiposity in US children. J Pediatr. 2018;198:255-61.e1. doi:10.1016/j.jpeds.2018.02.042. PMID:29580750; PMCID:PMC5909670.
CrossRef - Rasoul MA, Al-Mahdi M, Al-Qattan H, Elkum N. Vitamin D deficiency in Kuwaiti children with type 1 diabetes mellitus. Eur J Pediatr. 2016;175(1):71-9. doi:10.1007/s00431-015-2606-4. PMID:26341945.
- Liu X, Baylin A, Levy J. Vitamin D deficiency and insufficiency among US children: prevalence, predictors, and associations with cardiometabolic risk. Arch Pediatr Adolesc Med. 2015;169(7):623-32. doi:10.1001/jamapediatrics.2015.1054. PMID:26053988.
- Mäkinen M, Mykkänen J, Koskinen M, Simell V, Veijola R, Hyöty H, et al. Serum 25-hydroxyvitamin D concentrations in children progressing to type 1 diabetes. Diabetologia. 2016;59(5):1179-87. doi:10.1007/s00125-016-3903-9. PMID:26951238.
CrossRef - Taşkın N, Cekmez F, Aydemir G, Erel O, Cekmez Y, Bideci A, et al. Vitamin D status in Turkish adolescents with type 1 diabetes and its relation to metabolic control. J Pediatr Endocrinol Metab. 2020;33(4):539-47. doi:10.1515/jpem-2019-0460. PMID:32243242.
CrossRef - Burlaka I, Mityuryayeva T. Vitamin D status in Ukrainian children and adolescents with type 1 diabetes mellitus. Endocr Regul. 2022;56(1):35-41. doi:10.2478/enr-2022-0006. PMID:35521850.
CrossRef - Majeed M, Alshamsi S, Al Busaidi A, et al. Vitamin D deficiency and glycemic control in children and adolescents with type 1 diabetes mellitus in the UAE. Nutrients. 2023;15(3):552. doi:10.3390/nu15030552. PMID:36767812; PMCID:PMC9902981.
- Al-Awady MJ, Abbas AA, Salman AM, et al. Vitamin D deficiency in children and adolescents with type 1 diabetes mellitus in Iraq: prevalence and determinants. BMC Endocr Disord. 2023;23:112. doi:10.1186/s12902-023-01358-9. PMID:37427493.
- El-Asheer OM, El-Shafie AM, Khalaf H, Mohamed AS, Hussein SH. Vitamin D status in children with type 1 diabetes mellitus in Upper Egypt. BMC Endocr Disord. 2023 ;23(1):46. doi:10.1186/s12902-023-01240-8. PMID:36879148; PMCID:PMC9983817.
- Isa HM, Almaliki M. Vitamin D deficiency in children with type 1 diabetes compared with healthy controls in Bahrain. Ann Saudi Med. 2020;40(6):450-457. doi:10.5144/0256-4947.2020.450. PMID:33475188.
- Thrailkill KM, Jo CH, Cockrell GE, Moreau CS, Lumpkin CK Jr, Fowlkes JL. Enhanced excretion of vitamin D binding protein in type 1 diabetes: a role in vitamin D deficiency? J Clin Endocrinol Metab. 2011;96(1):142-9. doi:10.1210/jc.2010-0980. PMID:21047923.
CrossRef - The Diabetes Control and Complications Trial Research Group (DCCT). The effect of intensive treatment of diabetes on the development and progression of long-term complications in insulin-dependent diabetes mellitus. N Engl J Med. 1993 Sep;329(14):977-86. doi:10.1056/NEJM199309303291401. PMID:8366922.
CrossRef - Zabeen B, Nahar J, Ahmed B, Tayyeb S, Islam N, Azad K. Vitamin D status in children and adolescents with type 1 diabetes in a specialized diabetes care centre in Bangladesh. Endocrinol Diabetes Metab. 2022;5(1):e00312. doi:10.1002/edm2.312. PMID:34766458; PMCID:PMC8754235.
CrossRef - Carakushansky M, Boney CM, Murray PJ, Motaghedi R, Love-Osborne K, Alonso LC. Vitamin D status and type 1 diabetes in children: a cross-sectional study in Central Florida. Pediatr Diabetes. 2020;21(7):1289-96. doi:10.1111/pedi.13089. PMID:32557506.
CrossRef - Savastio S, Cadario F, Genoni G, Bellomo G, Bagnati M, Vidali M, et al. Vitamin D deficiency and glycemic status in children and adolescents with type 1 diabetes mellitus. PLoS One. 2016;11(9):e0162554. doi:10.1371/journal.pone.0162554. PMID:27611774; PMCID:PMC5015977.
CrossRef - Wierzbicka E, Swiatkowska E, Głowińska-Olszewska B, Luczyński W, Bossowski A. Decreased serum 25(OH) vitamin D concentration in Polish adolescents with type 1 diabetes. Exp Clin Endocrinol Diabetes. 2016;124(9):618-22. doi:10.1055/s-0042-109527. PMID:27483106.
- Ashrit P, Krishnamurthy N, Gopalakrishnan S. Vitamin D deficiency in children with type 1 diabetes mellitus. Int J Contemp Pediatr. 2016;3(2):371-5. doi:10.18203/2349-3291.ijcp20161019.
CrossRef - Ordooei M, Ghasemi N, Movahedian M, et al. Effect of vitamin D supplementation on glycemic control in children with type 1 diabetes mellitus and vitamin D deficiency. Iran J Pediatr. 2017;27(2):e8011. doi:10.5812/ijp.8011.
- Bogdanou D, Penna-Martinez M, Filmann N, et al. Effect of vitamin D supplementation on HbA1c levels in children and adolescents with type 1 diabetes mellitus: a randomized clinical trial. Horm Res Paediatr. 2017;87(1):38-47. doi:10.1159/000452973. PMID:27951575.
CrossRef - Hafez M, Youssef A, El Dayem S, Tawfik M, Elhaddad A, Zaki A, et al. Vitamin D status in Egyptian children and adolescents with type 1 diabetes mellitus. J Diabetes Res. 2017;2017:5612852.doi:10.1155/2017/ 5612852.PMID:28473975; PMCID:PMC5408126.
- Nwosu BU, Maranda L. The effects of vitamin D supplementation on glycemic control and insulin resistance in children with type 1 diabetes. J Pediatr Endocrinol Metab. 2014;27(5-6):539-46. doi:10.1515/jpem-2013-0283. PMID:24840206.
- Cediel G, Corvalán C, Aguirre C, de Romaña DL, Uauy R. Serum 25-hydroxyvitamin D associated with indicators of body fat and insulin resistance in prepubertal Chilean children. Int J Obes (Lond). 2016 Jan;40(1):147-52. doi:10.1038/ijo.2015.148. PMID:26220717.
CrossRef - Sadiya A, Ahmed SM, Carlsson M, Tesfa Y, George M, Ali SH, et al.Vitamin D status and body fat distribution in type 2 diabetes mellitus in the UAE. J Diabetes Res. 2014;2014:869083. doi:10.1155/2014/869083. PMID:24895595; PMCID:PMC4026283.
- Aypak C, Türedi O, Yüce A, Görpelioğlu S. The relationship of vitamin D status with obesity and insulin resistance in obese children and adolescents. J Pediatr Endocrinol Metab. 2014;27(7-8):743-9. doi:10.1515/jpem-2013-0399. PMID:24842336.
CrossRef - Walsh JS, Bowles S, Evans AL. Vitamin D in obesity. Curr Opin Endocrinol Diabetes Obes. 2017;24(6):389-94. doi:10.1097/MED.0000000000000370. PMID:28953151.
CrossRef - Kron-Rodrigues A, Rodrigues AL, Almeida FL, et al. Vitamin D and adipose tissue: effects on differentiation and metabolism. Endocr Connect. 2021;10(5):R94-R105. doi:10.1530/EC-20-0573. PMID:33834934.
- Golzarand M, Hollis BW, Mirmiran P, Wagner CL, Shab-Bidar S. Vitamin D supplementation and body composition in adolescents: a systematic review. Br J Nutr. 2017;117(7):989-1001. doi:10.1017/S0007114517000688. PMID:28502244.
- Musazadeh V, Sheikhi A, Jamali R, et al. Effects of vitamin D supplementation on anthropometric indices and body composition in overweight and obese children and adolescents: a systematic review and meta-analysis. Front Nutr. 2022;9:870063. doi:10.3389/fnut.2022.870063. PMID:35707007; PMCID:PMC9195663.
- Saha S. Vitamin D supplementation and obesity in children: systematic review. J Clin Res Pediatr Endocrinol. 2021;13(2):220-7. doi:10.4274/jcrpe.galenos.2020.2020.0172. PMID:32894238; PMCID:PMC8139517.
- Wang H, Chen W, Li D, Yin X, Zhang X, Olsen N, Zheng SG. Vitamin D and chronic diseases. Aging Dis. 2017;8(3):346-53. doi:10.14336/AD.2016.1021. PMID:28580189; PMCID:PMC5440111.
CrossRef - Dunger DB, Ahmed ML, Ong KK. Growth and body composition in type 1 diabetes mellitus. Horm Res. 2006;65 Suppl 3:79-85. doi:10.1159/000091507. PMID:16612122.
CrossRef - Szadkowska A, Pietrzak I, Mianowska B, Bodalska-Lipińska J, Keenan H, Toporowska-Kowalska E, et al. Insulin sensitivity in type 1 diabetic children and adolescents. Diabetes Care. 2015;38(11):2087-94. doi:10.2337/dc15-0187. PMID:26384391.
CrossRef - Wells JC, Fewtrell MS. Measuring body composition. Arch Dis Child. 2006;91(7):612–7.
CrossRef

