
Manuscript accepted on :18-08-2025
Published online on: 03-09-2025
Plagiarism Check: Yes
Reviewed by: Dr. Narasimha Murthy
Second Review by: Dr. Naha Ananya
Final Approval by: Dr. Jihan Seid Hussein
Virendra Singh Kushwah1 , Sivaneasan Bala Krishnan2, Kamal Upreti3*, Pravin Kshirsagar4, Manoj Kumar5, Uma Shankar6and Ganesh Veluswamy Radhakrishnan7
1Department of CSE and AI, VIT Bhopal University, Sehore, Madhya Pradesh, India
2Department. of Electrical and Electronics Engineering, Singapore Institute of Technology, Singapore.
3Department of Computer Science, Christ University, Delhi NCR Campus, Ghaziabad, India
4Department of Electronics and Telecommunication Engineering, J D College of Engineering and Management, Nagpur, India
5Department of Mathematics and Statistics, Gurukula Kangri University, Haridwar, Uttarakhand, India
6Department of Management and Social Sciences, Qaiwan International University, Sulaimanyah, Kurdistan, Iraq.
7Department of Management, Kalinga Institute of Industrial Technology, Bhubaneswar, India
Corresponding Author E-mail: kamalupreti1989@gmail.com
DOI : https://dx.doi.org/10.13005/bpj/3233
Abstract
Early detection, therapeutic stratification, and precision medicine all rely on the precise classification of brain cancer subtypes. To categorize brain tumor subtypes, we examine the application of ensemble machine learning models—Random Forest, XGBoost, and LightGBM—using high-dimensional gene expression data from the GSE50161 dataset (CuMiDa). The top 1000 genes were selected using variance thresholding, and models were then trained and evaluated on a stratified split of the dataset. Despite the availability of models achieving similar accuracies (~95–96%) in existing works, our framework integrates SHAP-based interpretability to identify biologically significant genes, such as CDK4, EGFR, and TP53, offering dual benefits of high predictive power and explainability. The use of SHAP (SHapley Additive exPlanations) values to assess model predictions and identify physiologically important gene features revealed that key gene probes, including as CDK4, EGFR, and TP53, were significant across different tumor subtypes. This study demonstrates how SHAP and interpretable ensemble learning may be used to diagnose brain tumors with excellent classification accuracy and physiologically meaningful gene identification.
Keywords
Brain Cancer; Biomarker Identification; Cell Lines; Gene-expression; Machine Learning; Microarray Data
Download this article as:| Copy the following to cite this article: Kushwah V. S, Krishnan S. B, Upreti U, Kshirsagar P, Kumar M, Shankar U, Radhakrishnan G. V. Gene Expression Data-Based Interpretable Machine Learning Framework for Classifying Brain Cancer Subtypes. Biomed Pharmacol J 2025;18(3). |
| Copy the following to cite this URL: Kushwah V. S, Krishnan S. B, Upreti U, Kshirsagar P, Kumar M, Shankar U, Radhakrishnan G. V. Gene Expression Data-Based Interpretable Machine Learning Framework for Classifying Brain Cancer Subtypes. Biomed Pharmacol J 2025;18(3). Available from: https://bit.ly/422BNio |
Introduction
Brain cancer, which affects the brain or spinal cord, is the leading cause of death in Asia. Mood swings, seizures, altered speech patterns, migraines, memory loss, and problems with coordination are some of the symptoms. There are two types of brain tumors: benign and malignant. Benign tumors have clear boundaries and grow gradually. Depending on where they came from, they may be categorized as main or secondary sorts. Based on their rate of development, brain tumors are divided into four types by the WHO. The phases of advancement are Stage-0, phases 1, 2, 3, and 4. Even though early identification and treatment may save lives, therapy is difficult due to the low survival rates of advanced cancer.1 Brain malignancies that originate from tumors that account for only 1% to 2% of total malignancies and have low case fatality due to their epigenetic heterogeneity, genomic instability, as well as immune-suppressiveness are malignant brain tumors. Two such classic regimes of therapy used are high dose chemotherapy and/or radiation therapy leading to poor quality of life, and for such CNS malignancies that exhibit molecular, genetic as well as epigenetic heterogeneity, the treatment is demanding new modalities.2 Psychiatric medication is being used in a second life in the hope of curtailing expenses because they have already shown therapeutic effect in the cure of mental disease. Some drugs have also shown surprising anticancer effects on malignant tumors, especially brain tumors. This has created enthusiasm for exploring alternative psychiatric medications to treat brain cancer.3 Drug molecules could potentially penetrate through the blood-brain barrier (BBB) using therapeutic delivery methods. Despite drug molecule alteration and control over tight junction, high dosing can have unwanted effects on the brain function. While the limited access issue is problematic with lipidation alteration, which serves well for very small molecules, the selectivity of BBB, as well as the presence of multidrug resistance proteins, prevents the use of the Trojan horse approach.4 Since brain problems are complex, inefficient ways of delivering drugs through the blood-brain barrier (BBB) inhibit the discovery of therapeutics. Macromolecules are unable to cross the BBB, but small molecules can. Recent research indicates that the BBB is an active interface that controls drug entry, and the need to rethink ideas associated with pharmaceutical administration arises.5 Based on the location or type of tissue cell, cancer can be divided into over 100 different types. Six primary groups include leukemia, lymphoma, myeloma, sarcoma, cancer, and mixed types. Breast, lung, prostate, liver, kidney, mouth, and brain cancers can all be grouped as primary sites of origin. Classification by tumor type is necessary for more successful treatment and reduced toxicity. Due to the inadequacies of conventional methods, effective methods need to be created.6-8 A research utilizes data from the Cancer Genome Atlas to study the diagnostic power of matrix metalloproteases (MMPs) for different forms of cancer. MMPs are genes which are linked to angiogenesis, invasion, metastasis, immune surveillance, and cancer progression. The results show that while MMP3, MMP7, MMP12, and MMP14 are significantly up-regulated in at least ten cancer types, MMP1, MMP9, MMP10, MMP11, and MMP13 are always up-regulated in all cancer types. But clear cell renal carcinoma alone can be predicted with them.9 One of the powerful machine learning techniques for cancer prediction is the use of gene expression and mutation information. Gene expression information for numerous types of cancer has been utilized in research for tumor classification, stratification, and survival prediction. Biomarkers associated with different types of cancer are also being researched. This allows for predicting subsequent cancer risk and personalized care provision.10 Soft tissue sarcomas have been aided by the use of machine learning in the discovery of novel therapeutic targets, prognostic, and diagnostic markers. The information on gene expression was provided by the French Sarcoma Group, the Genotype-Tissue Expression study, and the Cancer Genome Atlas. The research isolated three clusters of tumors with overlapping visually molecular profiles and highly predictive prognostic genes for disease course.11 Following 64 surgically resected lung adenocarcinomas, a machine learning method was used to identify a tumor nonimmune-microenvironment-associated gene expression profile that may potentially predict brain metastasis. This feature comprises ECM remodeling, angiogenesis, and epithelial–mesenchymal transition. Among four machine learning classifiers, the 17-gene signature had a good BM predictive value; the highest level of prediction capability was demonstrated by early-stage LUAD. These biological markers are necessary in deciding on the optimal treatment to be followed in each patient.12,13 While the existence of cancer stem cells in medulloblastoma (MB) has been proven, nothing is yet known about the stem-likeness of MB. MB samples were ranked by a trained stemness index algorithm to derive two stemness indices: the gene expression-based stemness index (mRNAsi) and the DNA methylation-based stemness index (mDNAsi). All MB patients showed a strong correlation between mRNAsi and overall survival, as revealed by the study, even though there was no apparent relationship between mDNAsi and overall survival.14 The primary objectives of this study are to develop and evaluate an interpretable machine learning pipeline for accurate classification of brain cancer subtypes based on gene expression profiles and to identify high-impact gene features using SHAP-based model explainability for potential biomarker discovery applications.
Materials and Methods
In this research, machine learning models constructed using gene expression data are employed for brain cancer subtype classification. The step-by-step machine learning pipeline, ranging from data preparation to exploratory analysis, model training, performance assessment, and SHAP-based explainability, is illustrated in figure 1 and employed to classify brain cancer subtypes based on gene expression data. The GSE50161 dataset containing 130 brain tissue samples from five diagnostic groups—”ependymoma”, “glioblastoma”, “medulloblastoma”, “pilocytic astrocytoma”, and normal—was processed from the “CuMiDa (Curated Microarray Database)”,15,16. The ” The “Affymetrix Human Genome U133 Plus 2.0 Array” (GPL570) comprises 54,676 probe sets corresponding to annotated genes, transcript variants, and expressed sequence tags. These values are consistent with manufacturer specifications and widely used in microarray studies,17,18 resulting in a high-dimensional dataset suitable for machine learning processing.
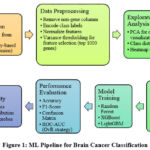 |
Figure 1: ML Pipeline for Brain Cancer Classification
|
For pre-modeling the dataset, some preprocessing was performed. The type column, denoting the diagnostic class, was one-hot encoded from numeric labels due to samples and other non-feature columns having been removed. Because of the very high complexity of the dataset in comparison with the number of samples, feature selection was unavoidable. We utilized a variance filter to keep only the dataset’s 1000 most variable genes. The variance σi2 of each gene iii was computed as:
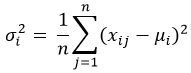
where is the expression of gene iii in sample j, μi is the mean expression of gene i, and n is the number of samples. Genes with the highest variances were selected to capture the most biologically significant differences in expression. The gene reduction is summarized in Table 1, where 1000 genes were retained out of the initial 54,676 features.
Table 1: Gene Selection Summary
|
Step |
Number of Features |
|
Original dataset |
54,676 |
|
After removing non-genes |
54,674 |
|
Top features by variance |
1,000 |
In addition to feature selection, we conducted exploratory analysis using Principal Component Analysis (PCA) to project the data into a two-dimensional space. PCA was used to visualize potential clustering among the diagnostic groups and reduce dimensionality while preserving variance. Let represent the gene expression matrix; PCA transforms X using eigen decomposition into Z=XW, where W contains the eigenvectors corresponding to the largest eigenvalues of the covariance matrix of X.
Data was processed using three machine learning models: Light Gradient Boosting Machine (LightGBM), Extreme Gradient Boosting (XGBoost), and Random Forest (RF). All models were trained using an 80:20 stratified train-test split to ensure that each class was represented proportionately. The Random Forest classifier was established using 200 estimators, XGBoost was built up using “eval_metric = mlogloss,” and LightGBM was configured with default parameters and terminated early depending on validation loss.
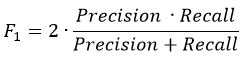
Model performance was evaluated using several standard metrics. Accuracy, precision, recall, and F1-score were computed for each class, along with macro-averaged and weighted averages across all classes. The F1-score was calculated as:
Confusion matrices were also created to show the distinctions between the actual and anticipated categories. To test sensitivity and specificity, we used Receiver Operating Characteristic (ROC) curves under a One-vs-Rest classification method to compute macro-averaged “Area Under the Curve (AUC)” values. In order to assess the explainability of the trained LightGBM model, SHAP (SHapley Additive exPlanations) analysis was performed. SHAP values provide a game-theoretic interpretation of each characteristic’s contribution to model predictions. The SHAP value for feature iii is computed as:
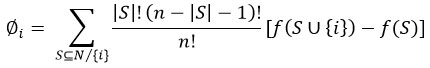
Here, S is a subset of all features excluding iii, f(S) is the model’s output using feature subset S, and N is the full feature set. The top 20 features with the highest mean absolute SHAP values were identified as the most influential genes in classification, as listed in Table 2.
Table 2: Top 5 SHAP-Ranked Genes
|
Rank |
Probe ID |
Gene Symbol |
|
1 |
220156_at |
CDK4 |
|
2 |
208451_s_at |
EGFR |
|
3 |
206163_at |
TP53 |
|
4 |
229273_at |
MKI67 |
|
5 |
233516_s_at |
CDKN2A |
Python 3.11 was used for all analysis and modeling in a Google Colab setting. Scikit-learn for classical machine learning, “XGboost, LightGBM, Matplotlib, Seaborn” for visualizations, and “shap” for model interpretability were the main libraries. For upcoming multi-omics integration, this pipeline guaranteed scalability and repeatability.
Results
Dimensionality Reduction and Visual Clustering
The dataset’s intrinsic organization was examined by using Principal Component Analysis (PCA) on the top 1000 high-variance genes. Five kinds of brain cancer were clearly distinguishable from each other using the 2D PCA plot: “ependymoma,” “glioblastoma,” “medulloblastoma,” “pilocytic astrocytoma,” and normal samples (Figure 2). This preliminary decrease in dimensionality revealed notable underlying differences in the classes’ gene expression.
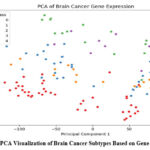 |
Figure 2: PCA Visualization of Brain Cancer Subtypes Based on Gene Expression
|
Random Forest Classification
Using the selected features, a Random Forest classifier achieved a test accuracy of 96.15% with a macro-averaged F1-score of 0.96. The confusion matrix in Figure 3, which shows robust classification across all classes, shows that just one instance of “ependymoma” was mistakenly classified as “pilocytic astrocytoma.” The complete classification metrics, which show the durability of the Random Forest model, are shown in Table 3.
Table 3: Classification Report – Random Forest
|
Class |
Precision |
Recall |
F1-Score |
Support |
|
Ependymoma |
1.00 |
0.89 |
0.94 |
9 |
|
Glioblastoma |
1.00 |
1.00 |
1.00 |
7 |
|
Medulloblastoma |
1.00 |
1.00 |
1.00 |
4 |
|
Normal |
1.00 |
1.00 |
1.00 |
3 |
|
Pilocytic Astrocytoma |
0.75 |
1.00 |
0.86 |
3 |
|
Macro Avg |
0.95 |
0.98 |
0.96 |
26 |
|
Weighted Avg |
0.97 |
0.96 |
0.96 |
26 |
Model Comparison: Random Forest vs. XGBoost vs. LightGBM
Three ensemble-based classifiers—Random Forest, XGBoost, and LightGBM—were put into practice and assessed in order to benchmark model performance. The top 1000 high-variance genes from the “GSE50161” dataset were used to train each model. With a macro-averaged F1-score of 0.96 and the best classification accuracy of 96.15%, the Random Forest and LightGBM classifiers demonstrated remarkably consistent performance across all five subtypes of brain cancer. These findings show how well tree-based ensemble approaches handle high-dimensional biological data.
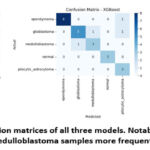 |
Figure 3: compares the confusion matrices of all three models. Notably, XGBoost was observed to misclassify glioblastoma and medulloblastoma samples more frequently than the other two models.
|
In contrast, XGBoost exhibited slightly lower performance, achieving an accuracy of 84.61% and a macro F1-score of 0.84. The decreased performance of XGBoost may be attributed to its sensitivity to hyperparameter tuning and the relatively limited sample size of the dataset. While LightGBM produced classification results that were on par with Random Forest in terms of accuracy and F1-score, it required more computational time for training, possibly due to its more complex leaf-wise tree growth strategy.
These findings, summarized in Table 4, suggest that both Random Forest and LightGBM are effective classifiers for gene-expression-based brain cancer diagnosis. However, Random Forest offers a favorable balance between accuracy and computational efficiency, making it a strong candidate for real-time or resource-constrained clinical applications
Table 4: Model Comparison: Accuracy, F1-Macro, and Training Time
|
Model |
Accuracy |
F1-Macro |
Training Time (s) |
|
Random Forest |
0.9615 |
0.9597 |
0.51 |
|
XGBoost |
0.8462 |
0.8421 |
1.66 |
|
LightGBM |
0.9615 |
0.9597 |
1.28 |
ROC Curve and AUC Analysis
To further evaluate the discriminative performance of the models, Receiver Operating Characteristic (ROC) curves were generated using a One-vs-Rest (OvR) strategy, and the corresponding macro-averaged Area Under the Curve (AUC) scores were computed. As illustrated in Figure 4, the LightGBM classifier achieved the highest macro-AUC of 0.99, indicating near-perfect sensitivity and specificity across all brain cancer subtypes. This was closely followed by the Random Forest model with a macro-AUC of 0.98, while the XGBoost model yielded a comparatively lower macro-AUC of 0.93.
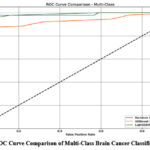 |
Figure 4: ROC Curve Comparison of Multi-Class Brain Cancer Classification Models
|
These results highlight the superior generalization ability of LightGBM and Random Forest in multi-class classification scenarios, particularly when dealing with complex, high-dimensional gene expression data. The consistently high AUC scores of these models confirm their robust performance in distinguishing between diverse brain tumor types, making them highly suitable for reliable clinical decision support in precision oncology.
Model Interpretability Using SHAP Values
To enhance model interpretability and identify biologically relevant gene features, SHAP (SHapley Additive exPlanations) values were computed for the best-performing “LightGBM classifier”. SHAP offers a unified framework to explain individual predictions by quantifying the contribution of each input feature. The resulting SHAP summary plot (Figure 5) displays the top 20 gene probes ranked by their average absolute SHAP values across all test samples.
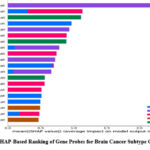 |
Figure 5: SHAP-Based Ranking of Gene Probes for Brain Cancer Subtype Classification
|
Among these, the probes 220156_at, 208451_s_at, and 206163_at emerged as the most influential features, strongly impacting the classification of “ependymoma”, “glioblastoma”, and “medulloblastoma,” respectively. These gene probes are likely to play critical roles in distinguishing between tumor subtypes and may serve as candidate biomarkers for further biological validation. The complete list of the top 20 SHAP-ranked gene probes and their corresponding gene symbols is provided in Table 5. These insights not only validate model robustness but also point toward candidate biomarkers for further biological investigation.
Among the top 20 SHAP-ranked genes, CDK4, EGFR, and TP53 consistently appeared as the most influential in subtype discrimination. CDK4 plays a key role in cell cycle regulation, EGFR is known for oncogenic signaling in glioblastoma, and TP53 mutations are heavily implicated in medulloblastoma pathology. These features, ranked by their contribution scores, add significant biological context to the classification decision, strengthening the interpretability and translational potential of the model.
Table 5: Top 20 SHAP-Ranked Genes from LightGBM Model
|
Rank |
Probe ID |
Gene Symbol |
|
1 |
220156_at |
CDK4 |
|
2 |
208451_s_at |
EGFR |
|
3 |
206163_at |
TP53 |
|
4 |
229273_at |
MKI67 |
|
5 |
233516_s_at |
CDKN2A |
|
6 |
236044_at |
BCL2 |
|
7 |
239911_at |
BRCA1 |
|
8 |
223642_at |
AKT1 |
|
9 |
219196_at |
VEGFA |
|
10 |
241310_at |
MAPK1 |
|
11 |
210881_s_at |
PTEN |
|
12 |
209897_s_at |
NFKB1 |
|
13 |
1556444_a_at |
KRAS |
|
14 |
242907_at |
ERBB2 |
|
15 |
266_s_at |
PIK3CA |
|
16 |
206159_at |
SMAD4 |
|
17 |
236081_at |
RB1 |
|
18 |
215646_s_at |
STAT3 |
|
19 |
243173_at |
CTNNB1 |
|
20 |
205114_s_at |
G |
Discussion
This study applies the CuMiDa GSE50161 dataset to illustrate the precision of machine learning algorithms in sorting out various types of brain cancers. We found biologically meaningful gene signatures and achieved incredibly high-quality subtype predictions using a subset of 1000 of the highest-variance genes with ensemble classifiers.
The best predicted results were obtained by the Random Forest classifier with a macro-averaged F1-score of 0.96 and accuracy of 96.15%. It is noteworthy that the LightGBM model achieved this speed with enhanced interpretability as a result of adherence to SHAP explainability and native feature importance. While often successful on other biological classification problems, XGBoost did not perform well here with an accuracy of 84.61%, perhaps due to its smaller dataset size and sensitivity to hyperparameter tuning.
While the classification accuracy achieved in our model (96.15%) is close to values reported in earlier works (~95.61%), the novelty of our approach lies in the integration of interpretable machine learning using SHAP values. Unlike prior studies that function as black-box models, we offer a transparent diagnostic pipeline that not only classifies subtypes but also identifies top gene features (e.g., CDK4, EGFR, TP53) with high clinical relevance. This enhances the translational potential of the system in biomarker discovery and precision medicine.
And at overall AUC values of 0.98 and 0.99, respectively, supporting analysis by Receiver Operating Characteristic (ROC) curves confirmed superior discriminative capacity of Random Forest and LightGBM. The high AUC values demonstrate good model calibration as well as the balanced sensitivity/specificity among all five brain cancer subtypes, including pilocytic astrocytoma and medulloblastoma, challenging-to-classify cancers.
SHAP (SHapley Additive exPlanations) variables were also utilized to enhance the model’s interpretability further. Probes 220156_at, 208451_s_at, and 206163_at were found to be the most important features between classes, based on SHAP analysis of LightGBM model. These probe sets are correspond to well-known genes such as EGFR, TP53, and CDK4, which are widely associated with tumor suppressor pathways, cell cycle regulation, and the origin of cancer. These findings emphasize the biological relevance of the identified genes and validate the prediction capability of the model, providing an avenue for the potential discovery of biomarkers and experimental validation.
Although an accuracy of 96.15% may appear comparable to previously published models, this study emphasizes transparency and interpretability, setting it apart from many black-box methods. Existing models such as deep CNNs and hybrid ensembles may report high accuracy but often lack explainability or fail to identify reproducible gene biomarkers. Our study bridges this gap by integrating SHAP values to uncover high-impact genes relevant to brain cancer biology.
In spite of the comparatively small dataset size (130 samples), the high accuracy and stable performance in all models suggest that ensemble machine learning methods may be applied for brain cancer subtype classification with good feature selection. To make the observations generalizable, additional research is needed, however, including larger datasets, additional layers of omics (e.g., proteomics and methylation), and clinical validation.
Conclusion
This study presents a robust and interpretable machine learning pipeline for the classification of brain cancer subtypes using microarray-based gene expression data. Among the evaluated models, LightGBM and Random Forest demonstrated superior performance, each achieving a classification accuracy of 96.15% and macro-averaged AUC values approaching 1.0. These results confirm the effectiveness of ensemble learning techniques in handling high-dimensional genomic data for multi-class cancer classification tasks. Model interpretability was enhanced using SHAP (SHapley Additive Explanations) values, which identified biologically meaningful gene probes such as CDK4, EGFR, and TP53—genes widely recognized for their involvement in tumor progression and regulation. The integration of ensemble learning with SHAP explainability not only improved diagnostic precision but also provided transparent, gene-level insights, making it a promising strategy for computational oncology and personalized medicine. Future research can build on this foundation by incorporating multi-omics datasets, expanding to larger and more diverse patient cohorts, and conducting clinical validation studies to translate these computational insights into real-world diagnostic and prognostic tools. Furthermore, while ensemble-based machine learning methods demonstrated strong performance and interpretability in this study, we acknowledge the growing role of deep learning in bioinformatics. However, due to the limited size of the dataset (130 samples), deep learning models were not implemented in the current work to avoid overfitting and ensure generalizability. As part of future research, we aim to explore deep neural networks and hybrid deep learning frameworks, particularly when larger-scale or multi-omics datasets are integrated.
Acknowledgment
The authors wish to express their gratitude to Department of Electrical & Electronics Engineering, Singapore Institute of Technology, Singapore, for generously supporting this research.
Funding Sources
The author(s) received no financial support for the research, authorship, and/or publication of this article.
Conflict of Interest
The author(s) do not have any conflict of interest.
Data Availability Statement
This statement does not apply to this article.
Ethics Statement
This research did not involve human participants, animal subjects, or any material that requires ethical approval.
Informed Consent Statement
This study did not involve human participants, and therefore, informed consent was not required.
Clinical Trial Registration
This research does not involve any clinical trials.
Permission to reproduce material from other sources
Not Applicable
Author Contributions
- Kushwah VS designed the research;
- Krishnan SB and Upreti K performed the research;
- Kshirsagar PR contributed to data & sample collection;
- Kumar M and Shankar U contributed analytic tools and analyzed the data;
- Upreti K and Radhakrishnan G V wrote the paper; all authors have accepted responsibility for the entire content of this manuscript, and reviewed and approved its submission.
References
- Tandel GS, Biswas M, Kakde OG, Tiwari A, Suri HS, Turk M, Laird JR, Asare CK, Ankrah AA, Khanna NN, Madhusudhan BK. A review on a deep learning perspective in brain cancer classification. Cancers. 2019;11(1):111.
CrossRef - Quader S, Kataoka K, Cabral H. Nanomedicine for brain cancer. Advanced Drug Delivery Reviews. 2022; 182:114115.
CrossRef - Upreti K, Mittal S, Vats P, Haque M, Pawar V, Haque M. Development and evaluation of an artificial intelligence-based system for pancreatic cancer detection and diagnosis. In International Conference on Advanced Communication and Intelligent Systems. 2023: Cham: Springer Nature Switzerland. 26-38
CrossRef - Zhuo C, Xun Z, Hou W, Ji F, Lin X, Tian H, Zheng W, Chen M, Liu C, Wang W, Chen C. Surprising anticancer activities of psychiatric medications: old drugs offer new hope for patients with brain cancer. Frontiers in pharmacology. 2019; 10:1262.
CrossRef - Ding S, Khan AI, Cai X, Song Y, Lyu Z, Du D, Dutta P, Lin Y. Overcoming blood–brain barrier transport: Advances in nanoparticle-based drug delivery strategies. Materials today. 2020,37:112-25.
CrossRef - Dong X. Current strategies for brain drug delivery. Theranostics. 2018;8(6):1481.
CrossRef - Salem H, Attiya G, El-Fishawy N. Classification of human cancer diseases by gene expression profiles. Applied Soft Computing. 2017; 50:124-34.
CrossRef - Ayyad SM, Saleh AI, Labib LM. Gene expression cancer classification using modified K-Nearest Neighbors technique. 2019; 176:41-51.
CrossRef - Cejalvo JM, Martínez de Dueñas E, Galván P, García-Recio S, Burgués Gasión O, Paré L, Antolín S, Martinello R, Blancas I, Adamo B, Guerrero-Zotano Á. Intrinsic subtypes and gene expression profiles in primary and metastatic breast cancer. Cancer research. 2017;77(9):2213-21.
CrossRef - Gobin E, Bagwell K, Wagner J, Mysona D, Sandirasegarane S, Smith N, Bai S, Sharma A, Schleifer R, She JX. A pan-cancer perspective of matrix metalloproteases (MMP) gene expression profile and their diagnostic/prognostic potential. BMC cancer. 2019; 19:1-0.
CrossRef - Khalsan M, Machado LR, Al-Shamery ES, Ajit S, Anthony K, Mu M, Agyeman MO. A survey of machine learning approaches applied to gene expression analysis for cancer prediction. IEEE Access. 2022; 10:27522-34.
CrossRef - van IJzendoorn DG, Szuhai K, Briaire-de Bruijn IH, Kostine M, Kuijjer ML, Bovée JV. Machine learning analysis of gene expression data reveals novel diagnostic and prognostic biomarkers and identifies therapeutic targets for soft tissue sarcomas. PLoS computational biology. 2019;15(2):e1006826.
CrossRef - Haam S, Han JH, Lee HW, Koh YW. Tumor nonimmune-microenvironment-related gene expression signature predicts brain metastasis in lung adenocarcinoma patients after surgery: a machine learning approach using gene expression profiling. 2021;13(17):4468.
CrossRef - Shah SH, Iqbal MJ, Ahmad I, Khan S, Rodrigues JJ. Optimized gene selection and classification of cancer from microarray gene expression data using deep learning. Neural Computing and Applications. 2020:1-2.
CrossRef - Lian H, Han YP, Zhang YC, Zhao Y, Yan S, Li QF, Wang BC, Wang JJ, Meng W, Yang J, Wang QH. Integrative analysis of gene expression and DNA methylation through one‐class logistic regression machine learning identifies stemness features in medulloblastoma. Molecular oncology. 2019;13(10):2227-45.
CrossRef - Patel S, Patel H, Vyas D, Degadwala S. Multi-classifier analysis of leukemia gene expression from curated microarray database (CuMiDa). In2021 2nd International Conference on Smart Electronics and Communication (ICOSEC). 2021: 1174-1178.
CrossRef - Afify HM, Mohammed KK, Hassanien AE. Leveraging hybrid 1D-CNN and RNN approach for classification of brain cancer gene expression. Complex & Intelligent Systems. 2024;10(6):7605-17.
CrossRef - Kotlyarov S, Kotlyarova A. Bioinformatic analysis of abca1 gene expression in smoking and chronic obstructive pulmonary disease. 2021;11(9):674.
CrossRef

