
Manuscript accepted on :26-09-2025
Published online on: 30-09-2025
Plagiarism Check: Yes
Reviewed by: Dr. Mazhar Ozkan
Second Review by: Dr. Saida Ncibi
Final Approval by: Dr. Patorn Piromchai
Mohamad Zulkefly bin Mohamad Nazri1,2 , Norhaida binti Che Azmi1* and Mohamad Shafiq Bin Azanan2
1Clinical and Biomedical Science, Universiti Kuala Lumpur Institute of Medical Science Technology, Taman Kajang Sentral, Kajang Selangor Malaysia.
2Department of Paediatrics, Faculty of Medicine, Universiti Malaya, Kuala Lumpur Malaysia.
Corresponding Author E-mail: norhaida@unikl.edu.my
DOI : https://dx.doi.org/10.13005/bpj/3272
Abstract
Haploidentical hematopoietic stem cell transplantation (Haplo-HSCT) serves as an effective therapeutic intervention for haematological disorders, including leukemia, lymphoma, and various benign conditions. The assessment of engraftment through the quantification of chimerism is a crucial criterion for Haplo-HSCT. This investigation was designed utilising a Human Leukocyte Antigen-A24 (HLA-A24) antibody panel for the flow cytometric evaluation of chimerism post-Haplo-HSCT. Peripheral blood mononuclear cell (PBMC) specimens were procured from both patients and their corresponding donors at the University Malaya Medical Centre (UMMC). The flow cytometric analysis quantified the proportion of HLA-A24 antigen expression across a serial dilution (0%, 25%, 50%, 75%, and 100%). The FACS Diva software (Version 6.1, BD) facilitated the data evaluation, and a standard curve graph was constructed. The data were analyzed utilising the Statistical Package for the Social Sciences Software Version 27 (SPSS Version 27), with the relationship examined through the Pearson correlation test. The findings reveal a statistically significant correlation (R² = 0.99) between serial dilution and the mean expression of HLA-A24 (p<0.05), suggesting the applicability of the standard curve. The standard curve illustrated that serial dilution exhibited a direct proportionality to the expression of HLA-A24. It is suggested that this preliminary test demonstrated sensitivity for detection of T cells, B cells, and NK cells expression, with a minimum frequency of 5%, was detectable. The HLA-A24 panel enabled the monitoring of dynamic shifts in cellular subpopulations after haplo-HSCT, thereby assisting clinicians in implementing proactive management strategies. Consequently, flow cytometric analysis is a valuable technique for assessing engraftment in haplo-HSCT.
Keywords
Chimerism; Flow cytometry; Haploidentical hematopoietic stem cell transplantation; Human leukocyte antigen-A24; Peripheral blood mononuclear cell.
Download this article as:| Copy the following to cite this article: Nazri M. Z. B. M, Azmi N. B. C, Azanan M. S. B. Flow Cytometry–Based Optimisation of HLA-A24 Chimerism Monitoring in Haploidentical Haematopoietic Stem Cell Transplantation-- A Preliminary Study. Biomed Pharmacol J 2025;18(3). |
| Copy the following to cite this URL: Nazri M. Z. B. M, Azmi N. B. C, Azanan M. S. B. Flow Cytometry–Based Optimisation of HLA-A24 Chimerism Monitoring in Haploidentical Haematopoietic Stem Cell Transplantation-- A Preliminary Study. Biomed Pharmacol J 2025;18(3). Available from: https://bit.ly/43cCc2b |
Introduction
The immune system depends on cell-surface human leukocyte antigen (HLA) proteins to distinguish between self and non-self, a fundamental mechanism in haploidentical haematopoietic stem cell transplantation (haplo-HSCT). This therapeutic approach is used to treat leukaemia, lymphoma, and various non-malignant haematologic conditions.2 However, the presence of anti-HLA antibodies can complicate transplantation by causing antibody-mediated rejection and graft failure. Therefore, pre-transplant screening for panel reactive antibodies is crucial to detect anti-HLA antibodies and minimise the risk of adverse outcomes. 1
Successful transplantation relies primarily on optimal donor selection, guided mainly by HLA compatibility. Unfortunately, only about one-third of patients have an HLA-matched sibling donor. 3 When a matched sibling or unrelated donor is not available, haplo-HSCT has become a cost-effective and timely alternative for successful transplants. 4
Chimerism monitoring after transplantation is essential for evaluating engraftment at specific intervals. It also plays a key role in detecting complications such as graft rejection, relapse, or delayed engraftment. Such monitoring enables the adjustment of immunosuppressive therapy to enhance patient outcomes. 5
While DNA-based methods like short tandem repeat PCR (STR-PCR) are considered the standard for chimerism analysis, they tend to be expensive, laborious, and have limited sensitivity. 6 In response to these drawbacks, flow cytometry has emerged as a quick and dependable alternative, enabling direct detection of donor chimerism without needing prior cell separation. 7 This study focuses on creating a flow cytometry–based panel of HLA-A24–specific antibodies for monitoring chimerism in haploidentical HSCT. Developing this panel aims to improve sensitivity, accuracy, and speed of chimerism detection, thereby aiding better clinical decisions and enhancing long-term transplant success.
Materials and Methods
Research Design
The study design focused on optimizing chimerism monitoring through flow cytometry using HLA-A24. The primary aim was to identify an informative anti-HLA-A24 panel suitable for the Malaysian population. According to Dhaliwal et al.8, the most common haplotypes were A24-B15-DR12 (0.047), A24-B15-DR15 (0.03), and A24-B35-DR12 (0.03). Additionally, a high frequency of HLA-A24 was observed in previous HLA-mismatched paediatric bone marrow transplant cases at UMMC, Petaling Jaya. Among the HLA types analysed, HLA-A24 was the most frequently occurring allele in bone marrow transplant recipients at this centre.
Before flow cytometry gating and analysis for chimerism monitoring, a frozen PBMC sample in liquid nitrogen from the Biobank unit was extracted for this study. Then, blood with HLA-A24+ and blood with HLA-A24- were processed and stained with an antibody conjugated with a fluorochrome (BD Biosciences, Malaysia). Monoclonal mouse anti-human HLA-A24 antibody (clone 22E1, FITC) (Genomax Technologies Sdn. Bhd., Malaysia) and primary mouse anti-CD3 (T cell marker), anti-CD19 (pan-B cell marker), and anti-CD56 (NK cell marker) antibodies (BD Biosciences, Malaysia) were purchased for this study. The results obtained were analysed using BD FACS Diva software version 6.1 (Becton Dickinson, San Jose, CA, USA). The relationships of the serial dilution and expression of HLA-A24 were tested using the Pearson correlation test with the Statistical Package for Social Science Software, Version 27 (SPSS Version 27).
Study Population
Peripheral blood samples were obtained from the Paediatrics Department, Faculty of Medicine, University of Malaya, and screened for the presence of the HLA-A24 allele. Currently, the University of Malaya Medical Centre (UMMC) routinely performs HLA typing for both HSCT recipients and potential donors. For this study, patients and donors with informative HLA mismatches were selected based on HLA-A24 expression. UMMC conducts approximately ten haploidentical bone marrow transplants annually. The HLA-A24 allele was chosen for this research due to its high prevalence and the availability of a monoclonal mouse anti-human HLA-A24 antibody (clone 22E1, FITC; Genomax Technologies Sdn. Bhd, Malaysia). Blood samples were included based on predefined criteria, specifically those identified as HLA-A24 positive or negative. Samples without prior HLA typing were excluded from the study.
Flow cytometry
Cells were analysed using a BD FACSCanto II flow cytometer equipped with 488 nm and 633 nm lasers (Becton Dickinson, San Jose, CA, USA), operated with the FACS Diva software Version 6.1 (Becton Dickinson, San Jose, CA, USA). Peripheral blood mononuclear cells (PBMCs) were isolated from HLA-A24–positive samples by density gradient centrifugation and then prepared for serial dilution. Cell recovery and viability were assessed using a haemocytometer under light microscopy. Serial dilution of two samples (n=2) was stained with monoclonal mouse anti-human HLA-A24 antibody (FITC) and further incubated with primary antibodies targeting CD3 (T-cell marker), CD19 (B-cell marker), and CD56 (NK-cell marker) prior to flow cytometric analysis.
A standard dilution curve was created using samples from paediatric patients undergoing haploidentical HSCT at UMMC, with both HLA-A24–positive and HLA-A24–negative PBMCs. For each dilution series, 1 × 10⁶ PBMCs were transferred into tubes at final concentrations of 0%, 25%, 50%, 75%, and 100% HLA-A24+ cells, in a total volume of 200 µl. All flow cytometry assays were conducted in duplicate.
Results
Optimisation of flow cytometry procedure using chimeric donor samples
HLA-A24 panel sensitivity was measured using a FACS Canto II flow cytometer (Beckton Dickinson, San Jose, CA, USA) by serially diluting an HLA-A24+ sample with an HLA-A24- phenotype, at dilution levels of 0%, 25%, 50%, 75% and 100% of the HLA-A24+ sample. These serial dilutions were performed in duplicate experiments. For initial optimisation (Figure 1), the examination of HLA-A24 chimerism at various dilutions indicated a mixed sample. Only one peak was observed at 0% (A) and 100% (E) dilutions, indicating a pure population of either HLA-A24- or HLA-A24+. A typical negative population should appear on the left side of the positive. peak, indicating minimal or no antibody binding to the sample. Notably, the HLA-A24- population peak showed a higher fluorescence signal compared to the HLA-A24+ population, suggesting potential contamination or excessive nonspecific binding.
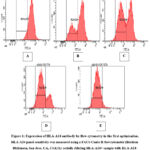 |
Figure 1: Expression of HLA-A24 antibody by flow cytometry in the first optimisation.
|
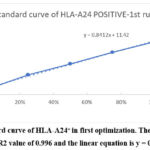 |
Figure 2: Standard curve of HLA-A24+ in first optimization. The best-fit line was plotted with an R2 value of 0.996 and the linear equation is y = 0.8412x + 11.42.
|
For the second optimisation (Figure 3), the HLA-A24+ gating area was defined as based on a 100% dilution tube, where the right boundary of the gate was also guided by the location where the two peaks intersect in the 50% dilution tube. The best-fit linear equation for Standard Curve 2 is y = 0.8528x + 6.54 (Figure 4). Hence, this equation showed that the intercept for Standard Curve 2 is lower than that for Standard Curve 1, suggesting that at 0% dilution, the baseline expression of HLA-A24 is lower in the second dataset compared to the first. However, both standard curves show a strong positive linear relationship between dilution percentage and HLA-A24 expression. The slight differences in the interceptions may result from minor variations in experimental conditions, such as room temperature and machine performance. However, the similarity in slopes suggests a consistent response of HLA-A24 expression to dilution across both experiments, indicating a negligible inter-assay effect.
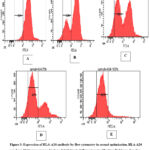 |
Figure 3: Expression of HLA-A24 antibody by flow cytometry in second optimisation.
|
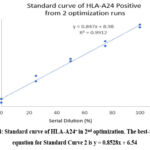 |
Figure 4: Standard curve of HLA-A24+ in 2nd optimization. The best-fit linear equation for Standard Curve 2 is y = 0.8528x + 6.54
|
From the serial dilution of an HLA-A24 positive sample, at 0% dilution, the average expression of HLA-A24 is 6.65%, which represents the baseline or the minimal expression at the starting point of serial dilution. At 25% dilution, the average expression rises to 32.10%, showing a notable increase from the baseline. At 50% dilution, the average expression reaches 53.25%, indicating higher expression levels as the dilution increases. At 75% dilution, the average expression is 72.15%, demonstrating a further rise in expression. Finally, at 100% dilution, the average expression is 92.50%, representing the highest level of HLA-A24 expression. Therefore, the trend indicates a proportional increase in HLA-A24 expression with increasing dilution percentages, which is expected as the sample concentration rises. These findings align with a study stating that a sample with HLA-A02, A24 expression was mixed with a sample with HLA-A03:01, A30:01 expression in proportions of 100%, 50%, 20%, and 10%. As the proportion of the HLA-A02, A24 sample decreased, the population of cells reacting to anti-HLA-A02, A24 declined, and the population of cells negative for anti-HLA-A*02, A*24 became more prominent.9
The inter-assay coefficient of variation (CV) for both standard curve 1 and standard curve 2 showed minimal variability (<15%) across all dilution points, except at 0% dilution. At this lowest expression level, the CV was 32.33%, indicating high variability between duplicate optimisations. At 25% dilution, the CV decreased to 9.35%, showing improved consistency compared to 0% dilution. Further reductions were seen at higher dilutions: 2.35% at 50% dilution (very low variability and high reproducibility), 3.95% at 75% dilution (good inter-assay consistency), and 1.62% at 100% dilution, the lowest variability observed, suggesting excellent reproducibility at the highest concentration. These results demonstrate that reproducibility improves with increasing HLA-A24 expression, with the most reliable measurements at 100% dilution. Since lower CV values imply greater reproducibility, the standard curve is more accurate at higher expression levels. The overall standard curve (y = 0.847x + 8.98), calculated from the average HLA-A24 expression values of the two optimisation runs, was employed for subsequent analyses.
Analysis of the relationship between serial dilution and HLA-A24 expression levels
Table 1 shows the relationship between serial dilution and HLA-A24 expressions. Pearson correlation analysis resulted in a coefficient of 0.998 with a p-value of 0.001, indicating a strong and statistically significant correlation between serial dilution and mean HLA-A24 expression, thus supporting the validity of the generated standard curve. While no previous studies have specifically reported correlation outcomes for flow cytometry–based chimerism analysis. These findings align with the results proposed by Liacini et al.10, who demonstrated an R² value of 0.99 using next-generation sequencing (NGS) in artificially mixed samples across a wide range of chimerism levels in triplicate.9 Their study confirmed a highly linear and accurate assay performance with minimal systematic bias, reinforcing the robustness of dilution-based monitoring approaches. Based on these results, the final standard curve in this study was constructed from the mean HLA-A24 expression obtained across two independent runs and plotted against the actual dilution series.
Validation of the HLA-A24 panel using patient samples
The optimisation of this project acts as guidance for clinical management based on the chimerism status of A24 for patients at UMMC. Serial monitoring of flow cytometric lineage-specific chimerism analysis will provide a better understanding of regenerating haemopoiesis after transplantation, as well as engraftment or rejection kinetics.11 The final HLA-A24 panel is being validated for the clinical use of the intended HLA-A24 panel in flow cytometric monitoring of chimerism after haploidentical stem cell transplantation. The panel underwent flow cytometric analysis to assess its ability to distinguish between donor and recipient cells and to monitor the engraftment of donor stem cells.
Table 1: represents the relationship between serial dilution and HLA-A24 expressions. Pearson correlation analysis yielded a coefficient of 0.998 with a p-value of 0.001, indicating a very strong and statistically significant correlation between serial dilution and mean HLA-A24 expression.
| Variable | Serial dilution | Standard curve 1 | Standard curve 2 | Average expression of HLA-A24 (%) | ||||
| R | p | r | p | r | p | r | p | |
| Serial dilution | 0.998 | 0.001* | 0.998 | 0.001* | 0.998 | 0.001* | ||
| Standard curve 1 | 0.998 | 0.001* | 0.999 | 0.001* | 1.000 | 0.001* | ||
| Standard curve 2 | 0.998 | 0.001* | 0.999 | 0.001* | 1.000 | 0.001* | ||
| Average expression of HLA-A24 (%) |
0.998 |
0.001* |
1.000 |
0.001* |
1.000 |
0.001* |
||
Analyzed using Pearson correlation test, * denotes p < 0.05
Monitoring of cells engraftment by flow cytometry
Table 2 presents the engraftment monitoring for two patients, FC001 and FC002 (n=2), at UMMC. In both cases, the donor–recipient mismatch at HLA-A24 allowed its use as a lineage-specific marker for chimerism monitoring. Patient FC001, who was HLA-A24 positive with an HLA-A24–negative donor, showed mixed chimerism at day 30 post–transplantation, with donor-derived T cells (52.9%) and NK cells (41.0%) indicating substantial engraftment, while B cells contributed minimally at 3.6%. By day 63, complete donor chimerism was established in both T and NK cells (100%), with B cells also demonstrating a robust but slightly lower engraftment level of 93.1%. These preliminary findings indicate progressive and stable donor immune reconstitution, with T and NK cells engrafting earlier and more fully than B cells.
Table 2: Percentage of engraftment monitoring for two patients (FC001 and FC002) using HLA-A24 panel on T cells, B cells and NK cells at UMMC.
|
Patient ID |
Donor |
Cell subset (Gated on HLA- A24+ population) | Donor chimerism (%) | ||||
| T
(CD3+) |
NK
(CD56+) |
B
(CD19+) |
T
((CD3+) |
NK
(CD56+) |
B
(CD19+) |
||
| FC001 (Day+30) | *HLA- A24– | 53.8 | 43.7 | 12.0 | 47.1 | 59.0 | 96.4 |
| FC002 (Day+14) | HLA- A24+ | 9.7 | 12.0 | 54.4 | 0.9 | 3.6 | 53.6 |
| FC001 (Day+63) | *HLA- A24– | 0.1 | 0.1 | 14.8 | 100.0 | 100.0 | 93.1 |
| FC002 (Day+21) | HLA- A24+ | 30.1 | 33.9 | 9.3 | 24.9 | 29.4 | 0.4 |
| FC002 (Day+26) | HLA- A24+ | 82.2 | 98.9 | 77.6 | 86.4 | 100.0 | 81.0 |
| FC002 (Day+49) | HLA- A24+ | 91.3 | 97.9 | 88.6 | 97.2 | 100.0 | 94.0 |
In contrast, patient FC002, who was HLA-A24 negative with an HLA-A24–positive donor, showed a different course. On day 14, donor B cells predominated (53.6%), while NK cells (3.6%) and T cells (0.9%) remained low (Figure 5). By day 21, donor B-cell chimerism dropped sharply to 0.4%, aligning with a significant increase in T cells (24.9%) and NK cells (29.4%) (Figure 6). On day 26 (Figure 7), donor T cells expanded further to 86.4%, NK cells reached full engraftment at 100%, and B cells recovered to 81%. Continued monitoring up to day 49 showed stable NK-cell engraftment at 100%, near-complete T-cell engraftment at 97.2%, and further B-cell recovery to 94% (Figure 8).
Taken together, these results highlight distinct engraftment kinetics between the two patients. FC001 exhibited relatively early and sustained donor T- and NK-cell dominance, with B-cell engraftment occurring more gradually. In contrast, FC002 showed transient early B-cell predominance, followed by rapid expansion of donor T and NK cells and subsequent recovery of B cells. By the end of the monitoring period, both patients achieved near-complete donor chimerism across all lymphocyte subsets, underscoring the heterogeneity of lineage-specific immune reconstitution following haploidentical HSCT.
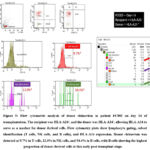 |
Figure 5: Flow cytometric analysis of donor chimerism in patient FC002 on day 14 of transplantation.
|
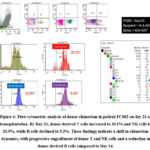 |
Figure 6: Flow cytometric analysis of donor chimerism in patient FC002 on day 21 of transplantation.
|
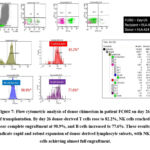 |
Figure 7: Flow cytometric analysis of donor chimerism in patient FC002 on day 26 of transplantation.
|
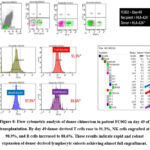 |
Figure 8: Flow cytometric analysis of donor chimerism in patient FC002 on day 49 of transplantation.
|
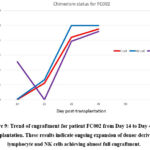 |
Figure 9: Trend of engraftment for patient FC002 from Day 14 to Day 49 of transplantation. These results indicate ongoing expansion of donor-derived T lymphocyte and NK cells achieving almost full engraftment.
|
In summary, serial monitoring from day 14 to day 49 (Figure 9) showed a rapid and sustained increase in donor-derived T lymphocytes and NK cells, indicating strong engraftment and expansion of these subsets. In contrast, B cells displayed a biphasic pattern, with an initial decline followed by recovery and expansion by day 49. The overall trends in donor chimerism across T cells, NK cells, and B cells are shown in figure 9. These findings confirm ongoing engraftment as detected by flow cytometric analysis, which offers a sensitive method for tracking immunological changes in patients undergoing HLA-haploidentical stem cell transplantation. Furthermore, the observed patterns emphasise the usefulness of flow cytometry in capturing the dynamic process of immune reconstitution after transplantation.
Discussion
Monitoring chimerism in allogeneic haploidentical HSCT recipients has become a diagnostic standard. It is essential to determine engraftment status, graft failure, or imminent relapse of malignancy.1 Five HSCT samples were analysed, with engraftment monitoring feasible in two patients who underwent allogeneic haploidentical HSCT at the UMMC using flow cytometry. Pre-transplant HLA typing revealed donor–recipient mismatches at HLA-A24 in both cases. This is clinically relevant, as HLA-A24 is among the most common HLA-A alleles worldwide and is reported as the second most prevalent allele in the Korean population.12 Reproducibility of the assay was assessed using the coefficient of variation (CV), which is preferred over standard deviation because it is dimensionless and independent of data scale.13 Low CV is generally considered acceptable; however, this threshold was not achieved at the 0% dilution, likely due to non-specific antibody binding causing excessive background signal. Although fluorescent-minus-one (FMO) controls were included, no abnormal background staining was observed, indicating that the unexpected peak in the negative population tube was not caused by background noise. Other potential contributors, such as instrument variability, improper compensation settings, or technical artifacts, may also have influenced signal detection and contributed to this finding. This highlights the importance of combining suitable controls with a robust gating strategy to reliably identify cell populations in flow cytometry.14
Dead cell contamination was also considered, but microscopic examination and trypan blue exclusion confirmed high sample viability, ruling out this explanation. A more plausible factor was antibody specificity. Non-specific binding can occur due to structural overlaps in peptide-binding motifs across HLA superfamilies, such as A2, A24, and A6X, which share interaction profiles and may exhibit cross-reactivity.15 This could account for the abnormal peak observed in our study. The absence of Fc blocking reagents is a limitation of our assay, as such reagents can effectively reduce non-specific Fc receptor interactions and improve staining specificity.16 Their inclusion in future experiments would likely enhance assay reliability.
Conclusion
HLA matching between the donor and the recipient significantly influences the post-transplant immune-mediated outcome of allogeneic haploidentical HSCT. This study developed an HLA-A24 flow cytometry panel for chimerism monitoring in haploidentical hematopoietic stem cell transplantation (Haplo-HSCT). A preliminary study establishing a standard curve specific to the HLA-A24 allele for the Malaysian population enabled reliable post-transplant chimerism assessment. The panel effectively distinguished donor from recipient cells, highlighting the utility of HLA antibody–based flow cytometry as a simple, sensitive, and rapid method for detecting chimerism and monitoring dynamic changes in immune cell subpopulations. This pilot study suggests that the anti–HLA-A24 panel has potential utility in the Malaysian context for providing clinically relevant information at the single-cell level. However, given the very limited sample size, these findings should be interpreted as preliminary validation. Larger, systematic studies are needed to validate the panel’s reliability, reproducibility, and clinical applicability before it can be recommended for broader use. Benchmarking against established molecular assays such as Short tandem repeats-PCR (STR-PCR) or next-generation sequencing should also be considered for validating accuracy and sensitivity. Additionally, this approach supports improved HLA matching, donor selection, personalized treatment planning, and graft monitoring, thereby enhancing clinical outcomes in Haplo-HSCT. Furthermore, the panel offers potential in refining graft-versus-host disease (GVHD) risk prediction and facilitating proactive management strategies more precisely.
Acknowledgement
The authors thank the Clinical and Biomedical Science Section, University Kuala Lumpur Institute of Medical Science Technology (UniKL MesTech), Kajang, Selangor and Faculty of Medicine, Universiti Malaya.
Funding Sources
The author(s) received no financial support for the research, authorship, and/or publication of this article.
Conflict of Interest
The author(s) do not have any conflict of interest.
Data Availability Statement
This statement does not apply to this article.
Ethics Statement
This study was approved by the Medical Research Ethics Committee (MREC) ID NO: 20191115-8029 at the University of Malaya Medical Centre (UMMC).
Informed Consent Statement
Written informed consent was obtained from all patients and volunteers before the initiation of the study and that it conforms to the standard currently applied in Malaysia. The privacy rights of human subjects were kept confidentiality.
Clinical Trial Registration
This trial is registered at the National Medical Research Register (NMRR) with registration no ID: 52851
Permission to reproduce material from other sources
Not applicable
Author Contributions
- Norhaida Che Azmi: University Project Supervisor, Review, Editing, Submission of Manuscript.
- Mohamad Zulkefly bin Mohamad Nazri: Data Collection, Analysis, Draft the Manuscript.
- Mohamad Shafiq Bin Azanan: UMMC Supervisor, Resources, Data Analysis.
References
- Alexander T, Greco R, Snowden JA. Hematopoietic Stem Cell Transplantation for Autoimmune Disease. Annual Review of Medicine. 2021;72(1):215-228. doi: https://doi.org/10.1146/annurev-med-070119-115617.
CrossRef - Rahman SHZ. HLA Typing and Chimerism Monitoring for Allogenic Haematopoietic Stem Cell Transplantation. Haematology Journal of Bangladesh. 2025;9(1):31-51. doi: https://doi.org/10.37545/ haematoljbd2025147.
CrossRef - Bader P. Documentation of Engraftment and Chimerism After HSCT. In: Carreras E, Dufour C, Mohty M, Kröger N, eds. The EBMT Handbook: Hematopoietic Stem Cell Transplantation and Cellular Therapies. 7th ed. Cham (CH): Springer; 2019.143-147.
CrossRef - Niederwieser D, Baldomero H, Szer J, et al. Hematopoietic stem cell transplantation activity worldwide in 2012 and a SWOT analysis of the Worldwide Network for Blood and Marrow Transplantation Group including the global survey. Bone Marrow Transplantation. 2016;51(6): 778-785.doi: https://doi.org/10.1038/bmt. 2016.18
CrossRef - Tozzo P, Delicati A, Zambello R, Caenazzo L. Chimerism Monitoring Techniques after Hematopoietic Stem Cell Transplantation: An Overview of the Last 15 Years of Innovations. Diagnostics. 2021;11(4): 621.doi: https://doi.org/10.3390/ diagnostics11040621
CrossRef - Lion T, Watzinger F, Preuner S, et al. The EuroChimerism concept for a standardized approach to chimerism analysis after alloge): 621.doiiii cell transplantation. Leukemia. 2012;26(8):1821-1828. doi: https://doi.org/10.1038/ leu.2012.66
CrossRef - Nucera S, Sindoni MM, Bugarin C, et al. A novel flow-cytometric based method to assess post-HSCT donor chimerism exploiting RNA hybridization. Bone Marrow Transplantation. Published online November 7, 2023. doi: https://doi.org/10.1038/s41409-023-02143-9
CrossRef - Dhaliwal JS, Shahnaz M, Too CL, et al. HLA-A, -B and -DR allele and haplotype frequencies in Malays. Asian Pac J Allergy Immunol. 2007;25(1):47-51.
- Choe W, Hwang MA, Jang S, Park CJ, Chi HS, Im HJ. Establishing a Population-Based HLA-Antibody Panel for Flow Cytometric Monitoring of Chimerism in HLA-Haploidentical Stem Cell Transplantation. Annals of Clinical and Laboratory Science. 2016;46(2):161-167.
- Abdelhamid Liacini, Tripathi G, McCollick A, et al. Chimerism Testing by Next Generation Sequencing for Detection of Engraftment and Early Disease Relapse in Allogeneic Hematopoietic Cell Transplantation and an Overview of NGS Chimerism Studies. International Journal of Molecular Sciences. 2023;24(14):11814-11814. doi: https://doi.org/10.3390/ijms241411814
CrossRef - Blouin AG, Ye F, Williams J, Askar M. A practical guide to chimerism analysis: Review of the literature and testing practices worldwide. Human Immunology. 2021;82(11):838-849. doi: 10.1016/j.humimm.2021.07.013
CrossRef - Lee KW, Cho HC. Serologic heterogeneity of HLA-A24 correlates with allelic types in the Korean population. J Korean Med Sci. 2000;15(6):623-626. doi:10.3346/jkms.2000.15.6.623
CrossRef - Dey P. Diagnostic Flow Cytometry in Cytology. Springer; 2021.
CrossRef - Andersen MN, Al-Karradi SNH, Kragstrup TW, Hokland M. Elimination of erroneous results in flow cytometry caused by antibody binding to Fc receptors on human monocytes and macrophages. Cytometry Part A: The Journal of the International Society for Analytical Cytology. 2016;89(11):1001-1009. doi: https://doi.org/10.1002/cyto.a.22995
CrossRef - Harjanto S, Ng LFP, Tong JC. Clustering HLA Class I Superfamilies Using Structural Interaction Patterns. Kobe B, ed. Plos One. 2014;9(1): e86655. doi: https://doi.org/10.1371/journal.pone.0086655
CrossRef - Makowski EK, Wu L, Desai AA, Tessier PM. Highly sensitive detection of antibody nonspecific interactions using flow cytometry. mAbs. 2021;13(1): 1951426.doi: https://doi.org/10.):1951426.doi.2021. 1951426
CrossRef

