
Manuscript accepted on :15-09-2025
Published online on: 25-09-2025
Plagiarism Check: Yes
Reviewed by: Dr. Naha Ananya
Second Review by: Dr. Randa Salah Gomaa Mahmoud
Final Approval by: Dr. Eman Refaat Youness
Abdulkareem Mokif Obais
Department of Biomedical Engineering, University of Babylon, Al-Hilla, Babylon, Iraq
Corresponding Author E-mail: eng.abdul.kareem@uobabylon.edu.iq
DOI : https://dx.doi.org/10.13005/bpj/3243
Abstract
The electrocardiogram (ECG) signal is vulnerable to various noise interferences during recording, which compromises the precision of subsequent diagnosis. ECG readings, essential for detecting cardiovascular disorders, are highly susceptible to noise, notably power line interference (PLI) at frequencies of 50 or 60 Hz. Severe PLI can obscure or completely conceal specific components, such as P-waves and QRS complexes. The extraction of untainted ECG signals from polluted data is a fundamental difficulty in biomedical signal processing. This paper introduces an adaptive experimental technique for removing the 50Hz power line component from a severely damaged ECG signal by employing iterative 50Hz subtraction circuits and high-order low-pass filters to eliminate various harmonics of 50Hz and other noise sources. The experimental results completely correspond with the design methodology. The resulting ECG signal is suitable for cardiovascular diagnostics. The implemented circuit is low-cost, and all its components are readily available on the market. This device can extract a pristine ECG signal from a noisy environment.
Keywords
Adaptive filtering; ECG spectrum; ECG extraction methods; Electrocardiographic; Power line removal; QRS-complex
Download this article as:| Copy the following to cite this article: Obais A. M. Extracting an Extremely Corrupted ECG Signal. Biomed Pharmacol J 2025;18(3). |
| Copy the following to cite this URL: Obais A. M. Extracting an Extremely Corrupted ECG Signal. Biomed Pharmacol J 2025;18(3). Available from: https://bit.ly/4myekgo |
Introduction
Various forms of power line interference (PLI) at 50/60 Hz typically alter biomedical measures, including ECG signals, leading to erroneous disease diagnosis. A novel technique for eliminating power line interference (PLI) from electrocardiogram (ECG) readings was developed by employing an orthogonal basis to distinguish between signal and noise.1 The technique was simple, computationally efficient, and superior to current methods at that time. It was simulated and assessed in MATLAB, resulting in enhanced signal quality.1 Several methods were applied through the use of difference equations to determine the ideal initial weights for adaptive filters. The derived analytical response of such methods determines the suitable weights and indicates that the mean squared error is contingent upon the initial weight.2 The proposed method was utilized to eradicate the known frequency PLI signal in the ECG signal. The PLI signal was recognized as a composite of sinusoidal signals. The adaptive filter endeavors to modify the amplitudes of these sinusoidal signals to prepare a reference signal closely resembling the contaminated PLI signal. Noise cancellation in ECG signals is crucial for identifying features, with PLI being the main noise source. Digital notch filters effectively attenuate interference, but transient interferences and ringing effects occur. An adaptive notch filter (ANF) can be used to improve PLI cancellation. An algorithm required a rapid Fourier transform, and used a spectrum correction was proposed to estimate harmonic parameters.3 The compensating signal was integrated from multiple Fast Fourier Transform (FFT) spectrum bins, reducing PLI. The proposed ANF required no parameter specification, surpassing traditional notch filters. Signal analysis is a sophisticated procedure that automates data evaluation, especially within the medical domain. Physiological signals are progressively utilized, particularly in extensive datasets comprising thousands of characteristics.3 A review was presented to examine ECG signals and feature extraction approaches pertinent to digital health and artificial intelligence (AI) applications.4 Feature extraction diminishes signal dimensionality and facilitates data compaction, hence enhancing the efficiency of machine learning and deep learning models. The review addressed ECG signal processing and feature extraction across many domains, offered pseudocode for replication, examined deep features and machine learning integration, and contemplated future advancements in feature extraction for ECG signal analysis. PLI may distort biological records, resulting in erroneous disease diagnosis. Effective interference mitigation strategies are required to eradicate these interferences without jeopardizing intrinsic signal characteristics. A revised methodology utilizing the variational mode decomposition technique was introduced to eradicate PLI from ECG signals.5 The method established the core frequency of an intrinsic mode function to correspond with the normalized power line disturbance frequency. The experimental results indicated that the PLI signal was precisely captured in both magnitude and phase and then removed. The proposed methodology was evaluated using ECG signal recordings from the MIT-BIH (Massachusetts Institute of Technology–Beth Israel Hospital) Arrhythmia database and compared against traditional notch filtering techniques. An effective ECG denoising method utilizing empirical mode decomposition (EMD), sample entropy, and an enhanced threshold function was proposed to eliminate noise from ECG data, hence enhancing diagnostic accuracy for automated medical systems.6 The procedure had three phases: EMD decomposition, novel threshold function denoising, and signal reconstruction and smoothing. Simulation results demonstrate that the approach is resilient to several noise types and enhances both signal to noise ratio (SNR) and mean square error (MSE). The noise removal technique suggested for ECG signals is an efficacious strategy to enhance diagnostic capabilities in automated medical systems.7 It tackles the problem of noise in ECG signals, which can be alleviated by an adaptive mechanism. The technology is consistent with current ECG noise reduction techniques and can substantially improve heart state assessment. A methodology for PLI removal in ECG data, devoid of thresholding methods, entailed detecting the frequency ranges of the ECG and noise, nullifying wavelet detail coefficients, and augmenting the signal by the inverse discrete wavelet transform.8 The optimal wavelet function for denoising was Symlet 8, which outperformed thresholding and notch filter approaches for 75% of synthetic signals and 100% of real signals. The method was applicable for high frequency denoising without prior knowledge of the frequency.8 ECG interference in intensive care unit (ICU) patients can compromise diaphragm electromyogram (EMGdi) signals.9 Estimated ECG Subtraction (EES) is a method that removes ECG interference from esophageal EMGdi recordings. It involves determining ECG artifact timing, estimating normalized ECG, and subtracting denormalized ECG estimates.9 This method surpasses wavelet-based filters and improves therapeutic diaphragm activity monitoring. A comparison of various methods for correcting baseline drift in ECG signals was presented.10 A novel adaptive technique for the rectification of baseline drift was proposed. The approach involved modifying the reference signal of the adaptive filter by multiresolution wavelet transformations of the ECG signal. Various baseline drift correction approaches were evaluated for their efficacy in processing model ECG signals affected by baseline drift of differing strengths. The method for subtracting PLI from high sample rate ECG signals was discussed and implemented with modifications to guarantee efficient removal.11 It suggested a methodology to address frequency deviation and introduced a revised procedure implementation program. Results from the simulated tests were also disclosed. ECG signals often contain residual PLI, and various methods have been developed to reduce interference. The subtraction process is known for eliminating interference while preserving the signal spectrum. The PLI is derived from the distorted signal using a second-order band-pass filter, with minimal phase error. The subtraction process is used to rectify discrepancies between moving averaged PLI signal samples and their actual positions.12 A PLI reduction method utilizing a current-reused current-feedback instrumentation amplifier (CFIA) for ECG recording was established to inhibit the unwanted PLI from compromising the quality of ECG recordings by constraining an input common-mode voltage to the saturation region of the input transistor of the CFIA.13 The proposed circuit exhibited a total power consumption of 18 W at 1.8 V.
The frequency spectrum of the ECG signal is very important in its detection and diagnostic purposes. A new method for identifying ventricular fibrillation (VF) in brief ECG episodes was developed.14 VF is a common arrhythmia in cardiac arrest patients, and its detection is crucial for timely defibrillation. The method used stochastic waveforms and a deterministic Probability Density Function for physical variations. It outperformed nine established VF detection algorithms, providing new insights into VF dynamics. The efficacy of wavelet transform-based QRS detection was evaluated against the Pan Tompkins method and derivative-based QRS detection, emphasizing sensitivity, accuracy, positive predictive value, and detection error.15 The proposed methodology attained an accuracy of 93.35% and a specificity of 90%, surpassing current methods in the detection of QRS complexes in ECG signals. A study introduced an effective system for evaluating the quality of mobile electrocardiogram (ECG) signals.16 The method employed heuristic fusion and fuzzy assessment of Signal Quality Indexes (SQIs) across many parameters. The methodology comprised two components: quantification and extraction of SQIs, and intelligent evaluation and classification. The approach attained an accuracy of 97.67%, sensitivity of 96.33%, and specificity of 98.33% on the training set, and 94.67%, 90.33%, and 93.00% on the test datasets. Numerical approaches to interpret ECG signals and detect the QRS complex, utilizing data from cardiac monitoring, were addressed.17 The study evaluated wavelet transforms’ fundamental functionalities on 1000 data points, providing valuable insights into individual health. Convolutional neural networks (CNNs) were employed to assess and utilize pre-trained higher-order spectral estimations of cardiac arrhythmias in electrocardiograms (ECGs).18 The research utilized transfer learning techniques with pre-trained convolutional neural networks, specifically AlexNet and GoogleNet, for the automated diagnosis of ECG arrhythmias. The system attained an average accuracy of 97.8% utilizing third cumulants and GoogleNet, establishing it as an efficient automatic cardiac arrhythmia categorization technique. ECG is a prevalent method for documenting the electrical activity of the human heart. Precise computer analysis of ECG signals is difficult due to their susceptibility to high-frequency noise and numerous distortions resulting from their low amplitude. In remote healthcare systems, the sophisticated analysis of ECG signals is conducted by powerful machine learning algorithms. The precision of these methods depends on the Signal-to-Noise Ratio (SNR) of the input ECG signal.19 Cardiovascular illnesses pose a significant risk to life, and the analysis of ECG signals is essential for diagnosis and arrhythmia identification. A feature extraction technique utilizing bispectrum and 2D graph Fourier transform was devised to derive features from eigenvalues, employing a Radial Basis Function Support Vector Machine (SVM-RBF) for the classification of arrhythmic heartbeats.20 The model attained a classification accuracy of 96.2%, as per cross-validation findings. Ventricular arrhythmias (VA) are abnormal, rapid heart rhythms caused by erroneous electrical impulses in the heart’s ventricles. A novel deep learning methodology employs nonlinear ECG signals for the detection of ventricular arrhythmias (VA). The procedure entails converting ECG signals into novel images, normalizing these images, training models, extracting deep features, fusing features, selecting the optimal features, and employing supervised learning classifiers.21 The MIT-BIH dataset attained an accuracy of 97.6%.21 In a 12-lead electrocardiogram (ECG) assessment, the ECG signals frequently exhibit low-quality data issues attributable to high-frequency noise from muscular activity and low-frequency noise from bodily movement and respiration. These issues result in delays in examination outcomes and escalate medical expenses. Addressing issues related to low-quality and absent ECG data can enhance patient care, hence decreasing productivity loss and healthcare expenses.22 This study aims to create a signal restoration model for each of the 12 signals to address the issues of low-quality and missing data resulting from mechanical and operator faults during 12-lead ECG tests. ECG signals are invariably compromised by numerous types of noise during acquisition and transmission. The presence of noise may generate inaccurate information on cardiac health, thereby hindering specialists from conducting accurate analyses. ECG signals are consistently affected by several forms of noise during acquisition and transmission. Noise may produce erroneous data regarding cardiac health, consequently obstructing doctors from doing precise assessments. A proficient methodology for denoising ECG signals utilizing a time-frequency framework grounded in S-transform and bi-dimensional empirical mode decomposition was introduced.23 This approach maps an ECG signal into a subspace, decomposes the ST-based time-frequency representation, and subsequently employs non-local mean (NLM) to eliminate noise and restore the characteristics of the ECG signal. The method surpasses current wavelet-based techniques and NLM filtering, effectively attenuating noise while maintaining ECG signal attributes. A study examined the quality of an elderly individual’s ECG signal using optical wireless links.24 The system used infrared signals from an emitter on the wrist to detectors on the ceiling. The study used signal quality indexes (SQIs) to assess the signal’s spectral and statistical features. The methodology simulated the entire ECG process, considering the elderly’s mobility. Results showed optical wireless communication technologies can reliably monitor ECGs, with superior quality achieved with a minimum signal-to-noise ratio. The CardioGPT model is employed to analyze electrocardiograms through natural language, representing an innovative method for ECG classification.25 The model was utilized on a dataset of ECGs from adult patients, featuring 60 unique rhythms or conduction anomalies described by cardiologists. The model was assessed utilizing Bilingual Evaluation Understudy (BLEU) and Recall-Oriented Understudy for Gisting Evaluation (ROUGE) metrics. The results demonstrated favorable performance metrics across many evaluation criteria, with the CardioGPT model attaining elevated scores in BLEU and ROUGE. The model tackles the issue of imbalanced learning in ECG classification tasks, offering significant insights into fundamental patterns and anomalies.
In this work, two sequential 4th order 72Hz lowpass filters, two subsequent subtraction circuitries, and a notch filter are mostly used to clean a damaged ECG signal from PLI components and other noises.
Materials and Methods
ECG signals indicate the heart’s electric activity, causing contraction of heart muscle cells and depolarization of nearby cardiac cells.26 The rapid flow of sodium ions causes the depolarization wave, while the cells recover and exhibit resting negative potential in a repolarization phase. The electric current surrounding the heart is caused by ion movement in cardiac muscle cells, and the ECG signal’s structure and cyclic repetitive components like the P-QRS-T complex shown in Figure 1 provide crucial information about the heart’s electrical conduction system.26
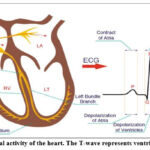 |
Figure 1: The electrical activity of the heart. The T-wave represents ventricular repolarization26Click here to view Figure |
ECG signals are a crucial biomedical tool, but they pose challenges in registration, processing, and analysis due to their nonstationarity, noise susceptibility, and variability among individuals. The main sources of noise are the changes in body-electrode impedance, patient movement, and baseline wandering. Muscle disturbances, caused by patient movement or environmental temperature are challenging to manage due to their broad frequency spectrum. Power interferences, caused by high power devices, and impulse-type interferences, such as diathermy, are also significant disturbances. These disturbances affect ECG signals in various categories.8-10 Here, an experimental system is introduced for recovering severely vanished ECG signals due to power line interference. The adopted method focuses on removing the power line voltage component that obscures the targeted ECG signal. Since the waveform of the power line voltage is exposed to multiple harmonic distortions, it is recommended to treat this distortion within its component that masks the ECG signal required to be extracted for diagnosing cardiovascular conditions. In the presented method, two wet electrodes are used to detect the ECG signal. Figure 2 shows the schematic design of the presented method.
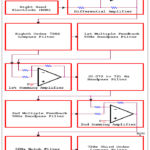 |
Figure 2: Schematic design of the proposed methodClick here to view Figure |
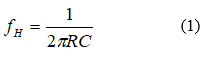
The potential difference between the left and right hand electrodes is amplified using a differential amplifier. It is anticipated that the output of this amplifier will contain a very weak ECG signal that is masked by a PLI voltage component operating at 50 Hz. This component is likely exposed to multiple harmonic’ distortions, including 100Hz, 150Hz, and other higher harmonics. A higher-order lowpass filter (LPF) with a cutoff frequency below 100 Hz can be used to reduce the distortion caused by numerous harmonics. The cutoff frequency fH of the higher order LPF is set at 72 Hz in order to balance between maintaining the ECG signal and removing multiple harmonics’ distortion. To reduce the complexity of the experimental circuit, an eighth-order LPF is utilized to approximately purify the 50Hz voltage component that obscures the weak ECG signal. To accomplish a greater reduction in the circuit complexity, the 8th order LPF is implemented using two successive 4th order LPFs. Each 4th order LPF is designed using four successive first order RC LPFs as shown in Figure 3. These first order LPFs are designed such that each filter circuit has negligible loading effect on preceding and next filter stages, thus the cutoff frequency fH of the 1st order LPF can be given by27
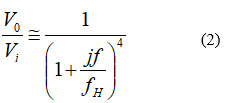
Where R and C are the basic resistance and capacitance of the LPF components, respectively. The overall transfer function Vo/Vi of the 4th order LPF can be approximated at any frequency f to
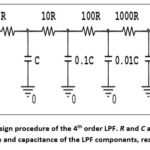 |
Figure 3: Design procedure of the 4th order LPF. R and C are the basic resistance and capacitance of the LPF components, respectivelyClick here to view Figure |
For a cutoff frequency fH of 72Hz and a filter resistance R of 0.22kΩ, the filter capacitance C is equated to 10µF. The 8th order LPF is implemented using two successive 4th LPFs separated by an operational amplifier (Op Amp) buffer as shown in Figure 4.
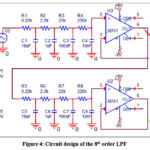 |
Figure 4: Circuit design of the 8th order LPFClick here to view Figure |
Figure 5 shows the frequency responses of 4th and 8th orders LPFs. The 8th order LPF reveals significant elimination of frequencies above 100Hz. The main task in this work is to recover the ECG signal obscured by PLI. This can be carried out by subtracting the power line component from the raw signal containing the weak ECG.
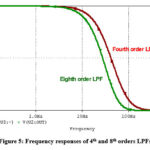 |
Figure 5: Frequency responses of 4th and 8th orders LPFsClick here to view Figure |
Since the raw ECG signal after the 8th order LPF contains almost a purified 50Hz component, it is possible to subtract this component by using a multiple feedback bandpass filter (MFBPF) and a summing amplifier, as shown in Figure 6.
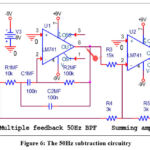 |
Figure 6: The 50Hz subtraction circuitryClick here to view Figure |
The MFBPF is designed such that it has a resonant frequency fR of 50Hz and C1MF=C2MF=CMF=100nF. The following design equations are applicable to this filter27
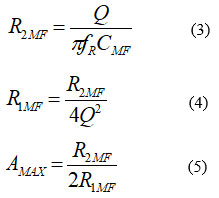
Where Q is the quality factor and Amax is the maximum gain at the resonance frequency. If fR=50Hz, CMF=100nF, and Amax=5, then according to (3)–(5), Q, R1MF, and R2MF will be 1.581, 10kΩ, and 100kΩ, respectively. The gain Amax is reversed at the resonant frequency fR. The Op Amp LM741 is used to drive the MFBPF and summing inverting amplifier. Two 9V DC sources or batteries are used to operate the Op Amp. The summing amplifier is designed such that it subtracts the output voltage of MFBPF from the main AC input. Note that the output of the summing amplifier reverses the AC input voltage components.
The frequency responses of MFBPF and the summing inverting amplifier are shown in Fig. 7. Since the output of the MFBPF exhibits a voltage level of 5V for an AC input amplitude of 1V, the gain values of the summing amplifier to the MFBPF output should be -0.2 or (-1/5) and -1 to the main AC input. Such gain values of the summing amplifier guarantee significant removal of the 50Hz voltage component from the input signal, as reflected by the response of the summing amplifier.
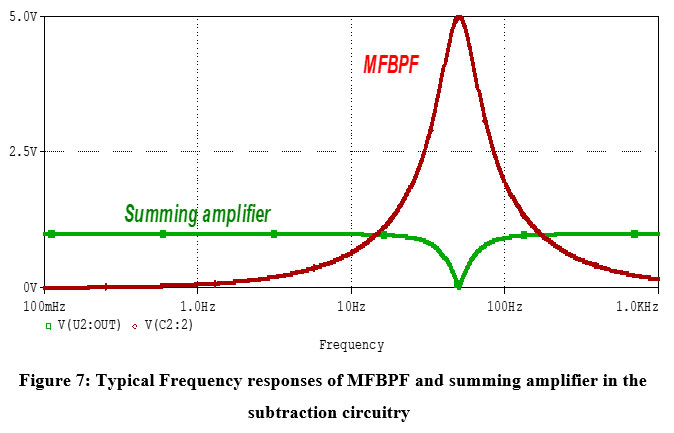 |
Figure 7: Typical Frequency responses of MFBPF and summing amplifier in the subtraction circuitryClick here to view Figure |
Circuit design of the proposed extraction method
Figure 8 shows a complete PSpice design of the proposed extraction method. A (0.72 to 72) Hz bandpass filter (BPF), which attenuates the frequencies above 72 Hz and prohibits very low frequencies, receives the output of the first summing amplifier as shown in Figures 2 and 8. Furthermore, the DC offset linked to the processed raw signal is eliminated by this BPF. The output of this filter is anticipated to be a sinusoidal signal profile running at 50Hz and exhibiting an inverted ECG signal due to the inversion action of the first summing amplifier. The 50Hz notch filter is designed such that its cutoff frequency fN is determined by27
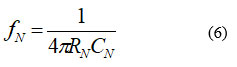
Where RN and CN are the basic design components of the notch filter. For CN of 1µF, RN is 1.591kΩ. In Figure 8, R27=R28=2RN≈3.3kΩ, C19=C20=CN=1µF, R32=RN≈1.5kΩ, and C15=2CN≈2.2µF.
 |
Figure 8: Circuit design of the proposed methodClick here to view Figure |
The Experimental Prototype of the Proposed ECG Extraction Method
The circuit shown in Figure 8 is implemented using low-cost electronic components as shown in Figure 9. These components are commercially available. A digital oscilloscope is used to pick the experimental results. All electronic components are gathered on a single breadboard.
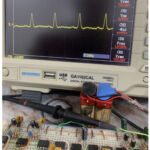 |
Figure 9: A photo of the experimental circuitClick here to view Figure |
Result
Two wet ECG electrodes are employed to capture the ECG signal from the human body. One electrode is affixed to the left arm, while the second is positioned on a matching location on the right arm. A 100Hz digital oscilloscope is employed to gather the experimental data. Figures 10-17 show the output signals at several locations inside the experimental circuit. Figure 10 illustrates the unprocessed ECG signal at the output of the differential amplifier. It exhibits an absence of an ECG signal.
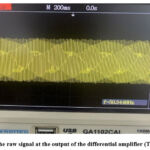 |
Figure 10: The raw signal at the output of the differential amplifier (TB=200m/div)Click here to view Figure |
Figure 11 shows the output of the second fourth-order 72Hz low-pass filter. It discloses an enhanced clean 50Hz sinusoidal waveform. This waveform is anticipated to include a vanishing or unseen ECG signal on its envelope.
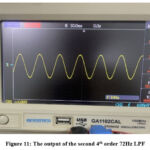 |
Figure 11: The output of the second 4th order 72Hz LPFClick here to view Figure |
Figure 12 illustrates the output of the first multiple feedback 50Hz bandpass filter. It demonstrates a pure power line voltage of 50Hz with an amplitude five times that of its preceding stage (the second fourth-order low-pass filter). This waveform is anticipated to be mostly free from ECG contents.
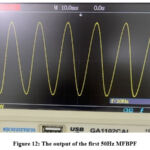 |
Figure 12: The output of the first 50Hz MFBPFClick here to view Figure |
Figure 13 illustrates the output of the initial summing inverting amplifier. The envelope of the acquired waveforms displays a discernible inverted representation of the ECG signal. This is due to the inverting action of the summing amplifier.
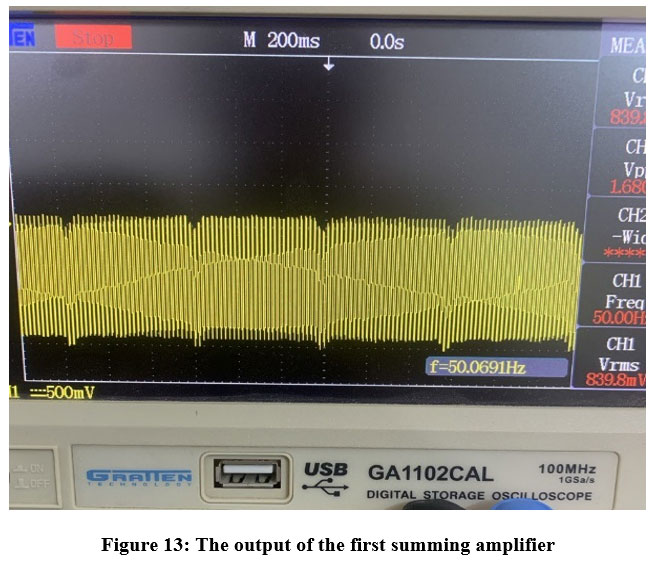 |
Figure 13: The output of the first summing amplifierClick here to view Figure |
Figure 14 displays the output of the second multiple feedback 50Hz bandpass filter. It indicates a fundamental power line frequency of 50Hz with an amplitude five times greater than that of its preceding stage (the (0.072-72) Hz bandpass filter). The anticipated function of the second multiple feedback 50Hz bandpass filter is a thorough cancellation of the frequency contents above 50Hz.
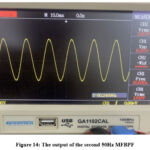 |
Figure 14: The output of the second 50Hz MFBPFClick here to view Figure |
Figure 15 shows the output of the second summing amplifier. This figure demonstrates a substantial decrease in PLI and increased recognition in the extracted ECG signal.
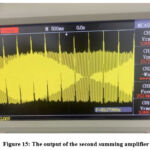 |
Figure 15: The output of the second summing amplifierClick here to view Figure |
Figure 16 shows the output of the notch filter. However, a noise component is present, which will be addressed in the final step of this design, represented by the third-order 50Hz low-pass filter.
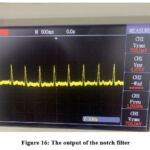 |
Figure 16: The output of the notch filterClick here to view Figure |
Figure 17 shows the output of the final stage in this design, represented by the third-order 50Hz low-pass filter.
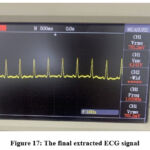 |
Figure 17: The final extracted ECG signalClick here to view Figure |
Discussion
The recovered ECG signal is obtained from a highly noisy environment. The majority of noise originates from voltage components caused by power line interference. The extracted ECG signal appears relatively clear, with all components distinctly visible, including the P-wave, QRS complex, and T-wave. The final ECG signal experimentally obtained in this work exhibits a good form in comparison to those works mentioned in previous literature,6-10, 22-25 most of which were retrieved using various denoising techniques. The experimental results align with the expected output of each stage in the implemented prototype.
Conclusion
The extraction of ECG signals, which use the heart’s characteristic P, QRS, and T waveforms to capture electrical activity, is a crucial part of cardiac health monitoring. In order to recover a clean ECG signal from a completely corrupted raw signal caused by significant distortion from 50Hz power line interference and other potential sources of noise, a low-cost experimental circuit is proposed in this study. The main extraction strategy focuses on the removal of the 50Hz power line component from the raw ECG signal by using an adaptive filtering process and subtraction method. The sharp response of the MFBPF preserves the components of the ECG signal in the vicinity of 50Hz, which leads to better detection. The experimental results show a coincidence with the anticipated output of each stage in this design. The final extracted ECG is clean and suitable for the diagnosis of cardiovascular disorders.
Acknowledgment
The author would like to thank the Department of Biomedical Engineering, University of Babylon, Iraq for offering assistance to complete this work.
Funding source
The author received no financial support for the research, authorship, and/or publication of this article.
Conflict of Interest
There is no conflict of interest in this work.
Data Availability Statement
This statement does not apply to this article.
Ethics Statement
This research did not involve human participants, animal subjects, or any material that requires ethical approval.
Informed Consent Statement
This study did not involve human participants, and therefore, informed consent was not required.
Clinical Trial Registration
This research does not involve any clinical trials.
Permission to reproduce material from other
Not Applicable.
Author Contributions
The sole author was responsible for the conceptualization, methodology, data collection, analysis, writing, and final approval of the manuscript
References
- Poornachandra S, Kumaravel N. A novel method for the elimination of power line frequency in ECG signal using hyper shrinkage function. Digital Signal Processing. 2008;18(2):116-126.
CrossRef - Manosueb A, Koseeyaporn J, Wardkein P. PLI Cancellation in ECG Signal Based on Adaptive Filter by using Wiener-Hopf Equation for Providing Initial Condition. Math. Methods Med. 2014;2014:1-11.
CrossRef - Chen B, Sun W, He W. Removal of Power Line Interference from ECG signals using Adaptive Notch Filters of Sharp Resolution. IEEE Access. 2019;7:150667-150676.
CrossRef - Singh A, Krishnan S. ECG signal feature extraction trends in methods and applications. Biomedical Engineering Biomed. Eng. Online. 2023;22(1):1-36.
CrossRef - Mohan N, Kumar S, Poornachandran P, Soman K. Modified Variational Mode Decomposition for Power Line Interference Removal in ECG Signals. J. Electr. Comput. Eng. 2016;6(1):151-159.
CrossRef - Zhang D, Wang S, Li F, et al. An Efficient ECG Denoising Method Based on Empirical Mode Decomposition, Sample Entropy, and Improved Threshold Function. Wireless Commun. Mobile Comput. 2020;2020:1-11.
CrossRef - Hussein A, Mohammed W, Jaber M, Khalaf O. An Adaptive ECG Noise Removal Process Based on Empirical Mode Decomposition. Contrast Media and Molecular Imaging. 2022;2022:1-9.
CrossRef - Oliveira B, Duarte M, Abreu C, Filho J. A wavelet-based method for power-line interference removal in ECG signals. Biomed. Eng. 2018;34:73-86.
CrossRef - Jonkman A, Juffermans R, Doorduin J, Heunks L, Harlaar J. Estimated ECG Subtraction method for removing ECG artifacts in esophageal recordings of diaphragm EMG. Signal Process. Control. 2021;69:1-9.
CrossRef - Fedotov A. An Adaptive Method for Correction of the ECG Signal Baseline Drift Using Multiresolution Wavelet Transforms. Eng. 2022;55(6):420-424.
CrossRef - Mihov G. Subtraction Procedure for Power-line Interference Removal from ECG Signals with High Sampling Rate. J. Bioautomation. 2018;22(2):147-158.
CrossRef - Dotsinsky I, Stoyanovmm T, Mihov G. Power-line Interference Removal from High Sampled ECG Signals Using Modified Version of the Subtraction Procedure. International Journal Bioautomotion. 2020;24(4):381-392.
CrossRef - You D, Heo H, Kim H, Kwon Y, Lee S, Ko H. Power Line Interference Reduction Technique with a Current-Reused Current-Feedback Instrumentation Amplifier for ECG Recording. Sci. 2020;10(23): 1-12.
CrossRef - Bakucz P. Universal Fluctuations in Very Short ECG Episodes. Acta Polytech. Hung. 2014;11(7):73-82.
CrossRef - Subramanian B. ECG signal classification and parameter estimation using multiwavelet transform. Res. 2017;28(7):3187-3193.
- Zhao Z, Zhang, Y. SQI Quality Evaluation Mechanism of Single-Lead ECG Signal Based on Simple Heuristic Fusion and Fuzzy Comprehensive Evaluation. Physiol. 2018;9:1-13.
CrossRef - Molavi-Arabshahia M, Lashgari P. Interpretation ECG signals by using wavelet analysis. J. Nonlinear Anal. Appl. 2020;11(2):329-337.
- Alquran H, Alqudah A, Abu-Qasmieh I, Al-Badarneh A, Almashaqbeh S. ECG Classification Using Higher Order Spectral Estimation and Deep Learning Techniques. Neural Netw. World. 2019;29(4):207-219.
CrossRef - Ul-Haque Z, Qureshiy R, Nawazy M, Khuhawar F, Tunioz N, Uzair M. Analysis of ECG Signal Processing and Filtering Algorithms. J. Adv. Comput. Sci. Appl. 2019;10(3):545-550.
CrossRef - Liu S, Shao J, Kong T, Malekian R. ECG Arrhythmia Classification using High Order Spectrum and 2D Graph Fourier Transform. Sci. 2020;10(14):1-23.
CrossRef - Naz M, Shah J, Khan M, Sharif M, Raza M, Damaševičius R. From ECG signals to images: a transformation based approach for deep learning. Peer J Comput. Sci. 2021;7(1):1-18.
CrossRef - Yoo H, Yum Y, Kim Y, Kim J-H, Park H-J, Joo H. Restoration of missing or low-quality 12-lead ECG signals using ensemble deep-learning model with optimal combination. Signal Process. Control. 2023;83:1-10.
CrossRef - Bing P, Liu W, Zhai Z, et al. A novel approach for denoising electrocardiogram signals to detect cardiovascular diseases using an efficient hybrid scheme. Cardiovasc. Med. 2024;11:1-11.
CrossRef - Chehbani A, Sahuguede S, Julien-Vergonjanne A, Bernard O. Quality Indexes of the ECG Signal Transmitted Using Optical Wireless Link. Sensors. 2023;23(9):1-16.
CrossRef - Fu G, Zheng J, Abudayyeh I, et al. CardioGPT: An ECG Interpretation Generation Model. IEEE Access. 2024;12: 50254-50264.
CrossRef - Gacek A, Pedrycz W. ECG signal processing, classification and interpretation: a comprehensive framework of computational intelligence. Springer;2014.
- Carter B, Mancini R. Op Amps for Everyone. Newnes: An imprint of Elsevier. 5th 2017.

