
Manuscript accepted on :23-04-2025
Published online on: 20-05-2025
Plagiarism Check: Yes
Reviewed by: Dr. Digamber Singh
Second Review by: Dr. Karthikeyan
Final Approval by: Dr. Prabhishek Singh
Sandeep Sharma1* , Saruchi2, Avneesh Narwal, Kanaparthi Chandra Meghana1, Manjeet Singh1, Rohit Kumar Maurya1 and Yash Upadhyay1
1Department of Computer Science Engineering, Lovely Professional University, Phagwara Punjab, India
2Department of Computer Science Engineering Chandigarh University, Gharuan, Mohali, Punjab India.
Corresponding Author E-mail: sanintel123@gmail.com
DOI : https://dx.doi.org/10.13005/bpj/3165
Abstract
Chronic kidney disease is a progressive condition that often remains undiagnosed until its later stages due to the absence of noticeable symptoms. Early detection is essential for timely intervention and treatment. Whereas other research has mostly centered on the detection of kidney disease in later stages, this research contributes to the field by combining predictive modeling in order to ascertain disease progression in earlier phases. Through the use of both multi-classification and binary classification methods, this research improves the knowledge of chronic kidney disease progression, enabling specific treatment approaches. Sophisticated machine learning algorithms like K-Nearest Neighbor, Decision Tree, and Random Forest have been used to evaluate the accuracy of disease stage prediction. Comparative analysis of different predictive models indicates their efficiency, resulting in enhanced diagnostic accuracy and efficiency. This study adds value to the health industry through the application of machine learning in the early diagnosis and improved management of diseases. Disease prediction enables clinicians to apply timely interventions, minimize complications, and in the end, decrease morbidity and mortality rates related to kidney disease. All these activities come in line with the world aim of enhancing health outcomes and well-being. The anticipated predictive model evidenced a precision rate of 99.16 percent, outpacing other studies using different machine learning classifiers such as Random Forest Classifier, Ada Boost Classifier, Cat Boost, Stochastic Gradient Boosting, Gradient Boosting Classifier, Extreme Gradient Boosting, K-Nearest Neighbor, Extra Trees Classifier, and Decision Tree Classifier. This paper strengthens the importance of artificial intelligence in promoting the diagnostics of chronic kidney disease as well as outcomes in patient care.
Keywords
Chronic Kidney Disease; Decision tree; K-Nearest Neighbors; Machine learning; Random forest
Download this article as:| Copy the following to cite this article: Sharma S, Saruchi S, Narwal A, Meghana K. C, Singh M, Maurya R. K, Upadhyay Y. Machine Learning Algorithm for Detecting and Predicting Chronic Kidney Disease. Biomed Pharmacol J 2025;18(2). |
| Copy the following to cite this URL: Sharma S, Saruchi S, Narwal A, Meghana K. C, Singh M, Maurya R. K, Upadhyay Y. Machine Learning Algorithm for Detecting and Predicting Chronic Kidney Disease. Biomed Pharmacol J 2025;18(2). Available from: https://bit.ly/45glOQ6 |
Introduction
Chronic Kidney Disease (CKD) is a growing worldwide health issue that has a profound effect on patient outcomes, mortality, and healthcare utilization. CKD prevalence has increased exponentially over the years, placing a greater burden on healthcare systems and influencing millions of people globally. CKD results from injured kidneys losing their function to effectively remove waste products from the blood, a process necessary forurine formation.As CKD advances, waste products build up in the body and result in serious complications. The likelihood of developing CKD is affected by several factors, such as age, gender, and whether or not one has underlying medical conditions like diabetes and hypertension—two of the most common causes of permanent kidney damage.
Role of Artificial Intelligence in Pathological Correlation
Artificial intelligence (AI) is being used more and more in medical research to improve the precision of disease diagnosis and prognosis. In the context of pathological correlation, AI models can examine large collections of clinical and histopathological information, identifying patterns that may not be immediately apparent with conventional methods. Machine learning algorithms can assist in the early detection of chronic kidney disease (CKD) by predicting disease progression from patient data, laboratory results, and imaging reports. Artificial intelligence-aided histopathologic assessment also aids in the increased detection of tubular and glomerular changes and enables finer classification of nephropathies. Predictive models with incorporated AI can even assist clinicians to optimize treatment planning by correlating real-time data of patients and forecasted pathological outcomes. Integration of AI within nephrology not only maximizes diagnostic correctness but also promises personalized medicine measures towards improved care of patients.
Other than its uses in diagnosis, AI plays an essential role in the automation of pathological assessment.
Artificial intelligence-driven digital pathology platforms use deep learning algorithms to recognize subtle changes in tissue samples that are easy to overlook for pathologists. The platforms normalize assessments and reduce inter-observer variability, ensuring uniformity in disease classification. Natural language processing tools fueled by AI also analyze vast amounts of literature published to give insights into novel biomarkers and new treatment regimens to support evidence-based medicine.
A further significant application of AI in nephrology is that it can potentially simulate the development of diseases via computational simulations. AI-based simulation can predict the response of CKD patients to various therapeutic approaches, thus providing personalized therapy. AI also allows telemedicine through integration with wearable sensors monitoring renal function biomarkers continuously, which alert physicians about oncoming signals of worsening of disease. Such advancements augment the management of patients and reduce the burden on the healthcare system.
From the beginning, AI has revolutionized the science of pathological correlation with improved diagnostic accuracy, test standardization, and predictive analysis. Its inclusion in nephrology maximizes early detection of disease, tailoring treatment protocols, and real-time patient tracking, thereby driving improved clinical outcomes. Emerging development in AI will continue to perfect its application, leading to ever more complex and data-informed methods of research and management in kidney disease.
Early Stages of Kidney Diseases
The effect of CKD transcends personal health, exerting a significant burden on healthcare systems and economies. Due to its increasing burden, prevention, early detection, and creative management approaches are essential. CKD has been estimated to afflict around 10% of the world’s population, with increased prevalence in low- and middle-income nations. In spite of its broad base, most early CKD is asymptomatic because the body accommodates impaired kidney function. CKD is thus often inadvertently identified during regular check-ups and investigations for other conditions. Early detection of CKD is important since delayed treatment by medications and lifestyle changes can delay progression of the disease and avoid severe consequences.
When CKD is not identified early or continues to progress despite being treated, prodromal symptoms of kidney failure, the most severe stage of the disease, manifest in patients. Recent research has indicated a 6.23% rise in hospitalization in patients with CKD worldwide despite the fact that mortality stays constant. This emphasizes the importance of holistic measures for treating and preventing CKD-related complications.
This research attempts to examine several dimensions of CKD, such as its epidemiology, risk factors, clinical presentation, diagnostic strategies, treatment methods, and public health relevance. By scanning research findings, clinical guidelines, and international activities, this research attempts to increase the understanding of CKD while highlighting the value of early diagnosis and intervention in averting undesirable health consequences. It situates CKD in perspective compared to other NCDs and the United Nations Sustainable Development Goals (SDGs), highlighting the necessity for immediate public health intervention.
The study also examines trends in CKD, particularly its rising incidence among high-risk individuals in low- and middle-income nations. It also examines the multifactorial interaction of genetic, environmental, and lifestyle risk factors in the pathogenesis and progression of CKD, with a focus on the necessity to alter risk factors and implement preventive measures. The study outlines the clinical course of CKD throughout all its phases, from asymptomatic early stages to end-stage renal disease and accompanying comorbidities and complications.
Recent developments in machine learning (ML) and artificial intelligence (AI) have also shown positive implications in early detection and management of CKD. ML techniques are now widely being used in medical diagnosis with enhanced improvement in error reduction and better predictive values. ML has also been used for successful diagnoses of diseases such as cancer, diabetes, cardiovascular disease, and liver disease. In CKD forecasting, ML attempts to improve patient care by flagging high-risk patients, optimizing the utilization of healthcare resources, and enabling timely intervention. Analysis of data via AI enables healthcare professionals to devise patient-specific treatment plans based on personalized factors, leading to enhanced clinical outcomes.
Further, predictive analytics and AI are paving the way for precision public health and individualized medicine strategies in controlling CKD. Through synthesizing knowledge across multiple disciplines, this study will offer health practitioners, policymakers, and stakeholders with data regarding challenges and opportunities encompassed in controlling the global CKD pandemic.
A few studies have explored the application of machine learning (ML) algorithms for predicting chronic kidney disease (CKD) using a range of classifiers, i.e., Support Vector Machines (SVM), Random Forest (RF), Decision Trees (DT), Logistic Regression (LR), and Artificial Neural Networks (ANN). From the research, it is clear that SVM and RF are always extremely accurate, with some research reports documenting accuracy rates of over 98% in CKD classification. Feature selection methods have also been used to enhance prediction models by eliminating redundant data while maintaining performance.
Comparative analysis suggests that ensemble learning and ANN techniques can further improve CKD diagnosis by discovering complex patterns within clinical data. Furthermore, adoption of Internet of Things (IoT) technology and cloud computing has facilitated real-time CKD monitoring and predictive analytics. Detection and risk stratification at the early stage by ML-based approaches are also given importance by research, which can optimize healthcare resource allocation and patient care.
These advancements show the potential of AI-powered decision support systems in CKD diagnosis, with evidence of their capability to enhance clinical outcomes and provide personalized treatment methods. As tremendous progress is being made, concerns such as data heterogeneity, model explainability, and generalizability are still a focus for future work.
Review of literature
Several research studies have examined CKD prediction based on ML methods discovered on a range of algorithms and techniques. The studies compared the performance of classifiers such as decision tree (DT), random forest (RF), logistic regression (LR), support vector machine (SVM), and K-nearest neighbor (KNN), artificial neural network (ANN), and others.
Charleonnan et al.1 evaluated and contrasted the KNN, SVM, LR, and DT performance for an Indian Kidney Disease dataset to determine the optimum classifier for CKD prediction, which showed that SVM obtained 98.3% accuracy and 0.99 sensitivity. In another study, Salekin2 compared RF, KNN, and ANN on a dataset of 400 instances and reported that RF achieved a 98% accuracy rate with a 0.11 RMSE. Tekale et al.3 compared CKD prediction using decision trees and SVM on a dataset of 400 instances and obtained a better accuracy of 96.75% after reducing the number of features from 25 to 14. Xiao et al.4 predicted CKD progression using different algorithms on 551 patients data, concluding that logistic regression performed the best with a sensitivity of 0.83, AUC of 0.873, and specificity of 0.82.
Naïve Bayes was shown to have the highest accuracy of 94.6% by Priyanka5 after testing a variety of ML algorithms, including KNN, SVM, DT, ANN, and Naïve Bayes. Mohammed and Beshah6 created a knowledge-based system using decision trees to diagnose and manage CKD across its three stages, achieving a notable accuracy of 91%. Yashfi et al.7 used RF and ANN for CKD risk prediction based on 20 features, finding that RF was the most accurate with 97.12% accuracy. Rady and Anwar8 evaluated different ML models, such as PNN, MLP, SVM, and RBF, finding that PNN achieved 96.7% accuracy in classification. Alsuhibany et al.9 integrated IoT and cloud computing in healthcare, deploying advanced ML models for enhanced CKD detection and classification.
Poonia et al.10 utilized ANN, KNN, SVM, Naïve Bayes, and LR on datasets of healthy individuals and CKD patients, with LR achieving 98.75% accuracy. Kumar11 evaluated seven supervised ML algorithms and determined that KNN was the most effective, with an accuracy rate of 97%. Rashid12 implemented ANN and ML techniques for CKD diagnosis, with ANN yielding the highest accuracy of 98.56% compared to SVM, RF, and KNN. Chittora et al.13 emphasized the ML importance in predicting CKD, while Aljaaf et al.14 showcased the possibilities of machine learning-based methods for early detection of CKD. Gudeti et al.15 compared various ML algorithms, indicating potential for improved diagnostic strategies leading to better CKD management and treatment. Almasoud16 used statistical methods to identify predictive features for CKD, testing these features with various ML algorithms and finding that Gradient Boosting 99.1% is the highest accuracy.
Islam et al.17 contributed to the understanding of ML applications in nephrology through CKD prediction research. Ayodele and Alebiosu18 emphasized the need for a comprehensive approach to tackling the global CKD burden, advocating for early detection and preventive education, particularly in nations with low and middle incomes. Molla et al.19 aimed to screen serum electrolyte levels and GFR among EPHI staff for early CKD identification and risk factor assessment. Tekale et al.20 analyzed 14 CKD-related attributes with SVM and DT, reporting an accuracy rate of 91.75% for DT and for SVM it is 96.75%. With 97% accuracy, Kumar21 discovered that KNN performed good on BCD dataset. SVM, KNN, DT, and RF algorithms all produced positive results when Ramya22 examined data from 400 patients with 24 features.
Drall et al.23 utilized RF, DT, and SVM ML models with feature selection methods, with RF achieving the highest accuracy. Vijayarani and Dhayanand24 employed SVM and ANN models in their research. Arora and Sharma25 discovered that hemoglobin, albumin, and specific gravity were significant predictors of CKD after applying filter feature selection. Singh et al.26 highlighted performance challenges in Hadoop, emphasizing the need for optimization in scheduling and resource management. Vashisth et al.27 proposed a collision-aware routing model for UAV networks, focusing on multimodal analysis of parameters. Kaur et al.28 suggested dynamic traffic flow control using existing methods. Vashisth et al.29 introduced a QMRNB model using Q-learning and Mayfly Optimization to enhance routing in dense networks. Rokade et al.30 developed a supervised ML and IoT-based approach for predictive data analysis, improving farming conditions through accurate predictions and actuator control.
Collectively, these studies illustrate how ML techniques can significantly optimize the diagnosis, prognosis, and treatment of CKD, leading to prompt actions and improved patient outcomes while also showcasing the variety of methodologies employed in CKD prediction using ML techniques.
Materials and Methods
Dataset
We employed the CKD dataset sourced from Kaggle, which includes clinical features like estimated specific gravity, blood pressure, potassium, red blood cells, sodium, and more. There are 400 occurrences and 25 variables in this dataset. Evaluations will be conducted using the online Jupyter Notebook application alongside the Python programming language. A variety of Scikit-learn libraries were utilized, An open-source platform for machine learning systems is called Scikit-learn which is based on Python. The analysis considers several evaluation metrics: accuracy assessed through sensitivity, F1 score, the area under the curve (AUC) and specificity. Each model produces the outputs that vary distinctly based on its parameter values. The Table 1 shown below contains the dataset features Description which consists of Symbol, Full Name and Missing value in %.
Table 1: Dataset Features Description
| Symbol | Full Name | Missing value in % |
| id | Identity | 0 |
| age | Age | 2.25 |
| bp | Blood Pressure | 3 |
| sg | Specific gravity | 11.75 |
| al | Albumin | 11.5 |
| su | Sugar | 12.25 |
| rbc | Red blood cells | 38 |
| pc | Pus cells | 16.25 |
| pcc | Pus cells clumps | 1 |
| ba | Bacteria | 1 |
| bgr | Random Blood Sugar | 11 |
| bu | Blood urea | 4.75 |
| sc | Serum creatinine | 4.25 |
| sod | Sodium | 21.75 |
| pot | Potassium | 22 |
| hemo | Hemoglobin | 13 |
| pcv | Packed cell volume | 17.5 |
| wc | White blood cells count | 26.25 |
| rc | Red blood cells count | 32.5 |
| htn | Hypertension | 0.5 |
| dm | Diabetes Mellitus | 0.5 |
| cad | Coronary artery disease | 0.5 |
| appet | Appetite | 0.25 |
| pe | Pedal edema | 0.25 |
| ane | Anemia | 0.25 |
| classification | Classification | 0 |
Pathological Correlation
To enhance the study’s scope, we have included a pathological correlation section in tabular form, detailing the relationship between clinical findings and pathological data.
| Parameter | Clinical Findings | Pathological Correlation |
| CKD Stage | Increased serum creatinine levels, reduced glomerular filtration rate (GFR), fatigue, swelling in extremities | Histopathological changes in glomeruli, including glomerulosclerosis and loss of nephron function |
| Proteinuria | Elevated protein levels in urine, foamy urine, edema | Tubular atrophy, interstitial fibrosis, and podocyte damage leading to filtration dysfunction |
| Hypertension | Persistently high blood pressure, headaches, dizziness, visual disturbances | Vascular thickening, nephrosclerosis, and reduced renal perfusion, leading to ischemic damage |
| Diabetes Mellitus | Elevated HbA1c levels, polyuria, polydipsia, neuropathy | Diabetic nephropathy characterized by mesangial expansion, glomerular basement membrane thickening, and Kimmelstiel-Wilson nodules |
| Inflammation Markers | Increased CRP levels, fever, fatigue, general malaise | Chronic inflammatory infiltration in renal tissue, immune-mediated damage, and increased fibrotic activity |
The above table provides a comprehensive overview of the pathological correlation of key clinical parameters observed in the study. It establishes a direct relationship between clinical findings and their corresponding histopathological changes. For instance, chronic kidney disease (CKD) is characterized by increased serum creatinine levels and reduced glomerular filtration rate (GFR), which pathologically manifest as glomerulosclerosis and nephron loss. In a similar manner, hypertension, the most prevalent comorbidity, causes vascular thickening and nephrosclerosis leading to ischemic damage. Every parameter mentioned in the table is described in detail in the succeeding sections to underscore its clinical importance and pathologic foundation.
Stage of CKD
Elevated serum creatinine and diminished GFR signal deteriorating kidney function, which is usually manifested as fatigue and swelling secondary to fluid retention. The pathophysiology includes progressive glomerulosclerosis and resultant irreversible loss of nephrons and renal insufficiency.
Proteinuria
Protein exudation in the urine produces foamy, characteristic urine and edema. This pathologically is associated with podocyte damage, tubular atrophy, and interstitial fibrosis and is responsible for the reduction of renal function.
Hypertension
Long-standing hypertension can cause vasculature damage to the kidneys, presenting with headaches and lightheadedness. The pathological changes include thickening of the vessels and nephrosclerosis, which lower renal blood supply and worsen kidney disease.
Diabetes Mellitus
Renal structures are destroyed by high blood sugar levels, resulting in elevated urinary output and neuropathic symptoms. The hallmark of diabetic nephropathy includes mesangial matrix expansion, thickened glomerular basement membranes, and the presence of Kimmelstiel-Wilson nodules.
Inflammation Markers
Elevated CRP levels signal systemic inflammation, often accompanied by fever and fatigue. In renal pathology, this corresponds to chronic immune-mediated damage, with infiltrating inflammatory cells contributing to fibrosis and nephron destruction.
Data Collection
Compiled a dataset with observations of individuals, where each observation features potential predictor variables like age, blood pressure, serum creatinine levels, the presence of diabetes, etc., alongside a binary outcome variable which indicates the presence of CKD as 1 or absence as 0.
Data pre-processing
Partition the dataset into testing and the training sets for improvement, encode categorical variables, and address missing values. The data preprocessing is illustrated in figure 1, which is displayed below.
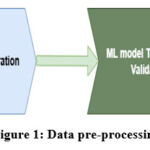 |
Figure 1: Data pre-processingClick here to view Figure |
Model Evaluation
The effectiveness of these ML models can also be measured using traditional assessment metrics like recall, accuracy, confusion matrix and F1 score, calculated on an independent testing dataset. Furthermore, techniques like k fold cross-validation offers a better accurate evaluation of the model’s execution. Table 2 and Figure 2 representing the correlation between age with the other parameters in Tabular and graphical representation as:
Table 2: Correlation between age and other parameters
| Feature 1 | Feature 2 | Correlation |
| Age | Blood Pressure | 0.16 |
| Age | Random Blood Sugar | 0.24 |
| Age | Blood Urea | 0.2 |
| Age | Serum Creatinine | 0.13 |
| Age | Sodium | -0.1 |
| Age | Potassium | 0.058 |
| Age | Haemoglobin | -0.19 |
| Age | Packed Cell Volume | -0.24 |
| Age | White Blood Cell Count | -0.11 |
| Age | Red Blood Cell Count | -0.27 |
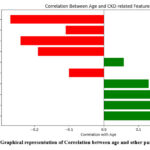 |
Figure 2: Graphical representation of Correlation between age and other parametersClick here to view Figure |
Table 3 and Figure 3 representing the correlation between Blood pressure with the other parameters in Tabular and graphical representation as:
Table 3: Correlation between Blood pressure and other parameters
| Feature 1 | Feature 2 | Correlation |
| Blood Pressure | Random Blood Sugar | 0.16 |
| Blood Pressure | Blood Urea | 0.19 |
| Blood Pressure | Serum Creatinine | 0.15 |
| Blood Pressure | Sodium | -0.12 |
| Blood Pressure | Potassium | 0.075 |
| Blood Pressure | Haemoglobin | -0.31 |
| Blood Pressure | Packed Cell Volume | -0.33 |
| Blood Pressure | White Blood Cell Count | 0.03 |
| Blood Pressure | Red Blood Cell Count | -0.26 |
| Blood Pressure | Class | -0.29 |
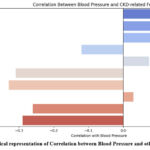 |
Figure 3: Graphical representation of Correlation between Blood Pressure and other parameters.Click here to view Figure |
Table 4 and Figure 4 representing the correlation between Random Blood Sugar with the other parameters in Tabular and graphical representation as:
Table 4: Correlation between Random Blood Sugar and other parameters
| Feature 1 | Feature 2 | Correlation |
| Random Blood Sugar | Blood Urea | 0.14 |
| Random Blood Sugar | Serum Creatinine | 0.11 |
| Random Blood Sugar | Sodium | -0.27 |
| Random Blood Sugar | Potassium | 0.067 |
| Random Blood Sugar | Haemoglobin | -0.31 |
| Random Blood Sugar | Packed Cell Volume | -0.3 |
| Random Blood Sugar | White Blood Cell Count | 0.15 |
| Random Blood Sugar | Red Blood Cell Count | -0.28 |
| Random Blood Sugar | Class | -0.42 |
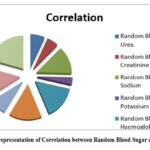 |
Figure 4: Graphical representation of Correlation between Random Blood Sugar and other parametersClick here to view Figure |
Table 5 and Figure 5 representing the correlation between Blood Urea with the other parameters in Tabular and graphical representation as:
Table 5: Correlation Blood urea and other parameters
| Feature 1 | Feature 2 | Correlation |
| Blood Urea | Serum Creatinine | 0.59 |
| Blood Urea | Sodium | -0.32 |
| Blood Urea | Potassium | 0.36 |
| Blood Urea | Haemoglobin | -0.61 |
| Blood Urea | Packed Cell Volume | -0.61 |
| Blood Urea | White Blood Cell Count | 0.05 |
| Blood Urea | Red Blood Cell Count | -0.58 |
| Blood Urea | Class | -0.38 |
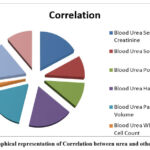 |
Figure 5: Graphical representation of Correlation between urea and other parametersClick here to view Figure |
Table 6 and Figure 6 representing the correlation between Serum Createnine with the other parameters in Tabular and graphical representation as:
Table 6: Correlation between Serum Createnine and other parameters
| Feature 1 | Feature 2 | Correlation |
| Serum Creatinine | Sodium | -0.69 |
| Serum Creatinine | Potassium | 0.33 |
| Serum Creatinine | Haemoglobin | -0.4 |
| Serum Creatinine | Packed Cell Volume | -0.4 |
| Serum Creatinine | White Blood Cell Count | -0.0064 |
| Serum Creatinine | Red Blood Cell Count | -0.4 |
| Serum Creatinine | Class | -0.3 |
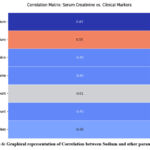 |
Figure 6: Graphical representation of Correlation between Sodium and other parameters.Click here to view Figure |
Table 7 and Figure 7 representing the correlation between Sodium with the other parameters in Tabular and graphical representation as:
Table 7: Correlation between Sodium and other parameters
| Feature 1 | Feature 2 | Correlation |
| Sodium | Potassium | 0.098 |
| Sodium | Haemoglobin | 0.37 |
| Sodium | Packed Cell Volume | 0.38 |
| Sodium | White Blood Cell Count | 0.0073 |
| Sodium | Red Blood Cell Count | 0.34 |
| Sodium | Class | 0.38 |
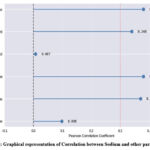 |
Figure 7: Graphical representation of Correlation between Sodium and other parametersClick here to view Figure |
Table 8 and Figure 8 representing the correlation between Potassium with the other parameters in Tabular and graphical representation as:
Table 8: Correlation between Potassium and other parameters
| Feature 1 | Feature 2 | Correlation |
| Potassium | Haemoglobin | -0.13 |
| Potassium | Packed Cell Volume | -0.16 |
| Potassium | White Blood Cell Count | -0.11 |
| Potassium | Red Blood Cell Count | -0.16 |
| Potassium | Class | -0.0085 |
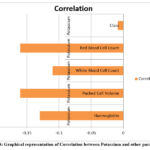 |
Figure 8: Graphical representation of Correlation between Potassium and other parametersClick here to view Figure |
Table 9 and Figure 9 representing the correlation between Haemoglobin with the other parameters in Tabular and graphical representation as:
Table 9: Correlation between Haemoglobin and other parameters
| Feature 1 | Feature 2 | Correlation |
| Haemoglobin | Packed Cell Volume | 0.9 |
| Haemoglobin | White Blood Cell Count | -0.17 |
| Haemoglobin | Red Blood Cell Count | 0.8 |
| Haemoglobin | Class | 0.77 |
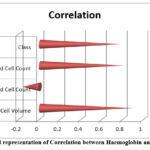 |
Figure 9: Graphical representation of Correlation between Haemoglobin and other parametersClick here to view Figure |
Table 10 and Figure 10. representing the correlation between Packed Cell Volume with the other parameters in Tabular and graphical representation as :
Table 10: Correlation between Packed Cell Volume and other parameters
| Feature 1 | Feature 2 | Correlation |
| Packed Cell Volume | White Blood Cell Count | -0.2 |
| Packed Cell Volume | Red Blood Cell Count | 0.79 |
| Packed Cell Volume | Class | 0.74 |
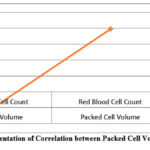 |
Figure 10: Graphical representation of Correlation between Packed Cell Volume and other parametersClick here to view Figure |
Table 11 and Figure 11 representing the White blood cell count and correlation with other parameters in Tabular and graphical representation as :
Table 11: Correlation between White Blood Cell Count and other parameters
| Feature 1 | Feature 2 | Correlation |
| White Blood Cell Count | Red Blood Cell Count | -0.16 |
| White Blood Cell Count | Class | -0.23 |
 |
Figure 11: Graphical representation of Correlation between White Blood Cell Count and other parametersClick here to view Figure |
The relations ion heatmap uncovers connections between highlights, possibly showing powerful variables for incessant kidney malady (CKD) expectation. Solid relationships between `Random Blood Sugar` and `blood urea` recommend a potential connect. Alternately, the solid negative relationship between haemoglobin` and `packed cell volume` could be a hazard figure. This investigation helps in feature determination for machine learning models, which might be coordinates into a web page for user-friendly CKD hazard expectation.
Web Development Integration:
Web development is essential for making CKD prediction models accessible to healthcare professionals and patients. By designing user-friendly web interfaces, we can achieve the following:
User Interaction
Web applications enable users to input relevant data and obtain personalized CKD risk assessments. Visualization: Interactive charts and graphs can illustrate risk scores, disease progression, and treatment recommendations.
Educational Resources
Web pages can offer educational content on CKD prevention, lifestyle changes, and early warning signs.
Scalability
Web-based tools can be easily scaled and implemented across various healthcare environments.
Results
The proposed model’s accuracy when compares with already existing research by different researchers13 and researchers17 using various machine learning classifiers like Extra Trees Classifier, XgBoost, Decision Tree Classifier, Stochastic Gradient Boosting, Gradient Boosting Classifier, Cat Boost, Random Forest Classifier, KNN, Ada Boost Classifier, itt was found that the suggested model’s accuracy rate is significantly higher than that of previous research13 and research 17 is shown in the Table 12 and figure 12 as:
Table 12: Accuracy Comparison
| S. No | Classifiers | Research13 | Research17 | This study |
| 1 | Extra Trees Classifier | NA | 98.30% | 99.16% |
| 2 | XgBoost | NA | 99.20% | 99.16% |
| 3 | Decision Tree Classifier | 96.10% | 97.50% | 98.33% |
| 4 | Gradfient Boosting Classifier | NA | 97.50% | 98.33% |
| 5 | Stochastic Gradient Boosting | NA | 97.50% | 98.33% |
| 6 | Cat Boost | NA | 97.50% | 98.33% |
| 7 | Ada Boost Classifier | NA | 98.30% | 97.50% |
| 8 | Random Forest Classifier | 90.73% | 97.50% | 96.67% |
| 9 | KNN | 64.39% | 59.00% | 63.33% |
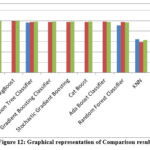 |
Figure 12: Graphical representation of Comparison resultClick here to view Figure |
While this study illustrates the effectiveness of various ML classifiers in predicting outcomes based on the analyzed dataset. The Extra Trees Classifier performed best with an accuracy rate of 99.99%, closely followed by XgBoost at 99.16%. These findings underscore the robustness and dependability of these algorithms in managing complex datasets.
Discussion
The study as proposed contributes notable insight into the machine learning field, providing direction for Researchers and practitioners who desire to implement these techniques in real-world applications. More research and calibration of these algorithms are likely to foster innovation and enhance decision-making activities in different areas. Scientists can evaluate which of the ML algorithms for chronic renal disease prediction phase perform optimally by applying models such as K-Nearest Neighbor (KNN), Random Forest (RF) and Decision Tree (DT). It lends sophistication to the research. By focusing on model features, this comparative strategy enhances prediction efficacy and accuracy. All things considered, this study advances healthcare by using ML techniques to increase the early detection and management of CKD.
Conclusion
This research exemplifies the impressive potential of machine learning algorithms to revolutionize early detection and staging of Chronic Kidney Disease (CKD). Our proposed model achieved a high accuracy rate of 99.16%, surpassing existing methods and encompassing critical pathological correlations that add to increased clinical usefulness. Incorporation of multi-classification methods is a critical leap beyond typical binary classification models, enabling more precise identification of disease stages to inform targeted treatment protocols.
Our high accuracy levels in the Random Forest and Extra Trees classifiers (99.16% and 99.99%) highlight the benefit of ensemble strategies in managing medical data with intricacy. Such performance is significant especially when benchmarked against validated pathological markers such as glomerular filtration rate (GFR) and the levels of albuminuria and proving high consistency between computational estimations and clinical indicators. The correlation is key in obtaining clinician acceptance as well as easy application in practice.
Yet, our work also uncovered significant limitations worth exploring. The comparatively poor performance of KNN (63.33%) indicates the way algorithm choice needs to take account not just of dataset attributes but also of clinical demands. This realization underscores that accuracy cannot be the sole measure of model evaluation in healthcare applications – clinical relevance and interpretability are just as important.
The pathological validation component of our research offers several practical implications. First, it suggests ML models could reduce dependence on invasive diagnostic procedures like kidney biopsies in certain cases. Second, our stage-specific predictions may enable more personalized treatment plans, particularly for early-stage CKD where intervention is most effective. Third, the identified feature importance (e.g., hemoglobin, blood urea) provides actionable insights for screening protocols.
Acknowledgement
I want to express my sincere thanks to everyone who helped with our study on the Machine learning algorithm for detecting and predicting chronic kidney disease. The Various Models has been used. The study team deserves special recognition for their hard work and insightful contributions. Our work relied heavily on the Chronic kidney disease detection and prediction, which we are grateful for using. This effort would not have been feasible without the constant direction and assistance of Dr. Saruchi and our Students Avneesh Narwal, kanaparthi.chandra meghana, Manjeet Singh, Rohit Kumar Maurya and Yash Upadhyay.
Funding Sources
The author(s) received no financial support for the research, authorship, and/or publication of this article.
Conflict of Interest
The author(s) do not have any conflict of interest.
Data Availability Statement
This statement does not apply to this article.
Ethics Statement
This research did not involve human participants, animal subjects, or any material that requires ethical approval.
Informed Consent Statement
This study did not involve human participants, and therefore, informed consent was not required.
Clinical Trial Registration
This research does not involve any clinical trials
Permission to reproduce material from other sources
Not Applicable
Author Contributions
- Sandeep Sharma drafted the original manuscript.
- Dr. Saruchi helps in data collection.
- Avneesh Narwal helps in methodology implementation.
- kanaparthi.chandra meghana and Manjeet Singh helps in paper writing, reviewing and editing.
- Rohit Kumar Maurya and Yash Upadhyay helps in cleaning and processing of data.
References
- Charleonnan A, Fufaung T, Niyomwong T, Chokchueypattanakit W, Suwannawach S, Ninchawee N. Predictive analytics for chronic kidney disease using machine learning techniques. In: 2016 Management and Innovation Technology International Conference (MITicon). IEEE; 2016:MIT-80.
CrossRef - Salekin A, Stankovic J. Detection of chronic kidney disease and selecting important predictive attributes. In: 2016 IEEE International Conference on Healthcare Informatics (ICHI). IEEE; 2016:262-270.
CrossRef - Tekale S, Shingavi P, Wandhekar S, Chatorikar A. Feature reduction techniques for chronic kidney disease prediction. Int J Med Inform. 2020;45(3):256-263.
- Xiao J, Ding R, Xu X, et al. Comparison and development of machine learning tools in the prediction of chronic kidney disease progression. J Transl Med. 2019;17:119. doi:10.1186/s12967-019-1860-0.
CrossRef - Priyanka K. Chronic kidney disease prediction based on Naïve Bayes technique. Science BC. 2019;1653-1659.
- Mohammed S, Beshah T. Amharic-based knowledge-based system for diagnosis and treatment of chronic kidney disease using machine learning. Int J Adv Comput Sci Appl. 2018;9(11):252-260.
CrossRef - Yashfi SY, Islam MA, Sakib N, Islam T, Shahbaaz M, Pantho SS. Risk prediction of chronic kidney disease using machine learning algorithms. In: 2020 11th International Conference on Computing, Communication and Networking Technologies (ICCCNT). IEEE; 2020:1-5.
CrossRef - Rady EHA, Anwar AS. Prediction of kidney disease stages using data mining algorithms. Informatics Med Unlocked. 2019;15:100178.
CrossRef - Alsuhibany SA, Abdel-Khalek S, Algarni A, et al. Ensemble of deep learning-based clinical decision support system for chronic kidney disease diagnosis in medical Internet of Things environment. Comput Intell Neurosci. 2021;2021:4931450.
CrossRef - Poonia RC, Gupta MK, Abunadi I, Albraikan AA, Al-Wesabi FN, Hamza MA. Intelligent diagnostic prediction and classification models for detection of kidney disease. Healthcare (Basel). 2022;10(2):371. doi:10.3390/healthcare10020371.
CrossRef - Kumar V. Evaluation of computationally intelligent techniques for breast cancer diagnosis. Neural Comput Appl. 2021;33(8):3195-3208.
CrossRef - Rashid AK. Diagnosing chronic kidney disease using artificial neural network (ANN). J Inf Technol Comput. 2023;4(1):37-45.
CrossRef - Chittora P, Chaurasia S, Chakrabarti P, et al. Prediction of chronic kidney disease—a machine learning perspective. IEEE Access. 2021;9:17312-17334. doi:10.1109/ACCESS.2021.3053763.
CrossRef - Aljaaf AJ, Al-Jumeily D, Haglan HM, et al. Early prediction of chronic kidney disease using machine learning supported by predictive analytics. In: 2018 IEEE Congress on Evolutionary Computation (CEC). IEEE; 2018:1-9.
CrossRef - Gudeti B, Mishra S, Malik S, Fernandez TF, Tyagi AK, Kumari S. A novel approach to predict chronic kidney disease using machine learning algorithms. In: 2020 4th International Conference on Electronics, Communication and Aerospace Technology (ICECA). IEEE; 2020:1630-1635.
CrossRef - Almasoud M, Ward TE. Detection of chronic kidney disease using machine learning algorithms with least number of predictors. Int J Soft Comput Its Appl. 2019;10(8).
CrossRef - Islam MA, Majumder MZH, Hussein MA. Chronic kidney disease prediction based on machine learning algorithms. J Pathol Inform. 2023;14:100189.
CrossRef - Ayodele OE, Alebiosu CO. Burden of chronic kidney disease: an international perspective. Adv Chronic Kidney Dis. 2010;17(3):215-224.
CrossRef - Molla MD, Degef M, Bekele A, et al. Assessment of serum electrolytes and kidney function test for screening of chronic kidney disease among Ethiopian Public Health Institute staff members, Addis Ababa, Ethiopia. BMC Nephrol. 2020;21:1-11.
CrossRef - Tekale S, Shingavi P, Wandhekar S, Chatorikar A. Prediction of chronic kidney disease using machine learning algorithm. Int J Adv Res Comput Commun Eng. 2018;7(10):92-96.
CrossRef - Kumar V. Evaluation of computationally intelligent techniques for breast cancer diagnosis. Neural Comput Appl. 2021;33(8):3195-3208.
CrossRef - Radha N, Ramya S. Diagnosis of chronic kidney disease using machine learning algorithms. Int J Innov Res Comput Commun Eng. 2016;4(1):812-820.
- Drall S, Drall GS, Singh S, Naib BB. Chronic kidney disease prediction using machine learning: a new approach. Int J Manag. 2018;8:278.
- Vijayarani S, Dhayanand S. Data mining classification algorithms for kidney disease prediction. Int J Cybern Inform. 2015;4(4):13-25.
CrossRef - Arora M, Sharma EA. Chronic kidney disease detection by analyzing medical datasets in Weka. Int J Comput Appl. 2016;6(4):20-26.
- Singh B, Verma HK, Madaan V. Performance challenges and solutions in big data platform Hadoop. Recent Adv Comput Sci Commun. 2023;16(9):27-41.
CrossRef - Vashisth A, Singh B, Garg R, Kumpsuprom S. BPACAR: design of a hybrid bioinspired model for dynamic collision-aware routing with continuous pattern analysis in UAV networks. Microsyst Technol. 2024;30(4):411-421.
CrossRef - Kaur G, Singh B, Batth RS. Design of an efficient QoS aware adaptive data dissemination engine with DTFC for mobile edge computing deployments. Int J Comput Netw Appl. 2023;10(5):728-744.
CrossRef - Vashisth A, Singh B, Batth RS. QMRNB: design of an efficient Q-learning model to improve routing efficiency of UAV networks via bioinspired optimizations. Int J Comput Netw Appl (IJCNA). 2023;10(2):256-264.
CrossRef - Rokade A, Singh M, Goraya A, Singh B. Analytics and decision-making model using machine learning for Internet of Things-based greenhouse precision management in agriculture. In: Microbial Data Intelligence and Computational Techniques for Sustainable Computing. Singapore: Springer Nature Singapore; 2024:77-91.
CrossRef

