
Manuscript accepted on :12-03-2025
Published online on: 28-04-2025
Plagiarism Check: Yes
Reviewed by: Dr. Rajendran Susai
Second Review by: Dr. Pravinkumar Darji
Final Approval by: Dr. Anton R Keslav
Kiran Puttegowda1* , Mahendra Govindegowda2, Poornima Mayigegowda3, Paramesha Ramegowda3and Anusha Maralagala Nagaraju4
1Department of ECE, Vidyavardhaka College of Engineering, Mysuru, Karnataka, India
2Department of Computer Science and Engineering, Government Engineering College, Hassan, Karnataka, India
3Department of Electronics and communication, Govt Polytechnic, Mirle, Karnataka, India
4Department of ECE, BGS Institute of Technology, Adichunchanagiri University, BG Nagara, Mandya, Karnataka, India
Corresponding Author E-mail ID: kiranhsn@vvce.ac.in
DOI : https://dx.doi.org/10.13005/bpj/3171
Abstract
Early diagnosis is essential for the prognosis of brain tumors. Conventional methods of brain tumor classification involve biopsy through invasive brain surgery. Here we worked on the analysis of 3000 Magnetic Resonance Imaging (MRI) brain images consisting of glioma, meningioma, pituitary tumors and healthy brains to develop non-invasive strategies for the detection of tumors using a machine learning approach. This work included data augmentation to achieve equal numbers of tumor and non-tumor samples 1500 each. Seven methods were used for the classification purpose: Logistic Regression, SVC, KNN, Naïve Bayes, Neural Network, Random Forest, and cluster analysis through K-means. Basic evaluating parameters were used as the performance indicators including accuracy, precision, recall, F1-score, and AUC to determine the efficiency of each model. Out of the four algorithms tested Logistic Regression and Random Forest made the highest test accuracy of 96% they were closely followed by Neural Networks at 95% for tumor versus non-tumor classification. Based on these results, the use of non-invasive MRI-based machine learning as an accurate diagnostic method for tumor detection is highly emphasized, but it requires the enhancement of their diagnostic model to accomplish its high-level goal.
Keywords
Accuracy; Brain tumor; Feature Extraction; MRI Images; Machine learning models
Download this article as:| Copy the following to cite this article: Puttegowda K, Govindegowda M, Mayigegowda P, Ramegowda P, Nagaraju A. M. Automated Brain Tumor Detection with Advanced Machine Learning Techniques. Biomed Pharmacol J 2025;18(2). |
| Copy the following to cite this URL: Puttegowda K, Govindegowda M, Mayigegowda P, Ramegowda P, Nagaraju A. M. Automated Brain Tumor Detection with Advanced Machine Learning Techniques. Biomed Pharmacol J 2025;18(2). Available from: https://bit.ly/3ECIorq |
Introduction
Tumors are abnormal growths that can be either malignant or benign. There are over 200 different types of tumors that can affect humans. Brain tumors, specifically, are a serious condition where irregular growth in brain tissue impairs brain function. The number of deaths caused by brain tumors has increased by 300% in the last three decades. If left untreated, brain tumors can be fatal. Diagnosing and treating brain tumors is challenging due to their complexity. Early detection and treatment are crucial for improving survival rates. Brain tumor biopsy requires surgery, so there is a need for non-invasive diagnostic methods.1 Magnetic Resonance Imaging (MRI) is commonly used for diagnosing brain tumors. They can cause a range of symptoms, such as:
Headaches,
Seizures,
Vision problems,
Muscle twitching and shaking in the body,
Drowsiness, nausea, and vomiting.
Many studies that have been conducted over the past years have investigated various methods used to increase the chances of identifying brain tumors with high precision. To give a brief overview of some past works in this literature review, we briefly look at the studies and their contribution to the detection of brain tumors. There are three problems associated with brain tumor detection: First, the intensity of inhomogeneities and indistinct boundaries are the main characteristics of tumor images.2 To overcome this challenge, researchers have applied intensity normalization or bias field correction to manage the effect of magnetic field inhomogeneity. Also, the application of intensities, neighborhood information, and texture has been extensively applied in various research. In the work proposed here, we have seen the use of machine learning techniques in brain tumor detection. As such, different classification techniques, including logistic regression, support vector machines (SVM), k-nearest neighbor (KNN), decision trees, random forests, and artificial neural networks have been applied. These algorithms use features extracted from brain images to differentiate between malignant and benign tissues.
The main contributions of this work on brain tumor classification using MRI images include:
Development of a Non-Invasive Diagnostic Method
This study plans to use MRI images and machine learning methods to detect the presence of brain tumours and so reduce the need for biopsy methods, making diagnosis safer.
Data Augmentation for Balanced Dataset
Data augmentation was employed herein to obtain 1,500 tumor and 1,500 non-tumor samples to enhance the model’s training and make the classification outcome more reliable.
Extensive Evaluation of Machine Learning Models
Among the seven models that were developed using the machine learning approach; include Logistic Regression, SVC, KNN, Naïve Bayes, Neural Network, Random Forest, and K-means clustering. The comprehensive diagnostic strategy allowed establishing which methods provided the highest accuracy in tumor diagnosis.
High Accuracy in Tumor Classification
In terms of accuracy Logistic Regression and Random Forest used in this study recorded the highest level at 96% followed by Neural Networks with 95%. These results corroborate the utility of specific machine learning algorithms in exercising satisfactory predictive powers on tumor and non-tumor image classification.
Focus on Key Performance Metrics
These assessments were arrived at using accuracy, precision, recall, F1-score, and AUC to benchmark all the models in the study for a holistic comparison.
Implications for Future Diagnostic Model Enhancements
Hence, proposed work recommends continued efforts to refine such diagnostic models to improve the diagnostic prediction accuracy, which will be beneficial for the development of MRI-based machine learning methods to serve as utilitarian diagnostic markers for early tumour detection.
Recent advancements in machine learning, particularly deep learning, have enabled the identification and classification of medical imaging patterns. Machine learning techniques have shown success in various medical applications, including disease prognosis, diagnosis, image classification, and tissue segmentation. Due to the variation in pathology and potential limitations of human specialists, computer-assisted interventions and computational intelligence techniques can assist in tumor identification and classification. This research focuses on machine learning for the immediate, non-invasive identification of brain tumors, which confirms the practical applicability of this approach to diagnostics. Machine learning, especially deep learning, plays a vital role in analysing, segmenting, and classifying cancer images, particularly brain tumors. These methods enable accurate and reliable tumor identification, distinguishing them from other diseases. In this study, we propose models that consider previous suggestions and limitations. We compare seven modelling methods to determine any significant differences in performance.
The structure of article is as follows: the Section “Related work” is brief description of the prior research. Section “Material and methods”: Presents the idea of the presented research and describes the distribution of data collected, model training, and its assessment. Section “Experimental results and discussion”: Discusses the obtained outcomes of the experiment and how they have been quantitatively and qualitatively assessed, using results from simulation. Section “Conclusion and future work”: Summarizes the findings have been presented at the end of the article and discusses the possibilities of further research.
Related Works
Ponuku Sarah developed a method for brain tumor classification incorporates segmentation via K-means, feature extraction from SGLDM and classification through ResNet50, with knowledge distilled by augmenting the model with synthetic data’s.3 In the study described by Amreen Batool, the authors report the current state of the art of the applications of advanced machine learning methods for brain tumor segmentation and classification and the strengths and weaknesses of these methods. It also highlights the necessity of the effective combination of these approaches while working with various types of MRI to improve the results of the automated brain tumor detection and to increase the effectiveness of treatment. 4 Sandeep Kumar Mathivanan discussed the study that utilizes deep learning and transfer learning approach, using architectures such as MobileNetv3 and obtain a vast accuracy up to 99.75% for brain tumor detection from MRI images, hinting at the future direction of increased utilization of machine learning in medicine.5 In the recent work, Yuxia Yang used the enhanced hybrid dwarf mongoose optimization (EHDMO) with the gated recurrent unit (GRU) networks for the detection of brain tumor on magnetic resonance imaging (MRI) attaining high sensitivity of 0.98 and specificity and accuracy both 0.97 and 0.95, respectively.6 The study which combines Proper Orthogonal Decomposition with Convolutional Neural Networks for brain tumor detection was proposed by Rita E Appiah proposed study resulted in 95.88% accuracy with the advantage of saving more computational time. It describes how the low-order models help improve the machine learning techniques for accurate tumor detection from MRI.7 There is a study by Mahmoud Khaled Abd-Ellah for the work ‘Automatic Brain-Tumor Diagnosis System using Cascaded Deep Convolutional Neural Networks’ describes the realisation of an accurate deep-learning based application for detecting glioblastomas from MRI scans with a 99% classification accuracy and for segmenting the tumours as well. For an efficient diagnosis of brain tumor in medical image analysis.8 Jing Zhu put forward an efficient detection method of deep learning with an Amended Grasshopper Optimization Algorithm and achieved an excellent accuracy of 0.96 and noise tolerance capacity.9 G.S. Shyo Prakash Jakhar proposed the multi-scale fractal feature learning algorithm, a state-of-art fractal residual deep learning based on multi-scale pixel segmentation techniques improves the accuracy of brain tumor detection to 94. 66%, sensitivity to 94.42%, and specificity to 92.81%.10 Md Manowarul Islam also proposed an efficient deep learning model based on EfficientNet to classify the brain tumor and has elaborated up to 99.69% accuracy. It raises state-of-the-art preprocessing and augmentation approaches that greatly improve diagnostic accuracy and efficiency in real environments.11 E Chukwujindu described how AI specifically through techniques such as ML and DL assists in increased brain tumor detection through increased lesion recognition, differential diagnoses, and anatomic segmentation to subsequently help assist in more accurate diagnosis and the development of optimized individual treatment plans for the patients.12
Adrian Godlewski proposed a novel interdisciplinary method for brain tumor diagnosis using metabolomics and EvoHDTree, with significant predictive coefficients, that was validated using leave one out cross-validation and achieved an F1‐score in all comparisons of 0.476–0.948 and the area under the ROC curves between 0.660 and 0.873.13 Ishak Pacal presents a novel field of deep learning and utilizes the Swin Transformer based Hybrid Shifted Windows Multi-Head Self Attention Residual based Multi-Layer Perceptron which can achieve brain tumor detection with respect to MRI images with an accuracy of 99.92%.14 Ankit Kumar combines Discrete Wavelet Transform and Principal Component Analysis and then uses Support Vector Machine to classify with high performance metrics such as 86.9% recall and 95.2% precision for detecting and segmenting brain tumors.15 Also, B. Abdusalomov uses a hyper parameterized YOLOv7 model supported with data augmentation, image enhancement, and attention mechanisms for brain tumor detection from MRI scans with 99.5% precision of gliomas, meningiomas, and pituitary tumors.16 U-Net’s superior accuracy at segmentation compared to other deep learning algorithms for brain metastasis detection was explained by Ting-Wei Wang. It also documents a lesion wise dice score of 79% and sensitivities of 86% and 87% highlighting the promise of advanced machine learning in diagnostics.17 Arpit Kumar Sharma propose a brain tumor detection based on a modified ResNet50 model using transfer learning and deep learning. Incorporating the latest machine learning methodologies, this approach improves diagnostic accuracy and efficiency for brain tumor classification.18 Baiju Babu Vimala mention that study employed transfer learning with Efficient Nets to classify brain tumors into glioma, meningioma, or pituitary tumors with a test accuracy of 99.06%. It shows how deep learning can improve brain tumor detection in MRI.19 Soha Rawas combines deep learning and the natural language processing offered by ChatGPT and can achieve a Dice coefficient score of 0.93 for brain tumor detection in MRI scans, exceeding current state of the art methods.20 M Ramachandran proposed a mutual informative MapReduce and minimum quadrangle classification framework to facilitate effective brain tumor detection with SVM. It has 21% greater accuracy and employs only 37% less computational complexity and 27% less of the detection time than existing models.21 Dapeng Cheng present the EAV-UNet, an advanced machine learning tool for brain tumor detection using VGG 19 for feature extraction, attention mechanisms and edge enhancement to enhance segmentation accuracy, especially for low contrast and blurry lesion edges.22
K. Lakshmi presents XAISS-BMLBT as a new explainable artificial intelligence method which unites semantic segmentation with Bayesian machine learning to find brain tumors. The brain tumor classification system starts by using bilateral filtering to reduce MRI noise as its first step. The system uses MEDU-Net+ segmentation process for region detection and then performs feature extraction with ResNet50 model.23
Mingrong Zuo develops a weakly supervised deep learning system which merges ResNet-50 architecture with attention mechanism components. The model received performance assessment from ten-fold cross-validation through AUC measurements alongside heatmap displays that explained its prediction functions. The testing revealed substantial area under the curve (AUC) values which successfully separated different astrocytomas, oligodendrogliomas, and gliomas grades found in the TCGA dataset.24
Wentao Hu designs a sequential machine learning framework to generate the glioma stemness-related score named GScore. The predictive abilities of GScore were verified through computational evaluations and patient studies which established CYP3A5 as a viable target. In vitro and in vivo tests using functional genetic assays confirmed how CYP3A5 affects glioma stem cell self-renewal as well as chemoresistance.25
Anahita Fathi Kazerooni performs a radio genomic analysis which combines MRI and RNA sequencing data to study paediatric low-grade gliomas (pLGGs). The research separates pLGG patients into three distinct immunological classes and discovers that the cluster with elevated immune activity also indicates poor disease progression suitability for immunotherapy. The radiomic signature demonstrates effectiveness of more than 80% in predicting immune signatures.26
Onyedika J. Ilonze investigates how race and ethnicity affect heart failure with preserved ejection fraction (HFpEF) regarding its clinical burdens as well as risk elements and treatment strategies and patient results. Implementation science-based approaches offer a framework to reduce discriminatory health care practices and create fair healthcare quality services.27
Ning Qiao establishes a radiomics-based nomogram which forecasts the BRAFV600E mutation status before surgery in craniopharyngiomas. The analysis included 398 patients in two groups where 278 patients served for model development (training cohort) and the remaining 120 patients served for model evaluation (validation cohort). The research employed support vector machine (SVM) technology to establish a radiomic model together with multivariable logistic regression modelling to build a clinical-radiomics nomogram.28
Ilknur Tuncer presents FlexiCombFE as a flexible brain tumor detection framework based on multiple static patch partition approaches. The framework employs three feature extractors—Local Phase Quantization, Local Binary Pattern, and Pyramidal Histogram of Oriented Gradients—yielding seven primary feature vectors. The system creates 28 feature vectors through four patch division types and implements three feature selection approaches including Chi-squared and ReliefF and Neighborhood Component Analysis. The classification procedure performs its analysis with K-nearest neighbors and support vector machines which create 168 classifier-specific outcomes.29
Yibo Hu develops MBAGAN which applies an ACP (attention and convolution-based perceptual) module within its structure. This module develops a parallel multi-branch structure instead of serial convolution-attention approaches to maximize feature alignment capabilities. The model uses multiple feature scale encoding to enhance both retention and learning of multidimensional representations.30
Shilpa Mahajan developed a system which evaluates MRI brain scans for abnormalities. The method follows brain/non-brain classification at its first stage while performing multi-class classification to detect specific tumors such as pituitary adenomas, gliomas, and meningiomas during its subsequent stage. The model trainings took place using 7,753 images from Qhills Technologies Pvt. Ltd. with extra data from the Brain Tumor MRI collection to reach wider generalization possibilities.31
Shaodong Ding has developed C3R as a novel algorithm for unsupervised domain adaptation (UDA) which segments medical images. C3R has four main parts including a shared encoder that learns domain-invariant features together with both a segmented for producing segmentation results and two decoders that perform image translation between source and target domains. The algorithm enables performance enhancement through consistency regularization at three stages including image level and feature level and segmentation output level.32
Materials and Methods
Classification algorithms that have been widely applied in the prediction of brain tumors are Logistic Regression, Support Vector Machines (SVM), K Nearest Neighbor (KNN), Decision Tree, Random Forest, Artificial Neural Networks (ANN) because they are suitable for the classification of medical images and other parameters. Below is an explanation of each model’s characteristics:
Logistic Regression
Logistic Regression is a model of linear classification which allows to define the probability that input belongs to definite class. Well, logistic regression expects binary or categorical output data in contrast to linear regression that expects continuous values; Secondly and most importantly, while linear regression predicts a continuous value, logistic regression passes the weighted sum of inputs through a logistic (sigmoid) function to produce a probability value between 0 and 1. This probability tells us how likely it is that the input belongs to a given class and the input is classified by the model into the class with the highest shown probability. Logistic regression is very useful in binary classification problems where the outcome is in most cases discrete (0/1 or True/False, Pass/Fail etc). It is easy to apply, fast and the results are straightforward to understand that is why the model is chosen for problems where it is presupposed that the input variables and the output are related by a linear function. But, it is not effective for the cases where the decision boundaries are complicated and may non-linear in nature.
Support Vector Classifier (SVC)
SVC is a robust classifier frequently used for data classification, which tries to identify an ideal hyperplane that can easily distinguish between several classified elements. The basic concept of SVC is to design that will have the largest margin, that is the largest distance between the hyperplane and the data points closest to the hyperplane of each class, called the support vectors. The margin is then defined as the difference between the optimal prediction of the model and its prediction to maximize this margin, SVC’s hope is to enhance the ability of the model to generalize and minimize the chances of over-fitting. SVC works in higher dimensions, and it can solve non-linear problems as well by adopting transformation functions (linear, polynomial or radial basis functions kernel transformations) that transform data to higher dimensions where it becomes manageable to make a linear separation. This flexibility enables SVC to perform the task of classifying data whose decision boundary it rather complex. However, SVC can often be slow in to learn, much more specifically in terms of larger data sets and needs a careful approach to parameters such as the choice of the kernel or the regularize for avoiding problems such as overfitting or underfitting.
K-Nearest Neighbors (kNN)
k-Nearest Neighbors (kNN) is a technique of instance-based learning for pattern classification, which usually does not involve the collection of specific information about a phenomenon, hence the ‘non-parametric’ term. One of the main points that distinguish kNN from many other kinds of models is that it does not actually create a model with parameters that can be stated. They categorize an input by finding the ‘k’ closest data points and most of the class labels among them gets assigned to the input. Thus, the studies that heavily rely on the number of neighbours, denoted by the value ‘k’, have high noise immunity but smoothed decision areas. The distance metric, commonly the Euclidean distance is adopted and used in measuring the distance between two data points. Here, kNN has a strong advantage that it is relatively simple and works well where the location of decision surface is difficult and may be nonlinear. Nonetheless, kNN can be computationally expensive when the dataset increases, due to the distances that need to compute from all the training instances in the prediction phase. Further, it may suffer in high-dimensional environments because of the curse of dimensionality when distance computations are less reasonable due to many features.
Naive Bayes
Naive Bayes is among the classification algorithms that employ chance and query the chance of the noticed factors and input and recognize the course with the most elevated chance, influenced by Bayes’ probability. Naive Bayes’ main assumption is that all the features are independent of each other when given the class variable. This simplification makes the model easier to compute because it reduces the notion of joint probability of the features to a kind of product of probabilities of individual features. Naive Bayes also assumes that all features are independent – a assumption which is purely fictional, yet Logistical Regression has been efficient in a number of classification problems especially when the features to be considered are high a large number, for instance in text classification and spam filtering. It is computationally efficient and can be implemented with small and large shapes easily. But when the features are correlated, it is not accurate because dependent data give a wrong independence assumption such that its performance is weakened. In that sense, Naive Bayes is still one of the strongest tackles in the field because of its simplicity, fast method processing, and applicable utilization in any kinds of problems.
Neural Networks
Neural Networks also called Artificial Neural Networks (ANNs) refer to mathematical models structured based on the neurons in the brain. They are composed of a series of connecting layers or nodes otherwise known as neurons, and each layer has its own function in analysing the input data. Neural networks and their structure have an input layer, one or multiple concealed layers, and an output layer. In a layer, a neuron is connected to a neuron in the next layer through weights, and the next value of that neuron, seu output, is the activation function of the sum of its weight inputs. While training the network the weight associated with this connection between layers is learned through a process known as backpropagation. This involves coming up with an error between the network’s output and the actual output then passing this error back through the network to optimize the weights where the best techniques used are the Back Propagation algorithms. Neural networks are very adaptive as they can make highly non-linear transformations and are suitable for tasks such as image recognition, natural language processing etc. But usually, they rely on big sets of labelled data and need much computational power for learning. However, due to their capability to employ complex patterns and estimate the likelihood, it is a compulsory tool in current machine learning, especially in the deep-learned systems.
Random Forest
Random forest is a practitioner’s algorithm used when developing multiple decision trees and making the consensus of their estimations to achieve higher accuracy and less variance than in other Learning algorithms. The concept of Random Forest assumes that many weak decision trees can improve efficacy notably if their results are combined; each of them is built using a bootstrapping, which involves random sampling of the data set with replacement. Furthermore, the algorithm comes up with another source of monte carlo style randomness at each split in the decision trees that the model generates where only a random subset of features is considered for partitioning, which minimizes the correlation of trees in the bag and at the same time increases the variance of the ensemble. In the case of classification problems, decision is reached through voting where the combination of the decision trees selects the most common class. In case of regression, the prediction is taken as an average of all the trees. This approach assists Random Forest to improve its performance than a single decision tree because problems like overfitting and variance are dealt with in this case. In addition, Random Forest can solve classification and regression tasks, work with many variables and is not sensitive to data noise.
However, Random Forest is incredible and robust; it is computationally costly primarily when many trees or features exist. Its models are also less interpretable than individual decision trees Moreover, it is more difficult to explain an ensemble model than to explain a single decision tree. However, because of the above-said disadvantages, Random Forest is popular due to its stability, versatility, and accurate performance in different learning problems.
K-means clustering
K-means clustering is a type of unsupervised machine learning method that divides *k* number of clusters in a database based on similarity of objects. The method described is an iterative one in which each data element is assigned to the nearest centroid, after which the centroid of each cluster is calculated as the mean centroid for all the data in that cluster. This process continues until it reaches the following conditions, that is, the centroids do not change or the allocation of data points to the clusters becomes fixed. While K-means is more of clustering algorithms and can be used for classification, it is better used for feature engineering or pilot analysis. For instance, in K-means clustering methods can be used to find some features which may not be readily seen or used to segment the data in a way that can act as the basis for a classification algorithm. At times, some of the clusters generated may serve as the input for some other algorithm which involves supervised learning or the clustering results that belong to different clusters may be a form of pseudo-classes in a hybrid model.
K-means is highly appropriate in the situation where the clusters are spherical in a feature space with similar number of elements. However, it has drawbacks for it depends on the choice of *k* (the number of clusters) and initial position of centroids. Secondly, all features are equally valid for classification and the variance of each cluster is supposed to be similar, which is not always true in the given datasets. However, K-means is used when there is no prior information on the classification of the data having to cluster them naturally, for instance in customer profiling, outlier detection, and feature extraction.
Proposed Work
Figure 1 shows the architecture of the Brain Tumor Prediction System through the machine learning algorithm to identify brain tumors. The architecture starts from the acquisition of MRI brain images; however, the images obtained are pre-processed to reduce noise. Image data is rescaled and normalized, and data augmentation is employed to ensure that the data for the tumor and non-tumor images are well-balanced. This dataset is then split between two datasets, namely the training data set and the testing dataset. The pre-processed images are then passed to a feature extraction module, which is very important if one is to consider identifying features that distinguish various brain conditions such as glioma, meningioma, pituitary tumor, and healthy brain tissue. A convolutional neural network (CNN) is then used, which is organized in a serial manner, putting convolutional layers next to pooling layers with the purpose of producing efficient feature extraction. The extracted features mostly go through a process of classification using a range of machine learning models including Logistic Regression, Support Vector Classifier, k-Nearest Neighbours, Naïve Bayes Classifier, Neural Network, Random Forest among others. Performance of each model is measured in terms of accuracy, precision, recall value, F1-score, and Area Under curve (AUC) after the model is trained. The predictor that achieved the highest accuracy in the model is then used as the final predictor for the system. This predictive system provides output in terms of, based on the input MRI scan, whether it is likely that the patient has a brain tumor or not; therefore, it could be a non-invasive and efficient way for early and accurate diagnosis by clinicians.
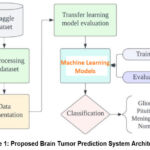 |
Figure 1: Proposed Brain Tumor Prediction System ArchitectureClick here to view Figure |
Data Sets
Such benchmark datasets as MICCAI BraTS (Multimodal Brain Tumor Image Segmentation have provided the basis for the development of the required algorithms of detection of brain tumors.33 They offer well-controlled reference image data for investigators to fine-tune, check the performance of their algorithms, as well as compare CV results. The one mentioned above is inclusive of different types of tumors and their stages, which is perfect for creating general models. Thus, standardized data allows the researcher to evaluate the efficiency of the models under development and determine needs for improvement. Therefore, with the help of databases such as BraTS and others, the knowledge of new machine learning methods aimed at increasing the efficiency of early tumor detection, accurate segmentation, and the reliability of predictions is constantly increasing.
In this work, the dataset of 3000 MRI brain images was used including the glioma, meningioma, pituitary gland tumor, and normal images. The images are split evenly between tumor and non-tumor with an equal split of 1500 images for each as shown in figure 2. This is important to avoid prejudice toward either category or should help make the model accurate. This balance enables the machine learning algorithms to learn from the equal instances of both conditions to pan, diagnose and thus enhance the diagnostic results for real world scenarios.
|
Figure 1: Proposed Brain Tumor Prediction System ArchitectureClick here to view Figure |
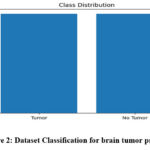 |
Figure 2: Dataset Classification for brain tumor predictionClick here to view Figure |
Data preparation and Augmentation
First, preprocessing and augmentation algorithms were applied to MRI brain images. As a first step, preprocessing and augmentation techniques are used on MRI brain images to make the data irrespective of the variations in scales, rotation, and other criterions which can affect the performance on further use in machine learning.
Image augmentation is also crucial in that, in addition to creating more training data and addressing issues of overfitting which can reduce the model’s ability to generalize. The augmentation process in this study includes two primary categories:
Geometric Transformations
These consist of transformations namely the random flipping, cropping, rotating, stretching, and zooming over the images. These transformations can simulate possible changes in the actual imaging thus enabling the model to learn from MRI data, more generalized features. However, when applying multiple transformation simultaneously there is a risk, that some important features may be either washed out, or may have their significant details concealed, thus decreasing the performance of the model.
Color Space Transformations
This category entails modifying one or more of the three RGB colour channels as well as the contrast and brightness of the images. These changes hint at precise value which increases the model’s resistance towards changing MRI scans due to equipment or lighting conditions and improves the ability to discern features of interest under those conditions.
In combination, these augmentation techniques expand the size of the dataset, as well as enhance the variability of the training images with consequent improved classification performances on the detection of brain tumors in MRI scans. Secondly, the automatic generation of augmented images proved to increase the model’s ability to do so by reducing the issue of overfitting and making the model able to perform well in a variety of inputs. This augmentation technique has been acclaimed for its effectiveness in improving the amount of work that deep learning models deliver, to give higher accuracy and to study and report on the factors promoting reliability and resilience in real-life uses. Figures 3 shows the original and processed image of Brain MRI.
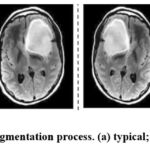 |
Figure 3: Results of Augmentation process (a) typical; (b) augmented images.Click here to view Figure |
Classification
In classification stage, in order to make precise predictions about the results seven methods were used. Among them were Logistic Regression, Support Vector Classifier (SVC), K-Nearest Neighbors (KNN), Naïve Bayes, Neural Networks, and Random Forest which brought in different features for the predictive modelling. Further, K-means analysis was also conducted to get clusters to have a better view on the patterns that exist within data. These methods were used in the conception of brain tumor detection including prediction on glioma, pituitary tumor, meningioma as well as normal brain condition. Using variations of classification and clustering approaches, the training and testing sought to empower accurate and dependable predictions for better diagnosis of more brain tumour subtypes.
Results and Discussion
The transfer learning models described in this paper suggest the use of the confusion matrix to estimate the models’ performance, using such measures as precision, recall, F1 score, and accuracy. The confusion matrix that is usually displayed in a form of a matrix with an equal number of rows and columns provides an array of useful information. An extensive performance appraisal of the model was undertaken, and the various performance metrics were presented based on this appraisal.
Logistic Regression
Table 1: Performance evaluation for Logistic Regression method
| precision | recall | f1-score | support | |
| 0 | 0.95 | 0.97 | 0.96 | 306 |
| 1 | 0.96 | 0.94 | 0.95 | 288 |
| accuracy | 0.96 | 594 | ||
| macro avg | 0.96 | 0.96 | 0.96 | 594 |
| weighted avg | 0.96 | 0.96 | 0.96 | 594 |
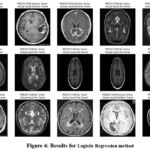 |
Figure 4: Results for Logistic Regression methodClick here to view Figure |
The performance of the Logistic Regression model is shown in the Table 1 such that it clearly exhibits the efficiency of the model for the brain tumor detection task. By applying the proposed model, it means that at 96% efficiency can accurately distinguish between tumor and non-tumor the cases in the given dataset. This not only indicates that the coefficients estimated under the Logistic regression model have rather significant coefficients, thus making the model rather accurate, but also that the model studies’ ability to correctly classify samples in the two classes is rather high. The reminder that the precision score is 0.96 enhances the already great realization that when the model predicts a brain tumor, it is right nearly all the time. Accuracy determines the rate of actual positive classification (correct detections of tumours) from all the positive classifications made by the model. When the model predicts a tumour then the likelihood is that the model is 96% correct, which is important in mostly medical related cases where false positives may lead to unnecessary diagnostics or treatment. The recall score of 0.97 just shows the proposed model can well classify the real brain tumor images. Sensitivity or the ability to recall refers to the ratio of actual tumor cases that the model has flagged correctly out of all actual tumor cases. The recall value of 0.97 also means that the model has the ability of identifying 97% of actual brain tumor cases and rarely compromising on the true negative rate which would potentially lead to an increase in false negatives, whereas many of the tumor cases as possible should be detected for further analysis or treatment.
This is a good approach because it gets a very high F1 score of 0.96, which means that it the model has the same recall and precision scores. Such a metric is the F1-score which is the harmonic mean of the precision and recall coefficients and offers a balance between the ability to correctly diagnose malignant tumor cases (seen through precision coefficient) and capture all possible cases of malignant tumors (seen through the recall coefficient). Thus, an F1-score of 0.96 demonstrates that proposed model is functioning equally to identify two aspects and thus, it could be used as a classifier model for brain tumor detection. Last of all, the AUC value of 0.96 shows that the proposed model is good in terms of the area under the curve. The AUC stands for the probability that the model will place a given positive example on higher rank than any randomly chosen negative one. An AUC of 0.96 reveals that the proposed solution – the Logistic Regression model – has a high potential to furnish distinguishable likelihood estimates of the imagery samples as brain tumor or non-tumor which is useful in avoiding possible false-positive or false-negative predictions that could potentially be fatal in clinical practice. All these performance measures indicate that the Logistic Regression model is quite accurate for the diagnosis of the brain tumor. Figure 4 demonstrate the prediction results of brain tumor for the given dataset using logical regression model and figure 5 shows the ROC and confusion matrix for linear regression model.
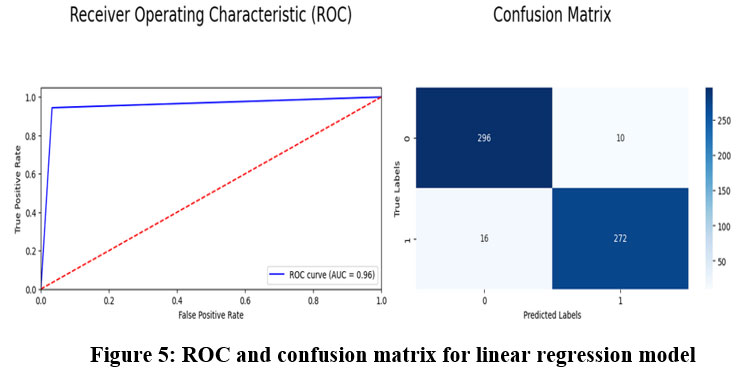 |
Figure 5: ROC and confusion matrix for linear regression model.Click here to view Figure |
Support Vector Classifier (SVC)
Table 2: Performance evaluation for Support Vector Classifier
| precision | recall | f1-score | support | |
| 0 | 0.94 | 0.94 | 0.94 | 306 |
| 1 | 0.94 | 0.94 | 0.94 | 288 |
| accuracy | 0.94 | 594 | ||
| macro avg | 0.94 | 0.94 | 0.94 | 594 |
| weighted avg | 0.94 | 0.94 | 0.94 | 594 |
Table 2 shows impressive results in the brain tumor detection as classified by Support Vector Classifier, with 94% accuracy. This results in achieving about 0.94 the accuracy rate indicative of the number of right predictions in cases that involved brain tumors. The recall calculated to be 0.94 shows the ability of the model indicating actual brain tumor images. SVC achieves a competitive and balanced F1-score of 0.94 which indicates that both precision and recall were considered. Furthermore, the AUC of 0.94 denotes good discrimination power of the developed model to categorize between tumor and non-tumor image. Figure 6 demonstrate the prediction results of brain tumor for the given dataset using Support Vector Classifier model and figure 7 shows the ROC and confusion matrix for Support Vector Classifier model.
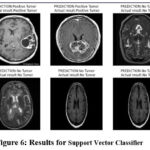 |
Figure 6: Results for Support Vector Classifier Click here to view Figure |
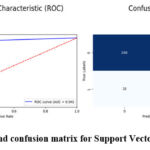 |
Figure 7: ROC and confusion matrix for Support Vector Classifier model Click here to view Figure |
k-Nearest Neighbors (kNN)
Table 3: Performance evaluation for k-Nearest Neighbors
| precision | recall | f1-score | support | |
| 0 | 0.85 | 0.97 | 0.91 | 306 |
| 1 | 0.97 | 0.81 | 0.88 | 288 |
| accuracy | 0.90 | 594 | ||
| macro avg | 0.91 | 0.89 | 0.89 | 594 |
| weighted avg | 0.90 | 0.90 | 0.89 | 594 |
The k-Nearest Neighbors (kNN) algorithm shows satisfactory performance in the brain tumor detection task, achieving an accuracy of 90%. It has a precision of 0.85, indicating a fairly high proportion of correct predictions for brain tumor cases. The recall score of 0.97 emphasizes the model’s strong ability to correctly identify actual brain tumor images. With an F1-score of 0.91, kNN maintains a relatively balanced combination of precision and recall. However, the model exhibits a higher number of false negatives, meaning it mistakenly classifies a notable number of tumor images as non-tumor. The AUC value of 0.89 suggests that kNN has reasonable discriminatory power when distinguishing between tumor and non-tumor images. Figure 8 demonstrate the prediction results of brain tumor for the given dataset using k-Nearest Neighbors model and figure 9 shows the ROC and confusion matrix for k-Nearest Neighbors model.
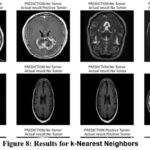 |
Figure 8: Results for k-Nearest Neighbors Click here to view Figure |
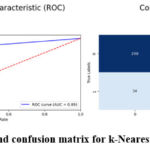 |
Figure 9: ROC and confusion matrix for k-Nearest Neighbors model Click here to view Figure |
Naive Bayes
Table 4: Performance evaluation for Naive Bayes
| precision | recall | f1-score | support | |
| 0 | 0.63 | 0.70 | 0.66 | 306 |
| 1 | 0.64 | 0.57 | 0.60 | 288 |
| accuracy | 0.64 | 594 | ||
| macro avg | 0.64 | 0.63 | 0.63 | 594 |
| weighted avg | 0.64 | 0.64 | 0.63 | 594 |
The experimental result proves that Naive Bayes has reasonable accuracy in brain tumour detection with the accuracy rate of 64% as presented in Table 4. In total, the model achieved an accuracy of 0.63, which means that out of a hundred cases, 63 are of brain tumour. Recall analysis shows that its recall score is 0.70, meaning that the model’s performance will correctly identify 70 per cent of actual cases of brain tumour. Nevertheless, the model is not optimised for accuracy vs recall rates as appears from the F1-score of 0.66. This implies that it has limited capability to extract important aspects and trends within the input images and makes relatively poor predictions. There are also links to false positives and false negatives when trying to distinguish between tumour and non-tumour images using Naive Bayes. It wrongly marks non-tumour images as tumour images and missed identifying certain tumour images. As mentioned earlier, the model has very low discriminative power to T1 contrast MRI scans; therefore, the obtained AUC of 0.63 just demonstrates it. Figure 10 demonstrate the prediction results of brain tumor for the given dataset using Naive Bayes model and figure 11 shows the ROC and confusion matrix for Naive Bayes model.
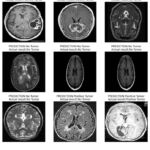 |
Figure 10: Results for Naive Bayes model Click here to view Figure |
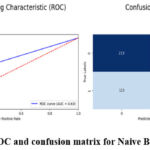 |
Figure 11: ROC and confusion matrix for Naive Bayes model Click here to view Figure |
Neural Networks
Table 5: Performance evaluation for Neural Networks
| precision | recall | f1-score | support | |
| 0 | 0.94 | 0.97 | 0.96 | 306 |
| 1 | 0.97 | 0.94 | 0.95 | 288 |
| accuracy | 0.95 | 594 | ||
| macro avg | 0.96 | 0.95 | 0.95 | 594 |
| weighted avg | 0.95 | 0.95 | 0.95 | 594 |
Tabe 5 the demonstrate high efficiency in diagnosing brain tumours using Neural Networks model which achieves a 95 % accuracy. If a case is a brain tumour, they are classified as one 94% of the time leading to an accuracy level of 0.94. With a recall score of 0.97, this means that this model arrived at an excellent accuracy in identifying actual brain tumour cases. The obtained F1 score 0.96 is a proof of right balance of precision and recall that points to good model performance. Neural Networks are an optimal solution in terms of capturing many of the fine details of the input images and thus the predictive accuracy obtained is high. The significant AUC value of 0.95 quantifies that the proposed model possesses high discriminant capability of demarcating between the tumour and non-tumour images. Figure 12 demonstrate the prediction results of brain tumor for the given dataset using Neural Networks model and figure 13 shows the ROC and confusion matrix for Neural Networks model.
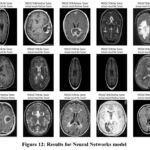 |
Figure 12: Results for Neural Networks model Click here to view Figure |
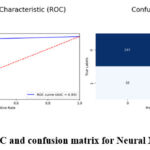 |
Figure 13: ROC and confusion matrix for Neural Networks model Click here to view Figure |
Random Forest
Table 6: Performance evaluation for Random Forest
| precision | recall | f1-score | support | |
| 0 | 0.98 | 0.94 | 0.96 | 306 |
| 1 | 0.97 | 0.98 | 0.96 | 288 |
| accuracy | 0.96 | 594 | ||
| macro avg | 0.96 | 0.96 | 0.96 | 594 |
| weighted avg | 0.96 | 0.96 | 0.96 | 594 |
Table 6 shows the best performance of Random Forest in the detection of brain tumour. The model under analysis demonstrates high correctness of identification of the images of brain tumour, forecasting 956 out of 1000 images correctly. The true positive rate or recall of 0.97 reveal that when the model identifies a presence of a brain tumour it is right 98% of the time and the precision after 0.98 suggests that when a brain tumour is predicted, the model is right in doing so 98% of the time. By achieving the recall score of 0.94, it proves that Random Forest model can identify actual cases of brain tumors. Recalled F1-score of 0.96 means it balances the precision and recall metrics which define a high efficiency of the proposed method comparing with other models. Employing these metrics, we can infer that Random Forest facilitates capturing of intricate features and forms in the input images provided satisfactory predictive abilities. Random forest also gave a false negative as 7 tumour images as no tumour images (the least among all models) The AUC – 0.96 shows that the Random Forest has good discriminating ability between tumour and no tumour images. Figure 14 demonstrate the prediction results of brain tumor for the given dataset using Random Forest model and figure 15 shows the ROC and confusion matrix for Random Forest model.
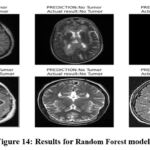 |
Figure 14: Results for Random Forest model Click here to view Figure |
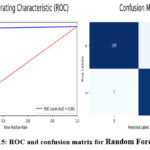 |
Figure 15: ROC and confusion matrix for Random Forest model Click here to view Figure |
K-means clustering
Table 7: Performance evaluation for K-means clustering
| precision | recall | f1-score | support | |
| 0 | 0.64 | 0.76 | 0.69 | 1482 |
| 1 | 0.70 | 0.57 | 0.63 | 1488 |
| accuracy | 0.66 | 2970 | ||
| macro avg | 0.67 | 0.66 | 0.66 | 2970 |
| weighted avg | 0.67 | 0.66 | 0.66 | 2970 |
To evaluate the desirability of External cluster quality, K-means clustering performs reasonably well in the detection of brain tumour a shown in table 7. It orientates the clustering of brain tumour images with a moderate correctness level and the accuracy of 66%. The precision is responsive to a value 0.64, meaning; out of every 100 clustered data, the model precisely diagnosed 64 cases of brain tumour. The recall of the model is 0.76 that means it finds the 76 percent of actual brain tumour cases in the clustered areas. The F1-score being 0.69 considered to be a fair amount of balance between precision and recall. From these metrics, it is evident that although K-means clustering could cluster the images, not all the details within the brain tumour dataset can be captured. It misidentified 641 brain tumour images as no tumour images (false negatives) and this is so high. It can be noted that AUC (Area Under the curve) = 0.66 indicating restricted capability of K-means clustering model in distinguishing between a tumour and no tumour images. figure 13 shows the ROC and confusion matrix for K-means clustering model.
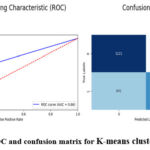 |
Figure 16: ROC and confusion matrix for K-means clustering model Click here to view Figure |
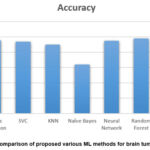 |
Figure 17: Comparison of proposed various ML methods for brain tumor prediction Click here to view Figure |
Figure 17 shows the comparison of different ML models used in the proposed work to predict the brain tumor. After an in-depth evaluation of various machine learning models on a brain tumor detection dataset, the following insights were observed:
Top-Performing Models
Logistic Regression, Neural Networks, and the Random Forest were found to be the most efficient models. All four algorithms achieved high accuracy, precision, recall, and F1-score, which suggests that their performance to distinguish between tumor and non-tumor images of MRI are relatively accurate. As evident from the following table, these models yielded good accuracy with slight variations in their average metrics with Random Forest being the best with accuracy of 96%, precision of 0.98, recall of 0.94 and F1 –score of 0.96.
Alternative Models
SVC and k-Nearest Neighbors (kNN) are also fast approaching the above 90% accuracy level. These models were quite accurate and had good levels of both precision and recall that placed them in the frame of good readymade models for brain tumor detection tasks.
Lower-Performing Models
Naïve Bayes were less accurate, precise, and recall in distinguishing MRI images for brain tumors and a lower mean F1 score as well. Thus, the Naive Bayes algorithm in the analysis of materials with a negative sentiment also provides a lower result in comparison with other algorithms for classifying material relevance: overall accuracy, 64%; precision, 0.63; recall, 0.70; F1-score, 0.66; a higher rate of false positives and false negatives makes Naive Bayes less effective in this case.
Non-Classification Model
It may be noted K-means clustering which has been used here is not directly applicable for classification problems. The present work has lower accuracy, and other performance measures that imply that it is not useful for binary classification in brain tumor detection.
Based on the findings therefore, Random Forest is the best model for this dataset. The former showed a high capability of distinguishing tumor images, thereof, 288 true positives, 18 false positives, and 7 false negatives classified and achieved a high AUC of 0.96. Naive Bayes was the worst performing classifier due to large misclassifications this confirmed its ineffectiveness in this application.
Table 8: Comparison of Classification accuracy for the proposed work and other existing models.
| Methods | Accuracy |
| [17] | 83.33% |
| [19] | 88.98% |
| [22] | 91.24% |
| Proposed Work | 96% |
The performance of the proposed model is compared with other existing models cited in the present study as shown in Table 8, in terms of classification accuracy achieved. Consequently, the model uses elucidated that approximately 83.33% estimation can benchmark the model performance.17 Thus, the improvement with reference to the model obtained that was trained with an accuracy of 88,98%.19 The model has in fact enhanced this accuracy to 91.24% probably because of improvements in the classification algorithms.22 However, the aforesaid models proposed in this study at best performed seemingly superior to the previous models with an accuracy of about 96%. The increase in accuracy from the proposed approach has demonstrated the benefits of this model and superiority over the earlier models developed for this classification problem.
Conclusion
In this study, we look at the use of transfer learning approaches to perform the classification of glioma using MRI images. The research very carefully and objectively compares four forms of transfer learning models, including logistic Regression, SVC, KNN, Naïve Bayes, Neural Network, Random Forest, and K-means clustering on a total of 3000 MRI brain tumor image datasets. The evaluation includes fundamental features that are accuracy, precision, f1-score, and recall. Notably, Random Forest becomes the standout model of all models under analysis, achieving a higher accuracy rate of 98% that outperforms the competition in the study. Furthermore, Logical regression with 96%, SVC with 90%, and k-Nearest Neighbors (kNN) with 90% exhibit best-in-class performance. Thereby asserting the effectiveness of the proposed method in the classification of brain tumors. As a result, it can be crucial to mention that the present paper uses a secondary dataset only. Possible future studies could investigate how the proposed model can be expanded in the future or new applications improve the applicability of CT images. From this extension, it could be realized that the applicability of the model could be expanded thus enhancing the scope the model has in the medical field. Hence, the proposed model, especially Random Forest, SVC, and kNN is promising for enhancing medical image classification. Further research and advances in imaging, especially using different modes present the possibilities of finding other aspects that can greatly improve the area of medical diagnosis. To get a more detailed idea of how well the proposed model can generalize, researchers would have to include other types of additional imaging methods apart from the currently analysed MRI scans, for example, PET, CT, or ultrasound. Future studies will aim to verify how effective these models are by subjecting these models to other data sets and different post clinic environments. Moreover, we are also going to further enhance image enhancement characteristics for types of tumors to achieve greater coverage and balanced models.
Acknowledgment
This work is supported by Vidyvardhaka College of Engineering, Mysuru, Karnataka. The authors are also profoundly grateful to the Department of ECE, Research Centre, Vidyvardhaka College of Engineering, National for providing the resources during the experiment analysis of proposed work.
Funding Sources
The author(s) received no financial support for the research, authorship, and/or publication of this article.
Conflict of Interest
The author(s) do not have any conflict of interest.
Data Availability Statement
This statement does not apply to this article.
Ethics Statement
This research did not involve human participants, animal subjects, or any material that requires ethical approval.
Informed Consent Statement
This study did not involve human participants, and therefore, informed consent was not required.
Clinical Trial Registration
This research does not involve any clinical trials
Permission to reproduce material from other sources
Not Applicable
Authors’ Contribution
- Kiran Puttegowda: Conceptualization, Methodology, Writing – Original Draft.
- Mahendra Govindegowda: Data Collection, Analysis, Writing – Review & Editing.
- Poornima Mayigegowda: Visualization, Supervision.
- Paramesh Ramegowda: Funding Acquisition, Resources.
- Anusha Maralagala Nagaraju: Project Administration, Supervision.
References
- Devranoglu B, Gürbüz T, Yurci A. Male infertility: an overview of etiology, diagnosis, and management. Controversies in Obstetrics & Gynecology and Pediatrics. 2024; 2(2): 34-37.
CrossRef - Sadad T, Rehman A, Munir A, Saba T, Tariq U, Ayesha N, Abbasi R. Brain tumor detection and multi-classification using advanced deep learning techniques. Microsc Res Tech. 2021; 84(6): 1296-1308.
CrossRef - Budati AK, Katta RB. An automated brain tumor detection and classification from MRI images using machine learning techniques with IoT. Environment, Development and Sustainability. 2022; 24(9): 10570-10584.
CrossRef - Sarah P, Krishnapriya S, Saladi S, Karuna Y, Bavirisetti DP. A novel approach to brain tumor detection using K-Means++, SGLDM, ResNet50, and synthetic data augmentation. Front Physiol. 2024; 15: 1342572. doi: 10.3389/fphys.2024.1342572.
CrossRef - Batool A, Byun YC. Brain tumor detection with integrating traditional and computational intelligence approaches across diverse imaging modalities – Challenges and future directions. Comput Biol Med. 2024; 175: 108412. doi: 10.1016/j.compbiomed.2024.108412.
CrossRef - Mathivanan SK, Sonaimuthu S, Murugesan S, et al. Employing deep learning and transfer learning for accurate brain tumor detection. Sci Rep. 2024; 14: 7232. doi: 10.1038/s41598-024-57970-7.
CrossRef - Yang Y, Razmjooy N. Early detection of brain tumors: Harnessing the power of GRU networks and hybrid dwarf mongoose optimization algorithm. Biomed Signal Process Control. 2024; 91: 106093.
CrossRef - Appiah R, Pulletikurthi V, Esquivel-Puentes HA, et al. Brain tumor detection using proper orthogonal decomposition integrated with deep learning networks. Comput Methods Programs Biomed. 2024; 250: 108167.
CrossRef - Abd-Ellah MK, Awad AI, Ashraf AM, Ibraheem AM. Automatic brain-tumor diagnosis using cascaded deep convolutional neural networks with symmetric U-Net and asymmetric residual-blocks. Sci Rep. 2024; 14(1).
CrossRef - Zhu J, Gu C, Wei L, et al. Brain tumor recognition by an optimized deep network utilizing amended grasshopper optimization. Heliyon. 2024; 10(7).
CrossRef - Jakhar SP, Nandal A, Dhaka A, Alhudhaif A, Polat K. Brain tumor detection with multi-scale fractal feature network and fractal residual learning. Appl Soft Comput. 2024; 153: 111284.
CrossRef - Islam MM, Talukder MA, Uddin MA, Akhter A, Khalid M. Brainnet: Precision brain tumor classification with optimized efficientnet architecture. Int J Intell Syst. 2024; 1: 3583612.
CrossRef - Chukwujindu E, Faiz H, Sara AD, Faiz K, De Sequeira A. Role of artificial intelligence in brain tumour imaging. Eur J Radiol. 2024; 111509.
CrossRef - Godlewski A, Czajkowski M, Mojsak P, et al. A comparison of different machine-learning techniques for early detection of brain tumors. Sci Rep. 2023; 13(1): 11044.
CrossRef - Pacal I. A novel Swin transformer approach utilizing residual multi-layer perceptron for diagnosing brain tumors in MRI images. Int J Mach Learn Cybern. 2024; 15(9): 3579-3597.
CrossRef - Kumar A, Pandey SK, Varshney N, et al. Distinctive approach in brain tumor detection and feature extraction using biologically inspired DWT method and SVM. Sci Rep. 2023; 13(1): 22735.
CrossRef - Abdusalomov AB, Mukhiddinov M, Whangbo TK. Brain tumor detection based on deep learning approaches and magnetic resonance imaging. Cancers. 2023; 15(16): 4172.
CrossRef - Wang TW, Hsu MS, Lee WK, et al. Brain metastasis tumor segmentation and detection using deep learning algorithms. Radiother Oncol. 2024; 190: 110007.
CrossRef - Sharma AK, Nandal A, Dhaka A, et al. Brain tumor classification using the modified ResNet50 model based on transfer learning. Biomed Signal Process Control. 2023; 86: 105299.
CrossRef - Vimala BB, Srinivasan S, Mathivanan SK, et al. Detection and classification of brain tumor using hybrid deep learning models. Sci Rep. 2023; 13(1): 23029.
CrossRef - Rawas S, Tafran C, AlSaeed D. ChatGPT-powered deep learning: elevating brain tumor detection in MRI scans. Appl Comput Inform. 2024.
CrossRef - Ramachandran M, Patan R, Kumar A, et al. Mutual informative MapReduce and minimum quadrangle classification for brain tumor big data. IEEE Trans Eng Manag. 2021; 70(8): 2644-2655.
CrossRef - Cheng D, Gao X, Mao Y, et al. Brain tumor feature extraction and edge enhancement algorithm based on U-Net network. Heliyon. 2023; 9(11).
CrossRef - Lakshmi K, Amaran S, Subbulakshmi G, et al. Explainable AI with UNet-based segmentation and Bayesian machine learning for brain tumor classification using MRI images. Sci Rep. 2025; 15: 690. doi: 10.1038/s41598-024-84692-7.
CrossRef - Zuo M, Xing X, Zheng L, et al. Weakly supervised deep learning-based classification for glioma histopathology. Sci Rep. 2025; 15: 265. doi: 10.1038/s41598-024-84238-x.
CrossRef - Hu W, Cui X, Liu H, et al. CYP3A5 promotes glioblastoma stemness and chemoresistance through fine-tuning NAD+/NADH ratio. J Exp Clin Cancer Res. 2025; 44: 3. doi: 10.1186/s13046-024-03254-x.
CrossRef - Kazerooni AF, Kraya A, Rathi KS, et al. MRI and machine learning predict prognosis and treatment response in pediatric glioma. Nat Commun. 2025; 16: 340. doi: 10.1038/s41467-024-55659-z.
CrossRef - Ilonze OJ, Mazimba S. Racial and Ethnic Disparities in Heart Failure with Preserved Ejection Fraction. Curr Cardiovasc Risk Rep. 2025; 19: 5. doi: 10.1007/s12170-024-00755-4.
CrossRef - Qiao N, Li C, Zheng F, et al. Radiomics nomogram for BRAFV600E mutation prediction in craniopharyngioma. Neurosurg Rev. 2025; 48: 8. doi: 10.1007/s10143-024-03170-w.
CrossRef - Tuncer I, Baig AH, Barua PD, et al. FlexiCombFE: Feature engineering framework for brain tumor detection. Biomed Signal Process Control. 2025; 104: 107538.
CrossRef - Hu Y, Zhang S, Li W, et al. Unsupervised medical image synthesis with multi-branch attention. Biomed Signal Process Control. 2025; 104: 107495.
CrossRef - Mahajan S, Dhull A, Dahiya A. Efficient deep learning for brain abnormality detection using MRI. Inteligencia Artificial. 2024; 28(75): 81–100. doi: 10.4114/intartif.vol28iss75pp81-100.
CrossRef - Ding S, Liu Z, Liu P, et al. C3R: Cross-modality medical image segmentation. Expert Syst Appl. 2025; 269: 126304.
CrossRef - Nickparvar M. Brain tumor MRI dataset. 2023. Available from: https://www.kaggle.com/datasets/ masoudnickparvar/brain-tumor-mri-dataset.

