
Manuscript accepted on :23-04-2025
Published online on: 08-05-2025
Plagiarism Check: Yes
Reviewed by: Dr. Amani Shafik and Dr. Nagaraj Perumal
Second Review by: Dr. Pranjal Sachan
Final Approval by: Dr. Patorn Piromchai
Lakshmana Rao Atmakuri1* , Kurnool Mahammed Ismail2, Vijaya Kumar Ghanta3, Bhaskar Vallamkonda4, Ramesh Alluri5 and Satya Venkata Sakuntala Mamidi6
1Department of Pharmaceutical Analysis, V. V. Institute of Pharmaceutical Sciences, Gudlavalleru, Andhra Pradesh, India.
2Department of Pharmaceutical Analysis, Nizam Institute of Pharmacy, Deshmukhi, Telangana, India.
3Department of Pharmacy Practice, KVSR Siddhartha College of Pharmaceutical Sciences, Vijayawada, Andhra Pradesh, India.
4Department of Pharmaceutical Sciences, Vignan’s Foundation for Science, Technology and Research, Vadlamudi, Andhra Pradesh, India.
5Department of Pharmacology, Vishnu Institute of Pharmaceutical Education and Research, Narsapur, Telangana, India.
6Department of Pharmacy, Government Polytechnic for Women, Kakinada, Andhra Pradesh, India.
Corresponding Author E-mail: dralrao@gmail.com
DOI : https://dx.doi.org/10.13005/bpj/3179
Abstract
Current study was intended to establish and validate an advanced, novel, stable, simple and systematic analytical procedure to determine Bisoprolol & Cilnidipine in pure drug & tablet by Reversed-Phase HPLC method. The partition of analytes was attained with a combination of reverse phase C18 column (Waters X Terra 150x4.6mm; 3.5µm) and a mobile phase made up of 60% acetonitrile and 40% 0.1% trifluoroacetic acid is utilized, at a flow rate of 1mL/min over an 8minute, isocratic flow and at 225nm isobestic point. With the best acceptable resolution the peaks of Bisoprolol and Cilnidipine was eluted at 3.129min and 6.925min respectively. The linearities of the analytes especially with this proposed method were 2.52 to 37.80µg/ml & 5.00 to 75.00µg/ml for Bisoprolol and Cilnidipine respectively. For the proposed method, all the validation parameters were tested as indicated by ICH guidelines. The %RSD values for system precision was 0.41% for BISO and 0.14% for CILN, %RSD values for method precision was 0.4% for BISO and 0.3% for CILN and %RSD values for intermediate precision was 0.4% for BISO and 0.3% for CILN respectively. As per the validation report, the results of induced degradation studies, stability, precision, accuracy and the remaining validation parameters, however, were all excellent and within the acceptance criteria. The comparative study results reveal that the established process was economic, fast, suitable, sensitive and stable technique for determination of Bisoprolol & Cilnidipine in pure & tablet formulation.
Keywords
Bisoprolol; Cilnidipine; RP-HPLC; Stability; Validation
Download this article as:| Copy the following to cite this article: Atmakuri L. R, Ismail K. M, Ghanta V. K, Vallamkonda B, Alluri R, Mamidi S. V. S. A Novel Analytical Method for Simultaneous Quantification of Bisoprolol and Cilnidipine by Reversed-Phase HPLC in Pure and Tablet Dosage Form. Biomed Pharmacol J 2025;18(2). |
| Copy the following to cite this URL: Atmakuri L. R, Ismail K. M, Ghanta V. K, Vallamkonda B, Alluri R, Mamidi S. V. S. A Novel Analytical Method for Simultaneous Quantification of Bisoprolol and Cilnidipine by Reversed-Phase HPLC in Pure and Tablet Dosage Form. Biomed Pharmacol J 2025;18(2). Available from: https://bit.ly/3H1ABE8 |
Introduction
Bisoprolol (BISO) is a cardio protective drug, prescribed for managing high blood pressure and heart failure (Figure 1). Bisoprolol reduces cardiac workload by decreasing contractility and the need for oxygen through competitive inhibition of β1-adrenergic receptors.1,2 Cilnidipine (CILN) is a calcium channel blocker, used to treat high blood pressure (Figure 2). Cilnidipine acts by blocking N-type & L-type of calcium channels which in turn dilates arterioles and venules results in reduce in blood pressure in capillary level.3,4 The clinical applications of BISO and CILN are lowers blood pressure, reducing the chances of heart problems such as heart attack and stroke. The combination of BISO and CILN is one of the best choices in the management of hypertension.5
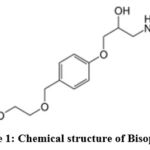 |
Figure 1: Chemical structure of BisoprololClick here to view Figure |
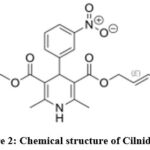 |
Figure 2: Chemical structure of CilnidipineClick here to view Figure |
Extremely a very few analytical methods was established for estimation of BISO and CILN by RP-HPLC either by alone, combination or by in combination with other analytes6-9, which was less satisfactory levels of acceptance. The previous reported methods have lack of specificity and more retention times. The need for simultaneous quantification includes accuracy, cost-effectiveness and short run time. Hence the author aimed for development and validation of a novel and unique analytical method for Bisoprolol & Cilnidipine estimation by RP-HPLC in accordance with ICH guidelines.10-11
Materials and Methods
Chemicals and reagents
The pure analytes BISO and CILN were acquired as gift samples from Glenmark Pharmaceuticals, Mumbai. HPLC grade water, acetonitrile and trifluoro acetic acid are of Merck India made and were purchased for the preparation of mobile phase.
Instrument
The proposed simultaneous analytical estimation was established and validated on auto sampler RP-HPLC (Make: Waters) connected with e2695 model pump, 2998 PDA detector and equipped with Empower 2 software.
Preparation of 0.1% trifluoro acetic acid
The solution was freshly prepared by transferring 1ml of pure trifluoro acetic acid to 1000ml volumetric flask in combination with HPLC grade water and sonicated for 5min.
Preparation of mobile phase
Swirl 600ml of acetonitrile, 400ml of 0.1% trifluoro acetic acid in well closed & labeled 1000ml container.
Preparation of stock solution (standard)
Pure standards 25mg of BISO & 50mg of CILN were mixed and sonicated for 5min with diluent in 100ml volumetric flask before make up.
Preparation of working solution (standard)
Swirl 5ml of the above solution with 30ml of diluent in volumetric flask of capacity 50ml and adjusted to the specified standard using the same diluent, label and stored. Following each preparation step, all solutions were filtered using a 0.45µm filter.
Analytical method development
Selection of detection wavelength
Solution having BISO and CILN was prepared by using diluent and scanned at a region of 200 to 400nm using PDA detector. Both the drugs BISO and CILN have shown an acceptable peak response at 225nm and it was selected as common detection wavelength for both BISO and CILN throughout the analysis.
Streamlined chromatographic conditions
Different trials have been performed to streamline all the vital RP-HPLC parameters as per the literature required for simultaneous determination of BISO & CILN.12-16 Finally RP C18 column, Waters X Terra RP18 (150×4.6 mm, with a 3.5µm particle size), a mobile phase made up of 60% acetonitrile and 40% 0.1% trifluoroacetic acid is utilized, at a flow rate of 1mL/min over an 8 minute were chosen as effective optimized RP-HPLC conditions for the projected estimation. The optimized conditions were tabulated in Table 1.
Table 1: Optimized HPLC conditions of BISO and CILN
| Column | Waters X Terra RP18 (150×4.6mm, 3.5µ) |
| Mobile phase | Acetonitrile: 0.1% trifluoro acetic acid (60:40 v/v) |
| Column temperature | Ambient |
| Flow rate | 1.0ml/min |
| Run time | 10mins |
| Pumping mode | Isocratic flow |
| Injection volume | 10µl |
| Wavelength | 225nm |
| Retention times | Bisoprolol: 3.129min |
| Cilnidipine: 6.925min |
Analytical method validation
System suitability
For assuring system performance throughout the analysis for the projected method, system suitability test was performed. The data obtained after six replicates, it was found that the results of all the system suitability parameters have shown excellent acceptability results.
Selectivity
The developed method was selective, if BISO and CILN are absolutely distinguished from one another with high resolution & fixed retention times at streamlined RP-HPLC conditions. Selectivity of the suggested process was analyzed by six frequent injections of standard solutions (working) containing BISO and CILN.
Specificity
The justification for examine specificity was to establish interfering peaks from impurities or degradants or from excipients of formulation or placebo at same retention times with the analytes of concern. In this method tablet extract, placebo, standard drug solutions & mobile phase (blank injection) were injected to check the specificity of method.
Linearity
A blank solution of diluent and six different standard drug solutions containing 2.52µg/ml to 37.80µg/ml of BISO and 5.0µg/ml to 75.0µg/ml of CILN were equipped with diluent exactly & injected into optimized RP-HPLC process. Using peak responses of respective concentrations calibration plots were constructed. From the calibration plots linearity, range and r2 values were calculated.
Accuracy
To identify accuracy of the planned RP-HPLC system, standard addition technique was adopted. Solutions in 3 concentration levels containing BISO (12.5mg, 25.0mg & 37.8mg) and CILN (25.0mg, 50.0mg & 75.0mg) were prepared and the triplicate injections from each level was injected in to RP-HPLC.
Precision
System precision
It was identified through 6 times continually injecting recently equipped working standard solution containing 25μg/ml of BISO & 50μg/ml of CILN into RP-HPLC system and evaluated for the %RSD of peak areas.
Method precision
To compute the method precision of projected analytical method, sample solution attains with 25μg per milli litre of BISO & 50μg per milli litre of CILN was continuously injected for 6 times into RP-HPLC system & computed for the %RSD of drug estimated.
Intermediate precision (Ruggedness)
Six samples of same batch containing 25μg/ml of BISO and 50μg/ml of CILN were evaluated to prove intermediate precision of the projected analytical process by various analysts on various columns and by various instruments. From resultant chromatograms of analyte and its %RSD was tabulated.
Robustness
To verify the robustness of the anticipated analytical technique, one out of optimized chromatographic parameters was deliberately changed and the assay was performed. During the validation process rate of flow was tuned to ±0.2ml/min and organic component of the mobile phase was adjusted to ±10% & resulting changes occurred in chromatograms after injecting sample solutions in triplicates comprising 25μg/ml of BISO and 50μg/ml of CILN.
LOD and LOQ
The expressions LOD & LOQ are elaborated as detection of smallest amount of analyte and quantification of smallest amount of analyte, by projected analytical method. According to ICH guidelines, signal to noise ratio method is one of the recognized methods to evaluate LOD and LOQ. Triplicates of lowest concentrations of standard solutions (working) & blank solutions of BISO and CILN were analyzed to estimation LOD & LOQ of the method at optimized RP-HPLC conditions.
Assay of BISO and CILN in marketed formulation
From 20 marketed formulations (tablets), average weight of each one tablet was tabulated and grinded to fine powder. Tablet powder equivalent to 25mg and 50mg of BISO and CILN respectively was shifted to 100ml volumetric flask & swirl with 75ml diluent, sonicated for 5min, filled with the same diluent and passed through a 0.45 µm filter paper. A 5 milli litre portion of the stock filtrate was diluted to a total volume of 50 milli litre with the diluent. RP-HPLC chromatographic system was then used to inject replicates and obtain peak areas from chromatograms to determine the amounts of BISO and CILN in each tablet.
Stress degradation studies
A stability stock solution for stress degradation studies was arranged by combining 200mg of formulation powder containing BISO and CILN with 70ml of diluent in a volumetric flask of capacity 100ml. The blend underwent sonication for 15 minutes, diluted to mark using similar diluent, did go through a 0.45µm filter.
Acid induced degradation
5ml of stability stock filtrate, 1ml of 1N HCl and 30ml of diluent were mixed in volumetric flask of capacity 50ml, solution was transferred to water bath at constant temperature of 60°C for 30 minutes. After cooling, 1 mL of 1N NaOH was introduced, and solution was adjusted to final volume with diluent. It was then stored at room temperature and injected after 24 hours.
Alkali induced degradation
5ml of stability stock filtrate, 1ml of 1N NaOH and 30ml of diluent were mixed in volumetric flask of capacity 50ml, solution was transferred to water bath at constant temperature of 60°C for 30 minutes. After cooling, 1 ml of 1N HCl was introduced, and solution was adjusted to final volume with diluent. It was then stored at room temperature and injected after 24 hours.
Peroxide induced degradation
5ml of stability stock filtrate, 1ml of 30% H2O2 & 30ml of diluent were mixed in volumetric flask of capacity 50ml, solution was transferred to water bath at constant temperature of 60°C for 30 minutes. After cooling, solution was diluted to mark with diluent, stored at room temperature, and then injected after 24 hours.
Thermal induced degradation
The sample powder containing BISO and CILN was exposed at 105°C for 72hrs. 200mg of sample was weighed and transferred into 100ml volumetric flask with 70ml of diluent. The mixture was sonicated for 15 minutes, then diluted to mark with same diluent, mixed, and filtered through a 0.45µm filter. Next, 5ml of filtrate was diluted to 50ml with diluent, mixed, stored at room temperature and injected into RP-HPLC system after 24 hours.
Photolytic degradation
The sample powder was directly exposed under UV light for 24hrs. 200mg of this sample was weighed and transferred into 100ml volumetric flask containing 70ml of diluent and sonicated for 15min and diluted to the mark with the same diluent, mixed and was passed through 0.45µ filter. Further 5ml filtrate was diluted to 50ml with diluent, mixed, stored at room temperature and injected into RP-HPLC system after 24hrs. All the degradation samples passed through 0.45µ filter before injected in to RP-HPLC system.
Stability studies
To identify the stability of projected analytical method, test solution consisting of 25µg/ml BISO and 50µg/ml CILN was prepared freshly, passed through 0.45µ filter and the filtrate was injected into RP-HPLC system at different and standard time intervals (0hrs, 6hrs, 12hrs, 18hrs & 24hrs).
Results
Analytical method validation
System suitability
Projected RP- High-Performance Liquid Chromatography method passes the system suitability test for estimation of BISO and CILN, as the resolution (Rs) was >2, total theoretical plate count (N) was >2000, peak tailing factor (Tf) was <2 & the %RSD of peak areas was <2. The results were furnished in Table 2.
Table 2: System suitability results of BISO and CILN
| Analyte | Rt (min.) | %RSD peak areas | USP plate count | USP tailing | Resolution |
| BISO | 3.129 | 0.3 | 4662.67 | 1.05 | – |
| CILN | 6.925 | 0.3 | 12144.8 | 0.95 | 16.99 |
Selectivity
The chromatographic data on inspection it was establish that the retention times & resolution of analytes was fixed with adequate change, confirms selectivity of projected analytical technique. The typical chromatogram of BISO and CILN were shown in Figure 3.
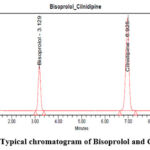 |
Figure 3: Typical chromatogram of Bisoprolol and CilnidipineClick here to view Figure |
Specificity
No interfering peaks or no additional peaks were viewed in the chromatograms except BISO and CILN peaks, with all the injected solutions. Thus it indicates that projected RP-HPLC system was specific to recognize BISO & CILN only.
Linearity
By the new recommended RP-HPLC method BISO has shown linearity 2.52µg/ml to 37.80µg/ml with relevant regression equation y=43555x+2627.63 and CILN has shown linearity 5.00-75.00µg/ml with relevant regression equation y=63276x+34138. The values for r² for BISO and CILN were 0.9995 and 0.9996 respectively. The calibration curves of BISO and CILN were shown in Figure 4 & Figure 5 and the data on linearity has been presented in Table 3.
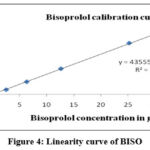 |
Figure 4: Linearity curve of BISOClick here to view Figure |
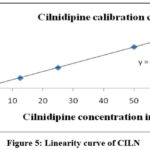 |
Figure 5: Linearity curve of CILNClick here to view Figure |
Table 3: Linearity data of BISO and CILN
| Injection | BISO | CILN | ||
| Concentration (micrograms per milliliter) | Peak area | Concentration (micrograms per milliliter) | Peak area | |
| Blank | 00.00 | 000000 | 00.00 | 000000 |
| Linearity 1 | 02.52 | 104895 | 05.00 | 424515 |
| Linearity 2 | 06.30 | 274526 | 12.50 | 814575 |
| Linearity 3 | 12.60 | 558347 | 25.00 | 1627484 |
| Linearity 4 | 25.20 | 1112478 | 50.00 | 3244563 |
| Linearity 5 | 31.50 | 1392594 | 62.50 | 4045894 |
| Linearity 6 | 37.80 | 1624456 | 75.00 | 4865436 |
Accuracy
Individual recoveries of all the levels of BISO and CILN were within the permitted limit. The mean %recoveries of BISO and CILN are 99.56% and 100.35% respectively and the study confirms the accuracy of the suggested RP-HPLC system. The data related to accuracy are summarized in Table 4.
Table 4: Accuracy results of BISO and CILN
| Levels | BISO | CILN | ||
| Found conc. (mg) | Mean %recovery ±SD | Found conc. (mg) | Mean %recovery ±SD | |
| 50% | 12.29 | 98.5±0.28 | 25.05 | 100.27±0.06 |
| 100% | 25.32 | 101.0±0.49 | 50.32 | 100.48±0.16 |
| 150% | 37.16 | 99.2±0.55 | 75.23 | 100.31±0.02 |
| Mean %recovery | 99.56 | 100.35 | ||
| Mean±SD | 1.18 | 0.13 | ||
| %RSD | 1.2 | 0.1 | ||
Precision
System precision
The %RSD of peak areas from six replicate injections of the working standard solution was 0.41% for BISO and 0.14% for CILN. This demonstrates that the system precision is within acceptable limits.
Method precision
The mean of analyte calculated and its %RSD of 6 replicate injections of sample solutions was identified as 100.03% % & 0.4% for BISO; 100.08% & 0.3% for CILN. Therefore, the projected method was reproducible.
Intermediate precision (Ruggedness)
The mean assay of analytes & their %RSD were calculated as 99.98% & 0.4% for BISO; 100.2% & 0.3% for CILN respectively. Hence, the projected RP-HPLC method was reproducible with different instrument by different analyst and on different column. The precision data was tabulated in Table 5.
Table 5: Precision results of BISO and CILN
| Analyte | System precision | Method precision | Intermediate precision | |
| BISO | Mean±SD | 1128268±3348.61 | 100.03%±0.44 | 99.98%±0.39 |
| %RSD | 0.3% | 0.4% | 0.4% | |
| CILN | Mean±SD | 3224623±9773.93 | 100.08%±0.37 | 100.2%±0.25 |
| %RSD | 0.3% | 0.3% | 0.3% | |
Robustness
From the results it was found that the proposed analytical method was stable even after small but deliberate changes in the flow rate and the composition ratio of the mobile phase. It was pragmatic that there was slight change in system suitability parameters but net assay values of BISO and CILN were within the acceptable limits. The robustness data was reflected in Table 6.
Table 6: Robustness results of BISO and CILN
| Conditions | BISO | CILN | |||||
| Rt (min.) | Plate count | %Drug found | Rt (min.) | Plate count | Rs | %Drug found | |
| 0.8ml/min | 3.95 | 6444 | 99.73 | 8.85 | 9968 | 19.33 | 100.63% |
| 1.2ml/min | 2.65 | 3456 | 100.27 | 5.76 | 10346 | 15.22 | 99.83% |
| 27:73v/v | 3.94 | 6168 | 99.80 | 8.72 | 14256 | 19.04 | 100.67% |
| 33:67v/v | 2.73 | 3656 | 99.20 | 5.05 | 8867 | 11.40 | 100.00% |
LOD and LOQ
The estimated limit of detection (LOD) & limit of quantitation (LOQ) values for BISO were 0.025µg/ml & 0.075µg/ml respectively; for CILN the LOD & LOQ are 0.050µg/ml & 1.50µg/ml respectively. The LOD & LOQ data was tabulated in Table 7.
Table 7: LOD & LOQ results of BISO and CILN
| Analyte | LOD | LOQ |
| BISO | 0.025µg/ml | 0.075µg/ml |
| CILN | 0.050µg/ml | 0.150µg/ml |
Assay of BISO and CILN in tablets
Assay result reveals that each tablet of BESICOR-C contains 5.03mg and 9.92mg of BISO and CILN respectively against its label claim with the projected analytical method. The assay data was furnished in Table 8.
Table 8: Assay results for marketed tablet of BISO and CILN
| Brand name | Drugs | Label claim (mg) | Amount recovered (mg) | Assay |
| BESICOR-C | Bisoprolol | 5.00 | 5.03 | 100.60% |
| Cilnidipine | 10.00 | 9.92 | 99.20% |
Forced degradation studies
1N HCl originated degradation was calculated as 21.50% and 24.00%; 1N NaOH stimulated degradation was 19.20% and 22.10%; while 30% H2O2 stimulated degradation was 15.60% and 17.00% for BISO and CILN respectively. thermal affected degradation at 105°C was 17.40% and 16.70% and Photolytic degradation under UV light was 15.70% and 13.90% for BISO and CILN respectively. The forced degradation study data was given in Table 9.
Table 9: Forced degradation results of BISO and CILN
| Conditions | BISO | CILN | ||||
| % of degradation | Purity angle | Purity threshold | % of degradation | Purity angle | Purity threshold | |
| Control | – | 2.064 | 45.365 | – | 15.214 | 52.647 |
| 1N HCl | 21.50 | 2.041 | 44.256 | 24.00 | 15.212 | 52.546 |
| 1N NaOH | 19.20 | 2.042 | 45.268 | 22.10 | 15.142 | 52.461 |
| 30% H2O2 | 15.60 | 2.037 | 48.252 | 17.00 | 15.152 | 52.314 |
| Thermal | 17.40 | 2.034 | 45.198 | 16.70 | 15.134 | 52.394 |
| Photolytic | 15.70 | 2.026 | 45.367 | 13.90 | 15.291 | 52.471 |
Stability studies
The calculated %drug available after 24hrs was 98.3% for BISO and 97.6% for CILN. The stability study data was tabulated in Table 10.
Table 10: Stability study results of BISO and CILN
| Injection No. | Time in hrs | BISO | CILN |
| % of drug found | % of drug found | ||
| 1 | Initial | 100.2 | 100.6 |
| 2 | 6hrs | 99.8 | 100.3 |
| 3 | 12hrs | 99.5 | 100.5 |
| 4 | 18hrs | 98.5 | 98.8 |
| 5 | 24hrs | 98.3 | 97.6 |
Discussion
In the proposed method, the retention time of Bisoprolol and Cilnidipine was found to be 3.129min and 6.925min respectively. Quantification was linear in concentration range of 2.52-37.80µg/ml for Bisoprolol and 5.0-75.0µg/ml for Cilnidipine. The regression equation of the linearity plot of concentration of Bisoprolol and Cilnidipine over its peak area was found to be
y=43555x+2627.63 (r2=0.9995) for Bisoprolol and y=63276x+34138 (r2=0.9996) for Cilnidipine, where x is the concentration of Bisoprolol and Cilnidipine (µg/ml) and y is the corresponding peak area. The number of theoretical plates calculated was 4662.67 for Bisoprolol and 12144.8 for Cilnidipine and tailing factor was 1.05 for Bisoprolol and 0.95 for Cilnidipine, which indicates efficient performance of the column. The limit of detection and limit of quantification for Bisoprolol were found to be 0.025µg/ml and 0.075µg/ml and for Cilnidipine were found to be 0.050µg/ml and 0.150µg/ml respectively, which indicate the sensitivity of the method. The use of acetonitrile and 0.1% trifluoro acetic acid in the ratio of 60:40 v/v as mobile phase resulted in peak with good shape and resolution. The high percentage of recovery indicates that the proposed method is highly accurate. No interfering peaks were found in the chromatogram of the formulation within the run time indicating that excipients used in tablet formulations did not interfere with the estimation of the drug by the proposed HPLC method.
Conclusion
After extensive study by author, a novel, economical, most stable and effective reversed-phase HPLC method was designed and validated using unique optimized chromatographic conditions than previous studies for estimation of Bisoprolol and Cilnidipine in tablets. Validation report provides evidence that the system was suitable, robust, accurate, linear, rugged & precise projected analytical method even in presence of degradation products up till 24hrs. The proposed HPLC method can be reliably adopted for routine quality control analysis of Bisoprolol and Cilnidipine in its tablet dosage forms.
Acknowledgement
The authors are very grateful to Nizam Institute of Pharmacy, Deshmukhi, Telangana for proving necessary support for carryout the research work.
Funding Sources
The author(s) received no financial support for the research, authorship, and/or publication of this article.
Conflict of Interest
The author(s) do not have any conflict of interest.
Data Availability Statement
This statement does not apply to this article.
Ethics Statement
This research did not involve human participants, animal subjects, or any material that requires ethical approval.
Informed Consent Statement
This study did not involve human participants, and therefore, informed consent was not required.
Clinical Trial Registration
This research does not involve any clinical trials
Permission to reproduce material from other sources
Not applicable
Author Contributions
- Lakshmana Rao Atmakuri: Conceptualization, Methodology, Writing – Original Draft;
- Kurnool Mahammed Ismail: Project Administration, Writing – Review & Editing;
- Vijaya Kumar Ghanta: Data Collection, Analysis;
- Bhaskar Vallamkonda: Funding Acquisition, Resources;
- Ramesh Alluri: Supervision, Data Interpretation;
- Satya Venkata Sakuntala Mamidi: Visualization, Final Draft Approval.
References
- Lancaster SG, Sorkin EM. A preliminary review of its pharmacodynamic and pharmacokinetic properties, and therapeutic efficacy in hypertension and angina pectoris, 1988;36(3):256-285.
CrossRef - Leopold G, Ungethum W, Pabst J, et al. Pharmacodynamic profile of Bisoprolol, a new beta 1-selective adrenoceptor antagonist. Br J Clin Pharmacol.1986;22(3):293-300.
CrossRef - Chandra KS, Ramesh G. The fourth-generation calcium channel blocker: Cilnidipine. Indian Heart J. 2013;65(6):691-695.
CrossRef - Uneyama H, Uchida H, Konda T, et al. Cilnidipine: Preclinical profile and clinical evaluation. Cardiovasc Drug Rev. 1999;17(4):341-357.
CrossRef - Sanjay K, Bharti K, Navneet A. Combination therapy in hypertension: An update. Diabetol Metab Syndr. 2010;2:44.
CrossRef - Revathy AK, Asha T. Simultaneous estimation of Bisoprolol fumarate and Cilnidipine in tablet dosage form using RP-HPLC method. Int J Pharma Bio Sci. 2018:9(4):195-199.
CrossRef - Patel H, Damahe DP, Narkhede SB. RP-HPLC method development and validation for simultaneous estimation of Cilnidipine and Bisoprolol fumarate in tablet dosage form. Int J Chemtech Res. 2019;12(1):269-276.
CrossRef - Pawar S, Tamboli A, Patil S. RP-HPLC method development and validation for simultaneous estimation of Bisoprolol fumarate and Cilnidipine in pharmaceutical dosage form. J Pharm Sci Biosci Res. 2020;10(2):149-155.
- Eswarudu MM, Lakshmana Rao A, Vijay K. Bioanalytical method development and validation for simultaneous determination of Chlorthalidone and Cilnidipine drugs in human plasma by RP-HPLC. Int J Res Pharm Chem. 2019;9(1):33-44.
CrossRef - Q2(R1) Harmonised tripartite guideline. Validation of analytical procedures: text and methodology. Geneva. 2005;1-13.
- Q1A(R2) Harmonised tripartite guideline. Stability testing of new drug substances and products. Geneva. 2003;1-18.
- Lakshmana Rao A, Bhargavi M. Analytical method development and validation for simultaneous estimation of Dexmethylphenidate and Serdexmethylphenidate by RP-HPLC. Int J Res Pharm Chem. 2023;13(1):133-141.
CrossRef - Lakshmana Rao A, Bhavya Naga Vani V. Development and validation of novel analytical method for the simultaneous estimation of Metoprolol and Benidipine in pharmaceutical formulation by using RP-HPLC. Int J Innov Technol Manag. 2022;8(1):12-21.
- Lakshmana Rao A, Naga Navya E. Development and validation of a stability indicating RP-HPLC-UV method for the simultaneous determination of Epalrestat and Pregabalin in combined pharmaceutical formulation. Chromatogr Sep Tech J. 2022;3(1):1-7.
- Lakshmana Rao A, Jyothsna I. Stability indicating HPLC method for simultaneous determination of Amoxicillin trihydrate and Clavulanic acid. Sci Spectr. 2020;5(3-4):105-112.
- Lakshmana Rao A, Malathi Priyanka M. Stability indicating RP-HPLC method development and validation for simultaneous estimation of Metformin and Glipizide. Int J Res Ayush Pharm Sci. 2019;3(7):352-358.
CrossRef

