
Rajender Naik Guguloth*
Department of Electrical and Electronics Engineering, Kakatiya Institute of Technology and Science, Warangal, Telangana, India
Corresponding Author E-mail:grn.eee@kitsw.ac.in
DOI : https://dx.doi.org/10.13005/bpj/3123
Abstract
Background: It is important to classify the ECG (Electrocardiogram) signal in order to diagnose heart illness. Simultaneously, the identification of heart illness also depends on the early identification and precise prediction of various cardiac arrhythmias. The goal of the current study is to categorize the four important class labels that define the conditions of the heart, which are Supraventricular Ectopy, Ventricular Ectopy, Normal Sinus Rhythm, and Supraventricular and Ventricular Ectopy. Objectives: The study's objectives are to remove noise from the ECG signal by using an elliptic filter based on empirical mode decomposition, or EMD-EF. Additionally, it makes use of Multi Structured Pooling Deep RNN (MSP-Deep RNN) and Distribution based Whale Optimization Algorithm (D-WOA) to efficiently choose features and anticipate the four crucial class labels. Methodology: First, the suggested EMD-EF processes the input signal and eliminates undesired noise from it. Subsequently, the pre-processed data are extracted for features by taking into account the various signals of the ECG waveform, which include the PR, PT, QT, QRS Complex, and PQRST Amplitude prediction. The D-WOA then chooses just the pertinent elements for additional classification. The next step is to forecast the four class labels using MSP-Deep RNN. Results/Conclusion: To determine the effectiveness of the suggested system, a comparison analysis is conducted using a range of metrics. Positive Predictive Value (PPV), Specificity, Sensitivity, Accuracy, and Error rate are the parameters that are considered. The suggested method outperforms the current methods in terms of efficiency, as demonstrated by its high accuracy rate and little error in identifying the ECG signals and accurately predicting the class labels.
Keywords
Class Label prediction; Distribution based Whale Optimization Algorithm; Electrocardiogram Signal; Empirical Mode Decomposition based Elliptic Filter (EMDEF); Multi Structured Pooling Deep RNN
Download this article as:| Copy the following to cite this article: Guguloth R. N. Four Class Label Prediction and Heart Condition Diagnosis using Multi Structured Pooling Deep Recurring Neural Network. Biomed Pharmacol J 2025;18(1). |
| Copy the following to cite this URL: Guguloth R. N. Four Class Label Prediction and Heart Condition Diagnosis using Multi Structured Pooling Deep Recurring Neural Network. Biomed Pharmacol J 2025;18(1). Available from: https://bit.ly/42GrfXm |
Introduction
Genetic problems from some common Stem and genes from our ancestors and parents cannot be avoided. But heart diseases can be avoided and prevented from causing damage. The various types of heart conditions or disorders is termed as “heart disease”. There are various types of heart diseases. Among them the most common type of heart condition is coronary artery disease (CAD). The CAD affects the blood flow to heart by blocking the blood vessels. This creates less flow of blood to the heart. This decreased flow of blood may lead to Heart attack. In some cases, there are signs or symptoms of ant heart malfunctions like heart attacks, heart failures, or an arrhythmia. The study1 aimed to classify the ECG signals by employing a methodology termed one dimensional Convolutional Neural Network (1-D CNN). A confusion matrix has also been computed in this study which showed few misclassifications. On the other hand, if the condition of heart is not predicted or left unknown, it causes to death of several people. The heart diseases can be deadly but they can also be prevented. Heart malfunctions are caused because of certain risk factors. Such as Diabetes, over weight and obesity, Unhealthy diet. All these factors lead to increase in high blood pressure, high cholesterol. Some of the human habits may also case medical emergencies such as smoking, consumption of alcohol. The recovery from Heart disorders is more important. Consequently, the paper2 used a Machine Learning (ML) strategy known as Echo State Networks. The analysis reveals the efficacy of this introduced method. Yet, accuracy has to be enhanced further. Additionally, the article employed Discrete Fourier Transform and Welch’s method to predict the spectral power density for enhancing the features corresponding to the ECG signals.
The proposed system is found to be effective with respect to accuracy, specificity and sensitivity. DL methods are yet to be applied to enhance the accuracy in ECG classification3. Hence, the present study employs DL based methods for classifying the ECG signals for predicting the class labels to diagnose the condition of heart. Performance analysis is also carried out to evaluate the efficiency of the introduced methodology.
The major contributions of this study are listed below.
To remove the unwanted noise during the input ECG signal processing by the proposed Empirical Mode Decomposition based Elliptic Filter (EMD-EF).
To select relevant features for efficient classification of ECG signals by the introduced Distribution based Whale Optimization Algorithm (D-WOA).
To predict the four class labels using the proposed Multi Structured Pooling Deep RNN (MSP-Deep RNN).
To analyse the proposed system in terms of various performance metrics such as Accuracy, Specificity, Sensitivity, Positive Predictive Value (PPV) and Error rate.
Paper Organization
The first part explores the basic ideas of ECG classification. Section 2 then discusses the various traditions of research relevant to this context. Section III explains the overall considerations of the proposed system. Section 4 discusses the results obtained by implementing the proposed approach. Finally, Section V concludes the proposed system.
Review of Existing Work
ECG signals can be used to predict heart attack by analysing them using certain algorithms and theories in order to find the cause of the abnormal functioning of heart. Several techniques have been used by the existing system to classify this ECG signals and it is discussed here.
As geared to that aim the following article4 has proposed a method of Long short term memory networks (LSTMs) in deep Recurrent Neural Network (RNN) architecture. In this procedure, a new wavelet-based layer is installed for ECG signals to be generated. They are called as huge bidirectional LSTM network-based wavelet sequences (DBLSTM-WS). This method has result rate of 99.39% in performance. The future work is to apply this process in similar processing problems5. Diagnosing heart problems at earlier stage is being hard often. To avoid those issues, a Convolutional auto-encoder (CAE) is installed to decrease the size of the signals of arrhythmic beats. The results showed time and storage reduction and accuracy over 99%6. Moreover, the ECG signals can be used to detect temporary cessation of breathing in sleep using RNN. In this procedure, RR intervals are engaged to extract the signal waves from ECG. This extraction procedure reveals that this model is providing Obstructive Sleep Apnea (OSA) detection to be accurate. These testing has to be employed in neural network along with accuracy, sensitivity and specificity which remains as a future work7. Similarly, another approach for Electro physiological signals such as ECG can be analysed using models and algorithm. So as to support this fact, a Deep Learning (DL) algorithm has been proposed called DENS-ECG algorithm combining with Convolutional neural network (CNN) along with LSTM. The empirical results show the accuracy and flexibility of this hybrid algorithm. Yet, real-time implementation is not yet done which is a drawback8. On the other hand, the ECG signals are used for diagnosing cardiac arrhythmia to avoid sudden demises. This project is dealing with ECG signal in 3 phases namely noise removal, feature extraction and feature selection9.
A model named Hidden Markov Model (HMM) has been used for the approach. The outcomes showed that the error detection rate in this method had increased by 0.0004%10. Hence, it can be said that the ECG signals play vital role in field of medical science for analysing cardiac physiology regarding their irregular functions. To make this work, efficient ECG signals have been interpreted by signal processing algorithms. This method has proposed some filtering techniques to overcome the issues. The results of this were said to overcome the issues in old methods. The future work relies upon the portable ECG systems11. In correspondence with above said approach, the signal quality is assessed in ECG for improving the accuracy in diagnostics and reliability of other ECG analysis systems. The ECG signals are exposed by different variants of sounds and relics. This method is proposing a new approach for signal quality assessment (SQA). This affords a light weight ECG noise analysis procedure. The outcome of this method was increased in real time ECG noise detection12.
Electroencephalography (EEG) signals are used in analysing the various disorders and seizures appearing in patients. This paper has proposed a method of identifying the seizures automatically of the epileptic patients. This method is applying tuneable-Q wavelet transform (TQWT). This work has attained a 99% in classification accuracy. The future work is proposed for deep learning in diagnosis of epilepsy13. Phonocardiography (PCG) is also one of the Electro physiological signals such as EEG, ECG. The aim of this research was to detect psychological stress using PCG signal depending upon the Empirical Mode decomposition (EMD) technique. This proposed method works in reduced cost14. This is applicable for home treated people, country side centres technically. The future work is to develop kernel-based function and parameter selection15. ECG falls under the group of Biometric signals. ECGs can be analysed using various methods recently. The aim of this theory was to use ECG for human identification. This approach has used Second order difference plot (SODP). This is a non-linear time series investigation method. This method had outcomes with higher accuracy rates. The future work may consist of minimum sampling frequency along the proposed method16.
In real time applications, Signal processing technique is the right choice for processing the ECGs as explored in the study. The traditional techniques don’t completely analyse the ECG17. Hence, a discrete orthogonal stock methodology well transformed this method using discrete cosine transform. The procedure of Particle swarm optimization is also implemented to increase accuracy. The outcome of the method showed perfect detection sensitivity and promising predicatively by 98.85%. Hence, the future work is to implement parallel processing in systems, FPGA and ASIC processor chip and implementing real time analysis for ECG waves18. In addition, the Electro physiological signals likely ECG, EEG, PCG are said to play vital roles to find out the anomalies and abnormalities present in human heart and brains respectively19.
The accuracy constraints may vary according to the methods proposed by each of the theories. The following are also some of the parallel methods to find out the abnormalities happening in the heart. At the same time, various anomalies are distracted by the noise/distortions leading to no accuracy in detecting the exact issue, so to overcome this issue a new fractional wavelet transform has been projected. The outcome was recorded as effective in detecting cardiac issues, The future work consists of detecting R-peak20.
Many techniques and methods are proposed for detecting the cardiac disease recently using the ECG signals. Another method was proposed that depended upon complete end–to-end structure that overcomes the disadvantages of traditional methods21. The outcome of this project was extraordinary as they were efficient and easily accessible through mobiles. They were also accessible in cloud systems. The future work was to develop an efficient ID-CNN using other physiological signals22. The ECG is basic way to respond to the electrical activity of the heart. This signal play’s vital role in by measuring heart rate, examining heart beat rhythm, identifying heart diseases23.
This method was proposed to make a review on above said features of the ECG accordingly24. A spectral power density has been proposed by this method and is calculated. In order to enhance the characteristics of the ECG waves, the proposed approach is used25. They also help in genetic selection, handling, regularizing and character extraction34. Thus, the introduced methodology helps in finding the unusual happenings inside the heart to a certain point. In parallel with the above research, another method is also proposed. ECG is widely used by cardiologists for finding the abnormalities in heart such as heart attacks and heart rhythms35.
For enhancing the clinical research for predicting simple heart arrhythmias in terms of machine learning model selection, electrocardiogram (ECG) feature selection, and model performance evaluation, this work deals with formulation of machine learning boundaries using ECG features effective identification and predictive machine learning models for better treatment options37.
Materials and Methods
This proposed study is developed for accurately recognizing the electrocardiogram- ECG signal as normal or abnormal by selecting the best features using the PQRST amplitude prediction process with Distributed based Whale optimization algorithm. Before that the pre-processing of recorded ECG signal is performed based on the Empirical mode decomposition based on empirical filter which filters the unwanted noise disturbances like base line drift, power line interference and electrode contact noise. For the effective classification of the ECG signal as normal or abnormal, Multi structured pooling Deep RNN is utilized. The proposed flow diagram is shown in following figure.1.
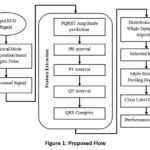 |
Figure 1: Proposed FlowClick here to view Figure |
Pre-processing
In the standard ECG signal classification model, the pre-processing is performed to minimize the unwanted noise disturbances from ECGs. Generally, the disturbances are presented in recorded ECG signal with the equivalent ECG signal characteristics by establishing the noise within the frequency band of interest. The disturbances generally include muscle noise, power line interference, baseline wandering, electrocardiograph noise and so on. By processing the recorded ECG signals, the useful and relevant information are extracted from these kind of noisy ECG signals. These kind of narrow band and wideband noise signals are removed by the proposed Empirical model decomposition-based Empiric Filter.
Empirical mode decomposition based empirical filter
The empirical filter showed the equi-ripple behaviour in stop band and pass band. With response to FIR equi-ripple filter’s characteristic of magnitude response, it shows similarity. Hence, elliptic filters are considered as optimal filters in which it obtains the minimum order ‘n’ for the provided specification. Similarly, for the provided order N, the sharpest transition band has obtained.
The adaptive time-space evaluation approach is referring as Empirical Mode decomposition- EMD which is appropriate for the series processing which are non-linear and non-stationary. A series are partitioned into modes performed by EMD refer as Intrinsic Mode functions- IMF without time domain leaving. It is related with wavelet decomposition and Fourier transforms like time-space analysis methods. Various signals understanding by modes are presented within the data. Specifically, this method is beneficial for natural signals analysing which is usually non-stationary and non-linear.
The algorithm for the proposed Empirical Model Decomposition based Elliptic filter is described below. The individual extreme locations of the given input signal (Secg) is estimated. For attaining the reduced signal as Memin and Memax, each of the minima is interpolated. Further the local mean value is measured and subtract it from the respected signal for obtain the oscillatory mode and if it moves to stopping position then it referred to as IMF or it proceeds from step 1. Angular frequency is gained by low-pass elliptic filter.
| Algorithm I-Empirical Model Decomposition based Elliptic Filter |
| Input – ECG Signal (Secg)Output – Pre-processed signal (Secg)
Procedural steps:
|
Feature Extraction
From the original ECG signal, the information is retained by feature extraction process. Standard features like amplitudes and intervals are delivered by this system for automatic analysis performance. These features are detected by the few techniques. Accurate and fast method is required. In this study, feature extraction is performed by distribution-based whale optimization algorithm. Generally, ECG complex comprised with PQRST complex shown in below figure. The P wave produced by the sinoatrial node- SA which is the heart pacemaker. Atrio ventricular node- AV produces the QRS wave. Atrial de-polarization indicated by ECG complex of P wave. QRS and T wave is responsible for ventricular depolarization and ventricular repolarization respectively.
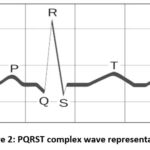 |
Figure 2: PQRST complex wave representationClick here to view Figure |
There is an atrial depolarization lack if a P wave is absent which is refer as atrial standstill. Junctional tachycardia or Ventricular tachycardia indicated by QRS complexes which are combined from P waves. Current P waves are not conducted through AV node due to without indicative QRS. Premature or escape beats demonstrated by without P wave in QRS complex. Supraventricular rhythm and sinus rhythm are identified based on measured wave forms selecting the sinus complexes from recorded signal. Supraventricular rhythms are divided by normal QRS complexes, abnormal P waves, Atrial tachycardia, Atrial fibrillation, Atrial premature complexes and Supraventricular tachycardia. From the ventricles, the ventricular rhythms originated divided by, Ventricular premature complexes, Ventricular tachycardia, Ventricular escape complexes, Ventricular fibrillation and Wide and bizarre QRS complexes. From the sinoatrial node, sinus rhythms are originated and divided by Regular sinus rhythm, Sinus tachycardia, Sinus bradycardia, Sinus arrhythmia and normal QRS complexes in P waves. Differences among the ventricular arrhythmia and atrial arrhythmia modifies the treatment and the results.
Whale optimization algorithm
This study utilized the whale optimization algorithm- WOA for identifying the optimal feature subset which maximize the performance of classification. Based on initial best search agent, the whales can adjust their locations continuously at any point in the space. Towards the best search agent, the positions are updated. The solutions are explained as continuous vector with similar dimension in dataset. The values of solution vector are continuous and to [0, 1] it is bounded.
The algorithm for distribution-based whale optimization algorithm is shown below. The solution fitness evaluation values are represented in binary form. The fitness function is matching ordinarily with number of selected features and performance of classification with represented equation.1.
![]()
From above Eq. (), fitness function is fθ which represented θ as vector, size is N with selected / unselected subset describing 1/0 elements and total number of features are N in the dataset. Selected feature subset provided the classification error E and constant value is α handling the trade-off among the classification error. This study utilized α = 1 since the performance of classification is the major achievement.
The proposed distribution-based whale optimization algorithm is shown below. The extracted features are the input and the optimized features are output as Fecg and Ofea respectively. By follows the algorithm described below, follows whale optimization procedure and individual search agent fitness is measured.
| Algorithm II – Distribution based Whale Optimization Algorithm |
| Input – Extracted Features (Fecg)Output – Optimized Features (Ofea)
Step 1 – Initialize the population of whales F iecg (i = 1,2,…,n) Step 2 – Compute the fitness of individual search whale population F*ecg is the best search whale population while MI< maximum count of iterations do for each search whale population do Update b,B, D,m and q if (q < 0.5) then if (|B| < 1) then Update the current whale position with a position in random in the best solution neighbourhood in the present swarm. else if (|B| ≥ 1) then Choose an agent in random (Frecg) from the present swarm Update the current whale position with a position in random in the random agent neighbourhood Frecg end if else if (q ≥ 0.5) then Update the current whale position in accordance with the Bubble Net method end if end for Find if there a search agent drives beyond the search space as well as amend it. Compute the fitness of the individual search agent Update F*ecg is there exists an effective solution MI = MI + 1 end while return F*ecg |
Classification
Deep RNN – Deep Recurrent Neural Network
The sharing states (SS) are disintegrated into several layers in deep RNN to gain efficient features from the deep architectures. In a computational graph, the deep RNN intends to map the sequence of input x1 into its equivalent sequential output y1 Moreover, the process of learning is undertaken each time from t1 = 1 to t1 = µ. For each time of step t1, the parameters of neuron network at the layer I1 update its corresponding SS based on the below equations.
Here b(t1) is the data taken as input at the time step, a(t1) is the prediction and atarg(t1) indicates the true values corresponding to the targeted output. hl1(t1) Represents the SS of the network layer l1 at t1th time step. x(t1) Indicates the input value of layer l1 at t1th time step. It comprises of three varied components. They are time step t1 of input b(t1) or SS hl1 – 1(t1) at t1th time from layer l1 – 1, bias Y and the SS hl1(t1 – 1) at the present network layer of l1 from the last time step of t1 – 1 The sharing features of deep RNN make the algorithm for learning the uncertainties iterated in earlier time steps36.
Multi Structured Pooling Deep RNN (MSP-Deep RNN)
This step of the introduced methodology comprises of training as well as testing of pooling that rely on the load predictions by the following steps.
In training, the batches of load profile train the Deep RNN that is fetched in a random manner from the LPP (Load Profile Pool). This makes the proposed MSP-deep RNN to not only learn each pattern of the load but also generally share the load features and its corresponding uncertainties.
In testing, the test LPs are given into fine trained introduced MSP-Deep RNN. An assumption is made for the cleaned LP database as and the testing households are provided in set S1 = {s1, s2,….sn}. The parameters of the MSP-Deep RNN are denoted by l1 and h, which indicates the number of layers (depth of the network) as well as the hidden unit amount38. By taking these parameters into account, the training as well as testing can be undertaken by the below steps.
Initialize the Multi Structured Pooling Deep RNN
At first, the MSP-Deep RNN is constructed with the configuration parameters of the network l1, that is, the depth of the network, hidden unit amount , the size of batch b1, the size of input sequence i1 and the the size of output sequence o1.
Iterations of network training
After initiating the network, the epochs of the training iteration is run by the program till the network is fine trained with congregated loss in network prediction with respect to Reduced Mean Square Error – RMSE as shown in equation.7.

At first, the batches of training are fetched from LPP in the individual training epochs. This is then fed to the proposed MSP-Deep RNN. The individual training batch comprise of two matrices that are of fixed size. That is, the input matrix that consists of the size b1 * i1 and the output matrix of size b1 * o1. The iteration epochs and time cost of the training process highly rely on size of Feed-In-Data Sequence i1, the optimizer choice, the size of the network (l1, h) as well as the batch size of the training b1. To balance between the efficacy and efficiency of training, the size of training batch b1 varies during training process based on the below steps.
At initial epochs, b1 is a collection as a minimum count to approach the ideal point in a rapid manner.
Subsequently, b1 is step-by-step enhancement towards effective performance of training but at the same time it reduces the cost of time.
Results and Discussion
The proposed method is implemented to predict the four class labels of the heart conditions based on deep learning. The obtained results are discussed in this section. In addition, the performance of the proposed system is analysed with respect to important parameters. The utilized performance metrics are presented along with the results of the performance analysis.
Performance Metrics
The proposed system was analyzed based on certain important parameters namely accuracy, sensitivity, specificity, positive predictive value (PPV) and error rate to evaluate the efficiency of the proposed system. They are explained below.
Accuracy
It is defined as the measure of overall correct prediction. It is represented by equation.8.
![]()
Sensitivity
It indicates the positive predictions that are suitably recognized and is given by equation.9.
![]()
Specificity
It is the quality or state of being unique or specific to a group or particular individual. It is represented by equation.10.
![]()
Positive Predictive Value (PPV)
The PPV is the ratio of positive outcomes in diagnostics and statistics that are TP results. It describes the prediction performance or any other statistical measure. It is presented by equation.11.
![]()
Error
This particular metric is employed for measuring the faults in a prediction. It is given by equation.12.
![]()
Experimental Results
The four class labels corresponding to the heart conditions are predicted based on the proposed flow and the obtained results are discussed here.
Various processes are undertaken to predict the class labels and the results obtained for Normal Sinus Rhythm and Supraventricular Ectopy is shown in figure.3.
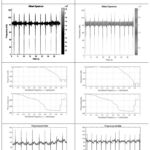 |
Figure 3: Normal Sinus Rhythm and Supraventricular Ectopy Click here to view Figure |
Here, initially the input signal is processed and the Hilbert spectrum is obtained with respect to time and frequency for both Normal Sinus Rhythm and Supraventricular Ectopy based on Empirical Mode Decomposition based Elliptic Filter. Then, the normalized frequency is obtained for both of these class labels with regard to phase and magnitude. This data is later pre-processed to analyse the PQRST complex for Normal Sinus Rhythm and Supraventricular Ectopy. The obtained PQRST complex analysis for Normal Sinus Rhythm is shown in table-1 and for Supraventricular Ectopy, it is shown in table-2. Similarly, the results obtained for Ventricular Ectopy and Supraventricular and Ventricular Ectopy is shown in figure.4.
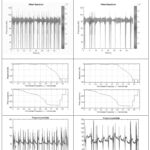 |
Figure 4: Ventricular Ectopy and Supraventricular and Ventricular EctopyClick here to view Figure |
At first, the input signal is processed and the Hilbert spectrum is attained with respect to frequency and time for both Ventricular Ectopy and Supraventricular and Ventricular Ectopy based on Empirical Mode Decomposition based Elliptic Filter to remove the unwanted noise. Subsequently, the normalized frequency is obtained for both of these class labels in accordance with phase and magnitude. Later, this data is pre-processed for PQRST complex analysis for Ventricular Ectopy and Supraventricular and Ventricular Ectopy. The obtained PQRST complex analysis for Ventricular Ectopy is shown in table-3 and for Supraventricular and Ventricular Ectopy, it is shown in table-4.
Normal Sinus Rhythm
The representation of ECG waveform is composed of signals of five fundamental waves namely P, Q, R, S and T. All these waves are analysed to predict the corresponding class labels of heart condition. Generally, a normal sinus rhythm is the rhythm corresponding to a healthy heart. The results obtained through the PQRST complex analysis for Normal Sinus Rhythm is discussed here as given in table-1.
Table 1: The results of PQRST complex analysis for Normal Sinus Rhythm
| P-Wave Amplitude (mV) | 0.26 |
| Q-Wave Amplitude (mV) | 0.1845 |
| R-Wave Amplitude (mV) | 0.2506 |
| S-Wave Amplitude (mV) | 0.1689 |
| T-Wave Amplitude (mV) | 0.2484 |
| QRS complex (mV) | 3 |
| ST Segment (s) | 2 |
| PR Segment (s) | 3 |
| RR Interval (s) | 10 |
| TT Interval (s) | 10 |
| QT Interval (s) | 5 |
| PP Interval (s) | 10 |
The amplitudes of P-Wave, Q-Wave, R-Wave, S-Wave, T-Wave, QRS complex, ST and PR Segments, RR Interval, TT and PP Intervals are all analysed and the values are obtained for all these.
Supraventricular Ectopy
This kind of rhythm is an occasional irregular heart beat that originates from the upper part of the heart. The results obtained through the PQRST complex analysis for Supraventricular Ectopy is discussed here as given in table-2.
Table 2: The results of PQRST complex analysis for Supraventricular Ectopy
| P-Wave Amplitude (mV) | 0.3158 |
| Q-Wave Amplitude (mV) | 0.2641 |
| R-Wave Amplitude (mV) | 0.3223 |
| S-Wave Amplitude (mV) | 0.2735 |
| T-Wave Amplitude (mV) | 0.3222 |
| QRS complex (mV) | 4 |
| ST Segment (s) | 1 |
| PR Segment (s) | 4 |
| RR Interval (s) | 10 |
| TT Interval (s) | 10 |
| QT Interval (s) | 5 |
| PP Interval (s) | 11 |
Ventricular Ectopy
This kind of heartbeat denotes the small changes in the normal heartbeat. It results in skipped or extra beats and are typically harmless. The results obtained through the PQRST complex analysis for Ventricular Ectopy is discussed here as given in table-3.
Table 3: The results of PQRST complex analysis for Ventricular Ectopy
| P-Wave Amplitude (mV) | 0.2649 |
| Q-Wave Amplitude (mV) | 0.254 |
| R-Wave Amplitude (mV) | 0.2615 |
| S-Wave Amplitude (mV) | 0.2474 |
| T-Wave Amplitude (mV) | 0.2585 |
| QRS complex (mV) | 3 |
| ST Segment (s) | 1 |
| PR Segment (s) | 3 |
| RR Interval (s) | 9 |
| TT Interval (s) | 9 |
| QT Interval (s) | 4 |
| PP Interval (s) | 9 |
Supraventricular and Ventricular Ectopy
Supraventricular and Ventricular Ectopy is one of the class labels that are predicted to determine the heart condition based on the different PQRST waves. The results obtained through the PQRST complex analysis for Supraventricular and Ventricular Ectopy is discussed here as given in table-4.
Table 4: The results of PQRST complex analysis for Supraventricular and Ventricular Ectopy
| P-Wave Amplitude (mV) | 0.2818 |
| Q-Wave Amplitude (mV) | 0.223 |
| R-Wave Amplitude (mV) | 0.2658 |
| S-Wave Amplitude (mV) | 0.2199 |
| T-Wave Amplitude (mV) | 0.2552 |
| QRS complex (mV) | 3 |
| ST Segment (s) | 2 |
| PR Segment (s) | 3 |
| RR Interval (s) | 11 |
| TT Interval (s) | 10 |
| QT Interval (s) | 5 |
| PP Interval (s) | 10 |
Thus, for different class labels, the analysed amplitudes of P-Wave, Q-Wave, R-Wave, S-Wave, T-Wave, QRS complex, ST and PR Segments, RR Interval, TT Interval, TT and PP Intervals differs accordingly.
Performance and Comparative analysis
The proposed system is evaluated by comparison with existing methods with respect to specific parameters. This section explains it very clearly. Sensitivity, specificity, positive predictive value (PPV), and accuracy were the parameters considered in the analysis. The results obtained are shown in Table 5.
Table 5: Comparative analysis of the proposed and existing methods with respect to various performance metrics
| Ref / Author / year | Sensitivity | Specificity | Positive Predictive Value (PPV) | Accuracy |
| 26 | 97.51% | 85.00% | 97.26% | 97.94% |
| 27 | 95% | 0 | 98% | 93% |
| 28 | 98.50% | 99.69% | 98.91% | 98.80% |
| 29 | 99.70% | 0 | 99.65% | 0 |
| 30 | 99.18% | 0 | 98% | 0 |
| Proposed | 99.92% | 99.92% | 100% | 99.95% |
The sensitivity rate of the existing26 system is found to be 97.51%, traditional study3 shows 95% as sensitivity rate. Similarly, the existing4,29 and 30 exhibits 98.50%, 99.70% and 99.18% as its sensitivity rate. On the other hand, the proposed method shows 99.92% as sensitivity rate which is higher than all other existing methods. Similarly, the sensitivity, specificity, PPV and accuracy is also found to be higher than the traditional studies that reveals the outstanding performance of the proposed methodology. It is graphically shown in below figure.5.
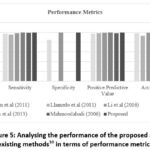 |
Figure 5: Analysing the performance of the proposed and existing methods10 in terms of performance metricsClick here to view Figure |
It is clearly seen from the above figure.4 that the proposed method shows high sensitivity, specificity, PPV and accuracy rate than the traditional methodologies. The existing study4 utilized a multi-domain, Support Vector Machine (SVM) and Kernel Independent Component Analysis for ECG recognition and obtained 98.8% accuracy. Whereas, the present study employed Empirical Mode decomposition based Elliptic Filter to remove noise, Distribution based Whale Optimization algorithm for selecting relevant features and multi-structured pooling deep RNN for predicting the heart condition based on the four class labels and obtained 99.95% accuracy. Hence, the proposed system is effective than the existing studies in classifying the ECG signal. Additionally, another comparative analysis is carried out in terms of PPV and sensitivity and the results obtained are presented in table-6.
Table 6: Comparative analysis of the proposed and existing methods10 with respect to sensitivity and PPV
| Ref / Author / year | Sensitivity | Positive Predictive Value (PPV) |
| [27] | 80% | 82% |
| [31] | 98.90% | 99.40% |
| [28] | 97.50% | 97.41% |
| [32] | 96% | 98% |
| [10] | 99.80% | 100% |
| Proposed | 99.92% | 100% |
The sensitivity rate of existing27 is found to be 80%. On the other hand, the proposed method shows 99.92% as sensitivity rate. Other traditional system28-32 and 10 also show minimum sensitivity rate in comparison to the proposed method. PPV value of existing studies are also found to be minimum when compared to the proposed. Though the study shows PPV value as same as proposed system, the sensitivity value is higher for the introduced method than the existing study10. Thus, it is concluded that the proposed method is effective in terms of both the PPV and sensitivity rate. It is graphically shown in figure.6.
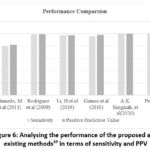 |
Figure 6: Analysing the performance of the proposed and existing methods10 in terms of sensitivity and PPV Click here to view Figure |
The existing study10 proposed an intelligent learning strategy to enhance the classification of ECG signal and the sensitivity as well as PPV rate is found to be 99.80% and 100%. Similarly, the present study uses Multi Structured Pooling Deep RNN to predict the heart condition by classifying the class labels corresponding to the ECG signals. The sensitivity and PPV rate for the proposed system is found to be 99.92% and 100%. Though, the PPV rate is similar to the existing and proposed system, sensitivity is maximum for the proposed method than the existing one10. Hence, it is concluded from the comparative analysis that the proposed methodology is effective than the traditional techniques. The introduced methodology is also analysed in terms of error and accuracy by comparing with the existing system and the obtained results are shown in table-7.
Table 7: Comparative analysis of the proposed and existing methods33 with respect to Accuracy and Error
| Classifier | SVM | Adaboost | ANN | Naive Bayes | Proposed |
| Accuracy | 87.5 | 93 | 94 | 99.7 | 99.82 |
| Error | 12.5 | 7 | 6 | 0.3 | 0.05 |
As per the above analysis, the existing system have used AVM, Adaboost, ANN and Naïve Bayes for classifying the ECG signal and obtained various accuracy rates. The SVM shows 87.5% as accuracy rate, Adaboost shows 93%, ANN explores 94% and Naïve Bayes shows 99.7%. Whereas the proposed method employs Multi Structured Pooling Deep RNN for predicting the class labels and the accuracy rate is found to be 99.82%. On the other hand, the error rate also differs for each algorithm. Thus, it can be summarized from the analysis that the proposed method is effective than the existing methods as it shows high accuracy rate and minimum error rate thereby proving its efficacy than other methods.
Conclusion
The work proposes methodologies based on deep learning for efficient classification of ECG signals to predict four class labels that are responsible to detect the heart condition. Normal Sinus Rhythm, Supraventricular Ectopy, Ventricular Ectopy and Supraventricular and Ventricular Ectopy are the four class labels that have been predicted in this research. For this purpose, the work employed Empirical Mode Decomposition based Elliptic Filter (EMD-EF) to remove unwanted noise from the input ECG signal. The relevant features have been selected through the use of the proposed Distribution based Whale Optimization Algorithm (D-WOA). Finally, Multi Structured Pooling Deep RNN (MSP-Deep RNN) has been used for prediction of the four class labels. A performance analysis has also been undertaken to examine the effectiveness of the proposed methodology with respect to specific parameters. The analytical outcomes exhibited the efficiency of the introduced techniques as it explored minimum error rate and high accuracy rate in predicting the class labels. As listed in Table-7, it is evident that the proposed classification method was much accurate in comparison to the existed methods. The proposed method has also resulted in a minimum error than the existing methods. Hence, this study can help the physicians to find the patient’s heart condition easily and give treatments accordingly.
Acknowledgement
I would like to thank my teachers for their guidance and Management of Kakatiya Institute of Technology and Science, Warangal, for giving sufficient time and support for my research.
Funding Sources
The author(s) received no financial support for the research, authorship, and/or publication of this article.
Conflict of Interest
The author(s) do not have any conflict of interest.
Data Availability Statement
This statement does not apply to this article.
Ethics Statement
This research did not involve human participants, animal subjects, or any material that requires ethical approval.
Informed Consent Statement
This study did not involve human participants, and therefore, informed consent was not required.
Clinical Trial Registration
This research does not involve any clinical trials
References
- J, Randazzo. V, Cirrincione. G, and Pasero. E. 1-D convolutional neural network for ECG arrhythmia classification. Progresses in Artificial Intelligence and Neural Systems. Springer, 2021; 269-279.
CrossRef - M, Soriano. M.C, and Ortín. S. A fast machine learning model for ECG-based heartbeat classification and arrhythmia detection. Frontiers in Physics, 2019; 7: 1-11.
CrossRef - Pławiak. P and Abdar. M. Novel methodology for cardiac arrhythmias classification based on long-duration ECG signal fragments analysis. Biomedical signal processing, ed: Springer, 2020; 225-272.
CrossRef - Ö. A novel wavelet sequence based on deep bidirectional LSTM network model for ECG signal classification. Computers in biology and medicine, 2018; 96: 189-202.
CrossRef - U.R, Fujita. H, Adam. M, Lih. O.S., Sudarshan. V.K, Hong. Automated characterization and classification of coronary artery disease and myocardial infarction by decomposition of ECG signals: A comparative study. Information Sciences, 2017; 377: 17-29.
CrossRef - O, Baloglu. U.B., Tan. R.S, Ciaccio. E.J, and Acharya. U.R. A new approach for arrhythmia classification using deep coded features and LSTM networks. Computer methods and programs in biomedicine, 2019; 176:121-133.
CrossRef - M, Sori. W.J, Jiang. F, Khan. A, and Liu. S. Recurrent neural network based classification of ECG signal features for obstruction of sleep apnea detection. 2017 IEEE International Conference on Computational Science and Engineering (CSE) and IEEE International Conference on Embedded and Ubiquitous Computing (EUC), 2017; 199-202.
CrossRef - A and Puthusserypady. S. DENS-ECG: A deep learning approach for ECG signal delineation. Expert Systems with Applications, 2021; 165: 113-119.
CrossRef - K, Pan. W, Li. Y, Jiang. Q, and Liu. G. A method to detect sleep apnea based on deep neural network and hidden markov model using single-lead ECG signal. Neurocomputing, 2018; 294: 94-101.
CrossRef - A.K, Arumugam. M, and Bian. G.B. An intelligent learning approach for improving ECG signal classification and arrhythmia analysis. Artificial intelligence in medicine, 2020; 103. doi:10.1016/j.artmed.2019.101788.
CrossRef - A, Carol. J.J, Raja. C, Kumar. S, Daniel. A.V, A. Malar. A.J.G. A study on ECG signal characterization and practical implementation of some ECG characterization techniques. Measurement, 2019; 147. doi:10.1016/j.measurement.2019.02.040.
CrossRef - U, Ramkumar. B, and Manikandan. M.S. A review of signal processing techniques for electrocardiogram signal quality assessment. IEEE reviews in biomedical Engineering, 2018; 11: 36-52.
CrossRef - A and Pachori. R.B. Classification of epileptic electroencephalogram signals using tunable-Q wavelet transform based filter-bank. Journal of Ambient Intelligence and Humanized Computing, 2020; 1-15.
CrossRef - G, Zhang. C, Liu. Y, Yang. H, Fu. D, Wang. H. A global and updatable ECG beat classification system based on recurrent neural networks and active learning. Information Sciences, 2019; 501: 523-542.
CrossRef - A and Singh. M. Psychological stress detection using phonocardiography signal: an empirical mode decomposition approach. Biomedical Signal Processing and Control, 2019; 49: 493-505.
CrossRef - G, Kutlu. Y, and Yeniad. M. ECG based human identification using Second Order Difference Plots. Computer Methods and programs in Biomedicine, 2019; 170: 81-93.
CrossRef - B. M, Lin. Y.T, Lin. C.H, Abbod. M.F, and Shieh. J.S. ECG arrhythmia classification by using a recurrence plot and convolutional neural network. Biomedical Signal Processing and Control, 2021; 64: 102262.
CrossRef - S and Ray. K. C. ECG signal analysis using DCT-based DOST and PSO optimized SVM. IEEE Transactions on instrumentation and measurement, 2017; 66: 470-478.
CrossRef - E.K, Zhang. X, and Pan. L. Automatic classification of CAD ECG signals with SDAE and bidirectional long short-term network. IEEE Access, 2019; 7: 182873-182880.
CrossRef - V and Mittal. M. A comparison of ECG signal pre-processing using FrFT, FrWT and IPCA for improved analysis. IRBM, 2019; 40: 145-156.
CrossRef - U, Ramkumar. B and Manikandan. M.S. Automated ECG noise detection and classification system for unsupervised healthcare monitoring. IEEE Journal of biomedical and health informatics, 2017; 22: 722-732.
CrossRef - Yıldırım. Ö, Pławiak. P, Tan. R.S, and Acharya. U.R. Arrhythmia detection using deep convolutional neural network with long duration ECG signals. Computers in biology and medicine, 2018; 102: 411-420.
CrossRef - A, Avci. D, Avci. E, and Gedikpinar. M. A new technique for ECG signal classification genetic algorithm Wavelet Kernel extreme learning machine. Optik, 2019; 180: 46-55.
CrossRef - S. K, Uysal. A.K, Gunal. E.S, Ergin. S, Gunal. S, and Gulmezoglu. M. B. A survey on ECG analysis. Biomedical Signal Processing and Control, 2018; 43: 216-235.
CrossRef - Pławiak. P. Novel methodology of cardiac health recognition based on ECG signals and evolutionary-neural system. Expert Systems with Applications, 2018; 92: 334-349.
CrossRef - J, Min. S.D, and Lee. M. An arrhythmia classification algorithm using a dedicated wavelet adapted to different subjects. Biomedical engineering online, 2011; 10: 1-19.
CrossRef - M and Martínez. J.P. Heartbeat classification using feature selection driven by database generalization criteria. IEEE Transactions on Biomedical Engineering, 2010; 58: 616-625.
CrossRef - H, Yuan. D, Wang. Y, Cui. D, and Cao. L. Arrhythmia classification based on multi-domain feature extraction for an ECG recognition system. Sensors, 2016; 16(10): 1744.
CrossRef - Y, Chen. X, Zhang. X, and Zhou. P. ECG artifact removal from EMG recordings using independent component analysis and adapted filter. 6th International IEEE/EMBS Conference on Neural Engineering (NER), 2013; 347-350.
CrossRef - S, Ahmadian. A, Abolhasani. M, Eslami. M, and Bidgoli. J. ECG feature extraction based on multiresolution wavelet transform. 2005 IEEE Engineering in Medicine and Biology 27th Annual Conference, 2006; 3902-3905.
CrossRef - Rodriguez-Sotelo. J.L, Cuesta-Frau. D, Peluffo-Ordónez. D, and Castellanos-Dominguez. G. Unsupervised feature selection in cardiac arrhythmias analysis. Annual International Conference of the IEEE Engineering in Medicine and Biology Society, 2009; 2571-2574.
CrossRef - P.R, Soares. F.O, Correia. J, and Lima. C. ECG data-acquisition and classification system by using wavelet-domain hidden markov models. Annual International Conference of the IEEE Engineering in Medicine and Biology, 2010; 4670-4673.
CrossRef - S and Vasanth. K. ECG signal classification using various machine learning techniques. Journal of medical systems, 2018; 42: 1-11.
CrossRef - T, Danciu. G.M., Ilie. I, Nicolae. I.E. and Nechifor. S.C. A simplified Approach for Accurate Arrythmia Detection using Automated Machine Learning. 13th International Symposium on Advanced Topics in Electrical Engineering (ATEE), Bucharest, Romania, 2023; 1-5. doi: 10.1109/ATEE58038.2023.10108192.
CrossRef - A and Izharuddin. Improved Deep Residual Convolution Neural Network for Detection of Arrythmia from Electrocardiographic Data. 11th International Conference on System Modeling & Advancement in Research Trends (SMART), Moradabad, India, 2022; 1-5. doi: 10.1109/SMART55829.2022.10047475.
CrossRef - A and Kotadi. C. Design of a novel recurrent neural network design with augmented activation for classification of ECG signals. 10th International Conference on Emerging Trends in Engineering and Technology – Signal and Information Processing (ICETET-SIP-22), Nagpur, India, 2022; 01-06. doi: 10.1109/ICETET-SIP-2254415.2022.9791513.
CrossRef - R and Jyoti. A Hybrid Approach Using SVM, KNN and Random Forest for ECG Classification. 11th International Conference on Intelligent Systems and Embedded Design (ISED), Dehradun, India, 2023; 1-6. doi: 10.1109/ISED59382.2023.10444570.
CrossRef - A and Izharuddin. Denoising ECG signals and their analysis using Hybrid Deep learning model. International Conference on Disruptive Technologies (ICDT), Greater Noida, India, 2023; 495-499. doi: 10.1109/ICDT57929.2023.10150811.
CrossRef

