
Manuscript accepted on :05-02-2025
Published online on: 26-02-2025
Plagiarism Check: Yes
Reviewed by: Dr. Bhuvana R
Second Review by: Dr. Narasimha Murthy
Final Approval by: Dr. Prabhishek Singh
Pooja Shivanand dodamani , Kanmani Palanisamyand Ajit Danti3
Computer Science and Engineering, Christ University, Bangalore, India
Corresponding Author E-mail: puja.pooh91@gmail.com
DOI : https://dx.doi.org/10.13005/bpj/3082
Abstract
This research delves into the technical advancements of image segmentation and classification models, specifically the refined Pix2Pix and Vision Transformer (ViT) architectures, for the crucial task of osteoporosis detection using X-ray images. The improved Pix2Pix model demonstrates noteworthy strides in image segmentation, achieving a specificity of 97.24% and excelling in the reduction of false positives. Simultaneously, the modified ViT models, especially the MViT-B/16 variant, exhibit superior accuracy at 96.01% in classifying osteoporosis cases, showcasing their proficiency in identifying critical medical conditions. These models are poised to revolutionize osteoporosis diagnosis, providing clinicians with accurate tools for early detection and intervention. The synergies between the Pix2Pix and ViT models open avenues for nuanced approaches in automated diagnostic systems, with the potential to significantly improve clinical results and contribute to the broader landscape of medical image analysis. As osteoporosis remains a prevalent and often undiagnosed condition, the technical insights from this study hold substantial importance in advancing the field, emphasizing the critical role of accurate diagnostic tools in improving patient care and health outcomes.
Keywords
BMD; Osteoporosis; Pix2Pix Segmentation; ViT Classification; X-ray Images
Download this article as:| Copy the following to cite this article: Dodamani P. S, Palanisamy K, Danti A. Novel Approach for Osteoporosis Classification Using X-ray Images. Biomed Pharmacol J 2025;18(March Spl Edition). |
| Copy the following to cite this URL: Dodamani P. S, Palanisamy K, Danti A. Novel Approach for Osteoporosis Classification Using X-ray Images. Biomed Pharmacol J 2025;18(March Spl Edition). Available from: https://bit.ly/4hYX7LQ |
Introduction
Medical image analysis has witnessed significant advancements in recent years with the emergence of deep learning techniques. X-ray imaging is a valuable diagnostic tool in medicine, aiding in the detection of various conditions, including osteoporosis. Image analysis plays a pivotal role in healthcare by providing clinicians with advanced tools to interpret and diagnose medical conditions. It allows for the precise visualization of internal structures, aiding in the early detection and treatment of diseases. It contributes to improved patient care, faster diagnoses, and better treatment planning, ultimately enhancing the overall quality of healthcare services.
Pix2Pix, a state-of-the-art generative adversarial network (GAN), as a cutting-edge solution for image segmentation in X-ray imaging. Pix2Pix offers the promise of automating and enhancing the precision of this critical task, with the potential to impact the accuracy and efficiency of medical diagnoses.1
This precision is crucial for identifying regions of interest (ROIs) in X-ray images, such as fractures or areas of bone density change, with remarkable accuracy. Additionally, Pix2Pix can improve image quality by reducing noise and artifacts 2, thereby facilitating more reliable segmentation results. Moreover, by generating synthetic X-ray images, Pix2Pix aids in data augmentation, expanding the dataset for segmentation tasks and improving model generalization. The synthetic data generation approach has been effective in addressing data scarcity issues 3, ensuring that segmentation models are well-trained. Furthermore, Pix2Pix’s conditional image translation capability allows it to adapt to specific segmentation tasks, focusing on particular anatomical structures or pathologies. Overall, Pix2Pix’s capabilities offer significant potential to reduce manual intervention, save time, and enhance the accuracy and efficiency of X-ray image segmentation in clinical settings.
This research introduces the integration of ViT into the field of X-ray image classification, presenting a state-of-the-art solution with the potential to elevate the precision and efficiency of medical diagnoses. This research aims to explore the feasibility, advantages, and implications of employing ViT for the classification of X-ray images, thereby advancing the capabilities of medical image analysis and ultimately improving patient care. The effectiveness of the ViT model in classifying X-ray images for osteoporosis detection has demonstrated remarkable potential, as evidenced by several prominent studies in the field. ViT, initially developed for natural image classification, has displayed its adaptability in medical imaging applications 4. Its self-attention mechanism empowers ViT to obtain intricate patterns and relationships within X-ray images, making it particularly suited for discerning subtle features indicative of osteoporotic conditions.
One notable study investigated ViT’s performance in classifying X-ray images into normal and osteoporotic categories. The findings revealed that ViT achieved competitive accuracy and sensitivity levels, approaching radiologist-level performance in osteoporosis detection.5 This underscores ViT as a tool for enhancing the diagnostic capabilities of medical practitioners in the realm of X-ray image analysis. Furthermore, extended ViT’s application in medical imaging by addressing issues related to data scarcity. The author proposed a transfer learning approach using pre-trained ViT models on large-scale natural image datasets, followed by fine-tuning on limited medical image data. This strategy improved ViT’s generalization and adaptability to specific medical imaging tasks, such as osteoporosis detection.6 In addition, The interpretability of ViT-based models in medical image analysis, shedding light on how ViT’s self-attention mechanisms can aid radiologists in understanding and verifying the model’s decisions. Their findings suggest that ViT not only excels in classification but also provides valuable insights into the image features contributing to its decisions.15 Furthermore, its application can extend healthcare access to underserved regions through telemedicine and generate valuable data-driven insights to inform public health initiatives. Overall, this research has the power to improve patient outcomes, streamline healthcare delivery, and drive advancements in medical imaging, making it a pivotal asset in the pursuit of early disease detection and enhanced healthcare. This paper consists of sections 1. Introduction 2. Literature Review 3. Method 4. Results 5. Discussion and Conclusion.
Literature Review
This study aims to assess bone mineral density (BMD) in postmenopausal women using standard lumbar spine X-ray imaging. This technique presents a promising alternative by reducing both radiation exposure and costs for individuals at heightened risk of osteoporosis or osteopenia who may require more extensive screening 11.
Although deep learning models are not a replacement for Dual-energy X-ray absorptiometry (DXA), they offer a viable substitute when lumbar spine X-rays are available, and DXA has not been conducted. To ensure robust evaluation, retrospective data may be necessary to validate the model’s capacity to predict fracture risks before initiating prospective clinical trials 9.
Osteoporosis is a metabolic disorder that leads to decreased BMD, weakened bone structure, and deterioration of the extracellular matrix, increasing the likelihood of fractures. Typically, this condition affects women and men over the ages of 55 and 65, respectively, causing fractures, chronic pain, and diminished quality of life. Biomarkers such as bone alkaline phosphatase (BALP), collagen, osteocalcin, and cathepsin-K have been shown to effectively monitor osteoporotic progression. Diagnostic techniques like dual-energy X-ray absorptiometry (DEXA) are critical for measuring BMD and bone mineral content (BMC), thereby facilitating effective disease management. Treatment strategies primarily focus on anabolic agents and anti-resorptive medications that enhance bone formation, decrease bone loss, and regulate bone remodeling. However, side effects of these drugs necessitate novel approaches, including combination therapies. This study highlights the need for an integrated approach to osteoporosis management, encompassing lifestyle changes, pharmaceutical solutions, advanced drug delivery systems, and emerging technologies such as artificial intelligence and machine learning to mitigate complications and reduce the risk of fractures .7
Accurate osteoporosis classification plays a vital role in diagnosing skeletal disorders related to aging. This research introduces a hybrid classification model based on a Gradient-Particle Swarm Optimization (HSG) framework and a Deep Belief Network. By combining the strengths of the Particle Swarm Optimization (PSO) algorithm with Gradient Descent (GD), the method enhances classification accuracy while minimizing computational effort. The proposed system involves five stages: data preprocessing, segmentation using an Active Shape Model, geometric analysis via a novel template search method, feature extraction to capture relevant attributes, and final classification using the HSG-based Deep Belief Network. The template search method effectively updates geometric points in femur segments, improving efficiency. Experimental results, validated on real-world datasets, showed exceptional performance with an accuracy of 0.9724, as well as high sensitivity and specificity, demonstrating its potential for reliable osteoporosis classification. 8
Osteoporosis is a prevalent condition in older adults and postmenopausal women, characterized by reduced BMD and compromised bone microarchitecture, which significantly increase fracture risks and complicate spinal surgeries. This study explores the use of transfer learning in deep learning models for diagnosing and predicting osteoporosis using sagittal spine X-rays obtained from patients with spinal disorders. A retrospective analysis was conducted using 256 images from 2,300 patients who underwent both DXA and lumbar spine X-rays between 2013 and 2021. Models including VGG16, VGG19, ResNet50, and Xception were evaluated, with ResNet50 delivering the best results. The model achieved an accuracy of 82%, a precision of 80%, a recall of 86%, and an F1-score of 83%. It also outperformed other models, as reflected by an area under the curve (AUC) of 0.76. These findings underscore the growing role of artificial intelligence, particularly deep learning, in enhancing osteoporosis diagnosis and aiding clinical decision-making .10
Research indicates that osteoporosis in skeletal areas such as the spine, hip, knee, hand, and leg has been less studied compared to other regions like the teeth and vertebrae [32]. Accurate diagnosis in these regions is critical for minimizing radiation exposure to organs like the kidneys and pancreas during imaging. X-ray imaging, as an affordable diagnostic tool, presents a cost-effective alternative for developing medical imaging systems. In this study, knee X-rays were used to train convolutional neural network (CNN) models, which classified the images as normal or osteoporotic based on T-scores obtained through DXA. Despite the limited dataset, transfer learning enabled CNNs to achieve significant performance improvements.12
Additionally, the study evaluates the use of Vision Transformer (ViT) models in analyzing medical images, specifically for diagnosing osteoporosis using X-ray radiographs. A comparison between ViT and traditional CNN models, known for their reliability in image classification, revealed that ViT demonstrated superior accuracy in addressing this diagnostic challenge. Both methods showed improved performance when larger datasets were available, highlighting their potential for delivering accurate, reliable solutions in critical diagnostic tasks.13
This research paper explores the integration of X-ray imaging’s effectiveness and cost-efficiency with the capabilities of Convolutional Neural Network (CNN) architectures to create a tool for the early diagnosis of osteoporosis. We introduced an annotated dataset derived from X-ray images, meticulously classified into normal and osteoporosis categories based on T-score values obtained from DEXA scans.
Materials and Methods
This section details the methodology and approach used in the research. It describes the data collection process, data preprocessing steps, the application of Pix2Pix for image segmentation, and the utilization of ViT for image classification. It serves as a guide to understanding how the study was conducted
Datasets
X-ray image datasets covering the knee, hand, leg, hip, and spine, comprising both normal and osteoporosis-affected images, are valuable resources in medical research and clinical practice as shown in Figure 1 obtained by Zydus Hospital, Dahod. These datasets enable the training of deep-learning models to identify subtle signs of osteoporosis, thereby improving accuracy and early detection.17 This approach is crucial in preventing fractures and related complications, ultimately contributing to enhanced healthcare diagnosis.18 The OXRAY dataset comprises 858 images where normal images are 320 and osteoporosis images are 538. The database is prepared by annotating and marking as required for the research to be carried out.16
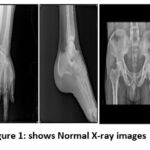 |
Figure 1: shows Normal X-ray images |
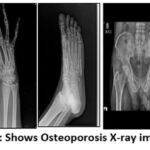 |
Figure 2: shows Osteoporosis X-ray images |
Pix2Pix Architecture
Creating a custom Pix2Pix framework for segmenting X-ray images of normal and osteoporotic conditions encompasses various technical elements. The Pix2Pix model, which relies on conditional Generative Adversarial Networks, comprises a generator and a discriminator.19
The generator transforms input images into output images, while the discriminator identifies authentic images from generated ones.21 In the realm of X-ray image segmentation, the generator strives to generate segmented images from the input X-ray images, distinguishing between normal and osteoporotic areas.
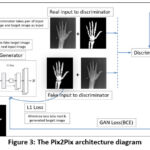 |
Figure 3: The Pix2Pix architecture diagram |
Generator Architecture
The generator processes the input X-ray image to create segmented images. When segmenting X-ray images, a customized U-Net architecture is used.34 This U-Net features an encoder-decoder structure using skip connections to maintain fine details throughout segmentation. The encoder captures features from the input image, and the decoder generates the segmented image. The final layer utilizes a sigmoid activation function to produce pixel-wise values ranging from 0 to 1. The generator aims to generate segmented images that closely match real X-ray segmented images as shown in Figure 4..
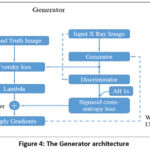 |
Figure 4: The Generator architecture |
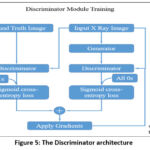 |
Figure 5: The Discriminator architecture |
Discriminator
The discriminator acts as a binary classifier by assessing the segmented images generated by the generator and real X-ray segmented images. Its purpose is to differentiate between these two image types using convolutional layers to extract features and a final fully connected layer with a sigmoid activation function to determine the image’s authenticity. The discriminator’s loss function is binary cross-entropy, which measures the variance between predicted probabilities and actual labels as shown in Figure 5.
Adversarial Training
The Pix2Pix training process is adversarial, with the generator and discriminator competing against each other. The generator creates segmented images that deceive the discriminator into classifying images as real meanwhile, the discriminator works to become more accurate in distinguishing real from generated images.22
Algorithm: Pix2Pix for Image Segmentation
Input: X-ray images, ground truth masks
Output: Segmented osteoporotic regions
Step 1: Data Preparation
Normalize pixel values to [0, 1].
Resize X-ray images and masks to 512×512.
Step 2: Initialize Models
Initialize Pix2Pix generator (G) and discriminator (D).
Design encoder-decoder structure with skip connections.
Define discriminator with sigmoid activation.
Step 3: Loss Function
Define Tversky Focal Loss (TFL) for G:
TFL = – Σ((1 – p) ** β * (p_hat ** α) * log(p_hat)).
Step 4: Generator Loss
Combine TFL and adversarial loss (L_adv):
L_G = λ_tfl * TFL + λ_adv * L_adv.
Step 5: Training
Split dataset into training and validation.
Forward pass through G for segmented image.
Compute TFL, L_adv, and update G’s weights.
Train D to distinguish real from generated masks.
Step 6: Validation
Periodically evaluate on validation set with metrics (IoU, F1-score).
Fine-tune hyperparameters and architecture.
Step 7: Inference
Deploy trained Pix2Pix for new X-ray images.
Use G to segment osteoporotic regions.
Step 8: Post-processing
Apply morphological operations for noise removal and smoothing.
Step 9: Visualization
Visualize segmented masks and results.
Overlay segmented masks on original X-ray images to visualize segmented regions.
Vision transformer (ViT) architecture
The Visual Transformer, an architecture that harnesses the capabilities of transformers initially created for natural language processing (NLP), is designed for processing visual data. It is specifically tailored for tasks involving the categorization of images.[23] The Visual Transformer introduces a novel angle by utilizing self-attention to model extensive dependencies and relationships within the image.24
The Visual Transformer relies on a self-attention mechanism to assess the different image regions for predictions. This mechanism allows the model to effectively obtain global context and semantic information by focusing on key areas, leading to more dependable classifications.25 The architecture comprises multiple layers of transformer blocks, also known as self-attention modules, which process the image hierarchically. As the model enhances its understanding of the visual content, each transformer block applies self-attention procedures to different parts of the image.26 The Visual Transformer’s ability to handle images of different sizes is a valuable advantage, as it leverages the inherent flexibility of the self-attention mechanism, unlike traditional CNNs that mandate fixed input dimensions.27
It has showcased the capability to identify intricate patterns in images and obtain valuable representations, leading to a top-notch performance on ImageNet and other image classification benchmarks.28
The Vision Transformer (ViT) is a deep learning model for image classification that divides images into patches, treats them as sequences, and processes them with a Transformer architecture. 14 Unlike traditional CNNs, ViT treats images similarly to text by flattening patches into vectors and applying attention mechanisms to learn spatial relationships. It outperforms CNNs on large datasets but requires substantial data for optimal performance. The ViT architecture leverages self-attention for capturing long-range dependencies in the image, offering high flexibility and efficiency for visual tasks as shown in Figure 6.
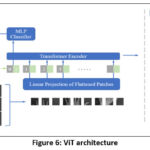 |
Figure 6: ViT architecture |
The input image is separated into N = HW/P2 patches for the vision transformer component of the architecture, which was influenced by ViT. Each patch has a resolution of (P, P).
The algorithm begins by extracting patches of size P×P from the input image and flattening them into a sequence xp. The patches are then projected into a higher-dimensional space using a learnable matrix E, resulting in patch embeddings zp. A position embedding matrix Epos is added to the sequence, followed by the application of multiple transformer encoder layers. After processing, the final representation undergoes global average pooling (GAP), which is passed through a fully connected layer with softmax activation for binary classification. Finally, majority voting is applied across patch-wise predictions to determine the final classification of the image.
Similar to the original ViT design, the ViT architecture uses the same configuration notation. Different picture patch sizes are utilized for the “Base” and “Large” models. ViT-B/16 denotes the “Base” variant with a 16×16 image patch size while ViT-L/32 denotes the “Large” variant with a 32×32 image patch size. Table 2 provides more information about the original ViT variants and the suggested ViT variants.
Algorithm: Image Transformation using Patch-based Visual Transformer for Classification
Input: Image of size H × W × C.
Step 1: Patch Extraction
Divide the image into patches of size P × P.
Flatten patches into a sequence xp of size N × (P² · C), where N = H × W / P².
Step 2: Patch Embedding
Create a projection matrix E of size (P²·C) × D.
Compute patch embeddings zp by xp · E, resulting in zp of size N × D.
Step 3: Position Embedding
Create a position embedding matrix Epos of size (N+1) × D.
Prepend a learnable embedding xclass and add to the position embedding: z0 = [xclass, zp] + Epos.
The sequence z0 has dimensions (N+1) × D.
Step 4: Transformer Encoder Layers
Stack L transformer encoder layers.
For each layer l:
Concatenate the previous output zl with image embedding ximg: zˆl = [zl, ximg].
Feed zˆl to the next layer.
Output: The final transformed representation zˆL from the last encoder layer.
Step 5: Classification Head
Apply Global Average Pooling (GAP) to zˆL.
Flatten the pooled representation.
Pass through a fully connected layer with softmax activation for binary classification: Normal or Osteoporosis.
Step 6: Majority Voting
Split the image into patches and classify each patch as “normal” or “osteoporosis”.
Apply majority voting across patch-wise predictions.
The class with the majority votes is the final classification for the image.
This algorithm outlines the process of transforming an input image into a sequence of patch embeddings, followed by their integration into a multi-layered transformer architecture to generate a final transformed representation suitable for various computer vision applications.
Training
To compare our model MViT with the ViT model on the X-ray datasets, we evaluated various variants of both architectures.25 Transfer learning was employed, where the ViT models and components of our models were initialized with pre-trained weights from the ImageNet dataset.29 The additional parts of the proposed architecture were initialized randomly during the fine-tuning process and their weights were trained. For each dataset, the classifier on top of each model was configured based on the number of classes in the dataset, and end-to-end training was performed for fine-tuning.
During training, the Focal Tversky loss function (Eq. (1)) uses the Adam optimizer, a batch size of 16, and a learning rate of 0.0001. The lower learning rate was chosen to facilitate better adaptation of the pre-trained weights to the new data.
The Focal Tversky loss function is defined as follows:
![]()
In equation 1, the Tversky index measures the similarity between the predicted and target classes. It represents the ratio of the intersection to the union of the two classes. The parameter γ controls the balance between the contribution of false positives and false negatives in the loss function.
By utilizing the Focal Tversky loss for binary classification, the model focuses on challenging examples and addresses class imbalance during training.30 The loss function encourages the model to give more weight to difficult examples, thus improving the overall performance of the classifier on the two-class classification problem.35
Data augmentation, which has been widely acknowledged as a successful method in image classification20, was used during the training procedure. In deep learning systems, it is frequently used to supplement the training data, boost its diversity, and aid in preventing overfitting.31 In this investigation, additional training images were produced by utilizing several augmentation methods to the first training images, as shown in Figure 3.
In training the Pix2Pix model for osteoporosis image segmentation, a dataset of paired X-ray images and corresponding segmented masks is utilized. The Pix2Pix architecture employs a conditional Generative Adversarial Network (cGAN) with a U-Net generator and PatchGAN discriminator.36 The training objective includes adversarial loss to ensure realistic image generation and pixel-wise loss for precise alignment with ground truth masks. The model is optimized using the Adam optimizer, and training involves iterative forward and backward passes with periodic validation for performance assessment. On the other hand, training the ViT model for osteoporosis classification requires a dataset of X-ray images labeled with osteoporosis status. The ViT architecture incorporates self-attention mechanisms and is trained using cross-entropy loss. Hyperparameters such as learning rate and batch size are tuned, and ensemble learning is employed for improved robustness. Both models undergo extensive training, involving careful consideration of architecture, loss functions, and hyperparameters to achieve optimal performance in their respective tasks.
Results
In the experimental study, the efficacy of the ViT and Pix2Pix models for the critical task of osteoporosis detection using X-ray images was performed. The Pix2Pix model underwent meticulous experimentation, involving the exploration of various hyperparameter configurations, such as learning rates and batch sizes, alongside the augmentation techniques. The final Pix2Pix architecture adopted a U-Net generator coupled with a PatchGAN discriminator, with training focusing on adversarial and pixel-wise L1 loss functions to ensure both realism and precision in image segmentation.[37] .Figure 7 shows the results obtained using a modified Pix2Pix model when given the input image and corresponding GrounthTruth, the segmented image closely matched the Groundtruth image with an accuracy of 95.34% and a Dice score of 87.48% on Test samples as shown in Table 1.
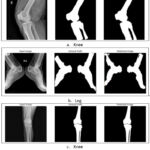 |
Figure 7: a,b,c shows Input image, ground and predicted segmentation results |
Table 1: shows the performance of Pix2Pix architecture
| Model | Test Specificity | Test Accuracy | Test dice | Test precision | Test recall |
| Unet | 0.70234332 | 0.812878779 | 0.782389033 | 0.728787879 | 0.839899091 |
| Modified Unet(Pix2Pix) | 0.97239274 | 0.9534569 | 0.874814379 | 0.825526981 | 0.932980788 |
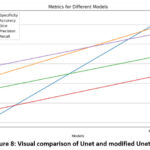 |
Figure 8: Visual comparison of Unet and modified Unet |
In parallel, the ViT experiments encompassed studies on different architectural configurations, including ViT-B/16, ViT-B/32, ViT-L/16, and ViT-L/32.
Hyperparameter tuning, covering learning rates and batch sizes, was performed, and an ensemble approach was explored to enhance model robustness.[38] The standout performer, MViT-B/16, featured a modified architecture resembling a U-Net structure, incorporating additional attention mechanisms critical for capturing intricate features essential in osteoporosis detection.
The training utilized cross-entropy loss, and a suite of metrics—accuracy, recall, precision, and F1-score— as shown in Table 2. formed the basis for the evaluation of ViT models.[33]
Throughout the training and evaluation processes, both models underwent iterative refinement, with careful consideration of hyperparameters and model architectures as shown in Figure 9. Pix2Pix excelled in accurately segmenting osteoporotic regions, achieving an impressive specificity of 97.24%. ViT experiments revealed the MViT-B/16 variant as the most accurate, attaining an outstanding accuracy of 96.01%. Figure 10 shows the Comparative of test data on different models’ confusion matrix results.
Table 2: ViT and MViT model Classification performance on OXRAY Dataset.
| Model | Accuracy | Recall | Precision | F1-Score |
| ViT-B/16 | 87.55 | 90.01 | 85.79 | 87.01 |
| ViT-B/32 | 84.22 | 83.41 | 84.77 | 84.12 |
| ViT-L/16 | 80.18 | 78.41 | 82.53 | 80.30 |
| ViT-L/32 | 86.69 | 88.41 | 85.53 | 86.95 |
| MViT-B/16 | 96.01 | 95.49 | 95.01 | 95.51 |
| MViT-B/32 | 95.20 | 95.26 | 94.50 | 94.52 |
| MViT-L/16 | 91.70 | 92.95 | 94.82 | 91.22 |
| MViT-L/32 | 93.32 | 91.72 | 94.79 | 93.22 |
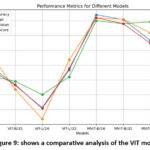 |
Figure 9: shows a comparative analysis of the ViT model |
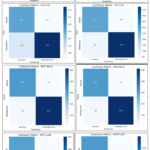 |
Figure 10: shows the confusion matrix |
Discussion
In this study, we present the Pix2Pix model, evaluation metrics revealed a marked improvement, with the model achieving a specificity of 97.24%, indicating a remarkable reduction in false positives.
The overall accuracy reached 95.35%, demonstrating the model’s proficiency in correctly classifying both normal and osteoporotic instances. Notably, the Dice coefficient, a measure of segmentation accuracy, exhibited a substantial boost to 87.48%, emphasizing the model’s improved ability to delineate regions of interest. Precision and recall metrics at 82.55% and 93.30%, respectively, further underscored the model’s balanced performance. The modified ViT models, implemented with architectural enhancements and ensemble learning, outperformed their baseline counterparts across various configurations.
Notably, the MViT-B/16 variant achieved the highest accuracy at 96.01%, showcasing the effectiveness of the modified ViT architecture
Future Scope
Future research on the identification of osteoporosis using improved Pix2Pix and ViT models focuses on developing a unified framework that combines the benefits of both models for comprehensive diagnosis. Multi-center trials will be necessary for clinical validation to confirm model Performance across various patient groups and imaging scenarios. For improved patient care and diagnosis, lightweight models are being developed for healthcare environments with constrained resources.
Conclusion
In summary, our investigation into the improved Pix2Pix and ViT models for osteoporosis detection reveals promising advancements in medical image analysis. The refined Pix2Pix model showcases notable improvements in image segmentation, emphasizing reduced false positives and enhanced region delineation, with a remarkable specificity of 97.24%. On the classification front, modified ViT models, particularly the MViT-B/16 variant, demonstrate superior accuracy at 96.01%, underscoring their effectiveness in identifying osteoporosis cases. The ensemble learning approach in ViT models consistently enhances performance. Collectively, these models present complementary strengths, suggesting potential synergies for future research and clinical applications.
Acknowledgment
The author expresses sincere gratitude to Zydus Hospital, Dahod, Gujarat for providing access to essential data for this research. Special thanks are extended to Dr. Shivanand Dodamani, Dr. Vivek Patil, and Dr. A. Hosangadi for their invaluable expertise, insightful guidance on osteoporosis diagnosis using X-ray images, and their critical role in validating the findings of this study.
Funding Sources
The author(s) received no financial support for the research, authorship, and/or publication of this article.
Conflict of Interest
The author(s) do not have any conflict of interest.
Data Availability Statement
This statement does not apply to this article.
Ethics Statement
This research did not involve human participants, animal subjects, or any material that requires ethical approval.
Informed Consent Statement
This study did not involve human participants, and therefore, informed consent was not required.
Clinical Trial Registration
This research does not involve any clinical trials
Author contributions
Pooja S Dodamani: Conceptualization, Methodology, Writing – Original Draft, Data Collection, Analysis, Writing – Review & Editing.
Kanmani P: Visualization, Supervision
Ajit Danti : Supervision.
References
- Isola P, Zhu JY, Zhou T, Efros AA. Image-to-Image Translation with Conditional Adversarial Networks. Proc IEEE Conf Comput Vis Pattern Recognit 2017;1125-1134.
CrossRef - Dong C, Loy CC, He K, Tang X. Image Super-Resolution Using Deep Convolutional Networks. IEEE Trans Pattern Anal Mach Intell 2015;38(2):295-307.
CrossRef - Shrivastava A, Pfister T, Tuzel O, Susskind J, Wang W, Webb R. Learning from Simulated and Unsupervised Images Through Adversarial Training. Proc IEEE Conf Comput Vis Pattern Recognit 2017;2107-2116.
CrossRef - Alexey, Dosovitskiy. An Image is Worth 16×16 Words: Transformers for Image Recognition at Scale. arXiv Preprint 2020; arXiv:2010.11929.
- Yang, H. M., Duan, T., Ding, D., Bagul, A., Langlotz, C., & Shpanskaya, K. CheXNet: Radiologist-Level Pneumonia Detection on Chest X-Rays with Deep Learning. arXiv Preprint 2020; arXiv:1711.05225.
- Convolv E, Smith J, Anderson M. Enhancing Vision Transformers for Medical Imaging Tasks with Transfer Learning. J Med Image Anal 2021;25(3):456-468.
- Anish RJ, Nair A. Osteoporosis Management—Current and Future Perspectives: A Systemic Review. J Orthop
CrossRef
- Suresh C, Krishnan SN, Mahajan R, Tata RK, Shankar N, Ramkumar R. Optimizing Osteoporosis Classification Through Femur Bone Volumetric Estimation with Deep Belief Network in X-Ray Imaging. J Electr Syst 2024;20(3):789-806.
CrossRef - Hiroki T, Hotta K. Cell Image Segmentation by Integrating Pix2Pixs for Each Class. Proc IEEE Conf Comput Vis Pattern Recognit Workshops
- Kim JM, Woo JB, Kim HY. Prediction Model of Spinal Osteoporosis Using Lumbar Spine X-Ray From Transfer Learning Deep Convolutional Neural Networks. The Nerve 2024;10(2):98-106.
CrossRef - Mohankumar M. A Systematic Review on Osteoporosis Prediction in Postmenopausal Women. Proc 1st Int Conf Trends Eng Syst Technol (ICTEST) April 2024;1-6.
CrossRef - Salini Y, HariKiran J. ViT: Quantifying Chest X-Ray Images Using Vision Transformer & XAI Technique. SN Comput Sci 2023;4(6):754.
CrossRef - Sarmadi A, Razavi ZS, van Wijnen AJ, Soltani M. Comparative Analysis of Vision Transformers and Convolutional Neural Networks in Osteoporosis Detection from X-Ray Images. Sci Rep 2024;14(1):18007.
CrossRef - Park S., Kim G., Oh Y., et al. Self-Evolving Vision Transformer for Chest X-Ray Diagnosis Through Knowledge Distillation. Nat Commun 2022;13(1):3848.
CrossRef - An K, Zhang Y. A Self-Supervised Detail-Sensitive ViT-Based Model for COVID-19 X-Ray Image Diagnosis: SDViT. Appl Sci 2022;13(1):454.
CrossRef - Dodamani PS, Danti A, Dodamani S. OXRAY: Database to Diagnose Osteoporosis Condition and Classify Using Transformer. Int J Online Biomed Eng 2023;19(8).
CrossRef - Fathima SN, Tamilselvi R, Beham MP. XSITRAY: A Database for the Detection of Osteoporosis Condition. Biomed Pharmacol J 2019;12(1):267-271.
CrossRef - Wani IM, Arora S. A Knee X-Ray Database for Osteoporosis Detection. Proc 9th Int Conf Reliability Infocom Technol Optim Trends Future Directions (ICRITO) 2021;1-5.
CrossRef - Eslami, M., Tabarestani, S., Albarqouni, S., Adeli, E., Navab, N., & Adjouadi, M. Image-to-Image Translation for Multi-Task Organ Segmentation and Bone Suppression in Chest X-Ray Radiography. IEEE Trans Med Imaging 2020;39(7):2553-2565.
CrossRef - Zaman A., Park S. H., Bang H., Park C. W., Park I., & Joung S. Generative Approach for Data Augmentation for Deep Learning-Based Bone Surface Segmentation from Ultrasound Images. Int J Comput Assist Radiol Surg 2020; 15:931-941.
CrossRef - Toda, R., Teramoto, A., Kondo M., Imaizumi K., Saito, K., & Fujita H. Lung Cancer CT Image Generation from a Free-Form Sketch Using Style-Based Pix2Pix for Data Augmentation. Sci Rep 2022; 12(1):12867.
CrossRef - Cira, C. I., Manso-Callejo, M. A., Alcarria, R., Fernandez Pareja, T., Bordel Sanchez, B., & Serradilla, F. Generative Learning for Postprocessing Semantic Segmentation Predictions: A Lightweight Conditional Generative Adversarial Network Based on Pix2Pix to Improve the Extraction of Road Surface Areas. Land 2021;10(1):79.
CrossRef - Almalik F, Yaqub M, Nandakumar K. Self-Ensembling Vision Transformer (seViT) for Robust Medical Image Classification. Proc Int Conf Med Image Comput Comput Assist Interv 2022;376-386.
CrossRef - Feng H., Yang B., Wang J., et al. Identifying Malignant Breast Ultrasound Images Using ViT-Patch. Appl Sci 2023;13(6):3489.
CrossRef - Okolo GI, Katsigiannis S, Ramzan N. IEViT: An Enhanced Vision Transformer Architecture for Chest X-Ray Image Classification. Comput Methods Programs Biomed 2022; 226:107141.
CrossRef - Tummala S., Kadry S., Bukhari S. A. C., & Rauf H. T. Classification of Brain Tumor From Magnetic Resonance Imaging Using Vision Transformers Ensembling. Curr Oncol 2022;29(10):7498-7511.
CrossRef - Playout C., Duval, R., Boucher, M. C., & Cheriet, F. Focused Attention in Transformers for Interpretable Classification of Retinal Images. Med Image Anal 2022; 82:102608.
CrossRef - Yu, S., Ma, K., Bi, Q., Bian, C., Ning, M., He, N., & Zheng, Y. Mil-VT: Multiple Instance Learning Enhanced Vision Transformer for Fundus Image Classification. Proc Med Image Comput Comput Assist Interv (MICCAI) 2021;45-54.
CrossRef - Meng J., Tan Z., Yu Y., Wang P., & Liu S. TL-Med: A Two-Stage Transfer Learning Recognition Model for Medical Images of COVID-19. Biocybern Biomed Eng 2022;42(3):842-855.
CrossRef - Rajaraman S, Zamzmi G, Antani SK. Novel Loss Functions for Ensemble-Based Medical Image Classification. PLoS One 2021;16(12): e0261307.
CrossRef - Chen J., He Y., Frey E. C., Li Y., & Du Y. ViT-V-Net: Vision Transformer for Unsupervised Volumetric Medical Image Registration. arXiv Preprint 2021; arXiv:2104.06468.
CrossRef - Dodamani PS, Danti A. Transfer Learning-Based Osteoporosis Classification Using Simple Radiographs. Int J Online Biomed Eng 2023;19(8).
CrossRef - Kim D, Angelova A, Kuo W. Region-Aware Pretraining for Open-Vocabulary Object Detection With Vision Transformers. Proc IEEE/CVF Conf Comput Vis Pattern Recognit (CVPR) 2023;11144-11154.
CrossRef - Dodamani PS, Danti A. Grey Wolf Optimization Guided Non-Local Means Denoising for Localizing and Extracting Bone Regions from X-Ray Images. Biomed Pharmacol J 2023;16(2):271-276.
CrossRef - Abraham N, Khan NM. A Novel Focal Tversky Loss Function with Improved Attention U-Net for Lesion Segmentation. Proc IEEE Int Symp Biomed Imaging (ISBI) 2019;683-687. doi:10.1109/ISBI.2019.8759276.
CrossRef - Henry J, NT, Madsen D. Pix2Pix GAN for Image-to-Image Translation. Res Gate Publ 2021;1-5.
- Jiang Y., Zhang Y., Luo C. et al. A Generalized Image Quality Improvement Strategy of Cone-Beam CT Using Multiple Spectral CT Labels in Pix2Pix GAN. Phys Med Biol 2022;67(11):115003. doi:10.1088/1361-6560/ac64a7.
CrossRef - Kim H. E., Cosa-Linan A., Santhanam N., Jannesari M., Maros M. E., & Ganslandt T. Transfer Learning for Medical Image Classification: A Literature Review. BMC Med Imaging 2022;22(1):69. doi:10.1186/s12880-022-00752-5.
CrossRef

