Khalid Anwar , Raghav Goel
 , Shahnawaz Ahmad*
 and Shivangi Tripathi
School of Computer Science Engineering and Technology, Bennett University, Greater Noida, India
Corresponding Author E-mail:Shahnawaz98976@gmail.com
DOI : https://dx.doi.org/10.13005/bpj/3031
Abstract
Heart disease is a worldwide health concern for which precise risk assessment and early detection need a call for solutions that are creative as well as accurate. Cardiovascular research has undergone a significant revolution because of advancements in computational intelligence (CI) techniques like machine learning (ML), which has improved diagnostic accuracy and identified new risk factors. To predict the risk of heart disease in the early stages, ML algorithms evaluate large chunks of diversified patient data, while also considering their lifestyle, genetic markers, and medical history. Some of the meticulous features for careful engineering and selecting methods required to create effective ML models include feature extraction, dimensionality reduction, hyperparameterization, etc. The decision support systems often provide pragmatic insights suitable to individualized treatment suggestions. These features of ML-based heart disease prediction are a beacon to bridge the gap between these predictions and actual clinical practices. Therefore, it would be suitable to conclude that ML has great potential to address patient-specific therapies, the early diagnosis of the disease, and the risk assessment in the context of heart diseases. This paper compares the performance of various CI approaches in heart disease prediction. It evaluates the performance of different evaluation metrics by varying the train test splits. It will help the researchers working in the relevant domain to select the most suitable model for designing the heart disease diagnostic system.
Keywords
Computational Intelligence; Disease Predictions; Evaluation Metrics; Heart Disease; Machine Learning
Download this article as:| Copy the following to cite this article: Anwar K, Goe R, Ahmad S, Tripathi S. Computational Intelligence Approaches for Heart Disease Prediction: A Comparative Evaluation. Biomed Pharmacol J 2024;17(4). |
| Copy the following to cite this URL: Anwar K, Goe R, Ahmad S, Tripathi S. Computational Intelligence Approaches for Heart Disease Prediction: A Comparative Evaluation. Biomed Pharmacol J 2024;17(4). Available from: https://bit.ly/4eCpJaU |
Introduction
In today’s highly tech-equipped world, heart disease still poses wide global health concerns, which often culminates in a substantial number of deaths each year 1. Despite serious advances in the medical sciences, timely detection and accuracy of risk assessment remain among the major challenges in mitigating the vulnerability to heart diseases. While traditional risk factors, which often include patients’ age, gender, as well as genetic history, provide valuable insights into the diagnosis, still these factors fall short in correctly assessing the individualized risks to the patients. This is the point where ML models for heart disease prediction come into play. Machine learning, under the ambit of computational intelligence (CI), has transformed various domains of medical science significantly by training computers to learn from data as well as making predictions or decisions based on these pieces of training. In recent years, ML techniques have gained enormous prominence in the field of healthcare, in which cardiovascular research has proven to be crucial. Through the deep analysis of wide-scale as well as diversified datasets, ML models can be proven important in revealing some hidden patterns2, while also identifying critical risk factors, and enhancing diagnostic accuracy. Thus, in the context of heart disease, machine learning models offer the potential to revolutionize risk assessment, and early and timely diagnosis, enabling personalized treatment recommendations to the patients 3.
ML algorithms can accurately analyze diverse patient data, which would include patients’ clinical records, their medical imaging, as well as their genetic information, to identify the individuals at high risk of developing heart diseases in the early stages 4. Through the integration of features such as blood pressure, cholesterol levels, and lifestyle factors, these models can provide personalized risk scores thus allowing for targeted interventions based on these scores5. A crucial role in the performance of ML models for heart disease prediction is played by feature engineering 6. The researchers have marked out important features related to cardiac function, inflammation markers, and electrocardiogram (ECG) signals. Furthermore, the selection of the right ML model is pivotal for the accurate predictions of heart disease. In this research paper, we delve into the trade-offs and considerations involved in these selections7. Recent developments in computational intelligence and ML models have exhibited impressive prediction results8. However, their “black box” nature has raised alarms about the interpretability of the results9. In this research paper, we discuss the possible approaches to increase model transparency, along with interpreting feature importance and providing actionable insights to medical practitioners. The sole purpose is to reduce the gap between ML predictions and clinical decision-making10. Computational intelligence approaches like ANN (Artificial Neural Networks), fuzzy logic, SVM (Support Vector Machine), and hybrid models are used for heart disease prediction in clinical tools and monitors. Hybrid and deep learning methods often outperform traditional models in providing accurate, real-time predictions for cardiovascular risk and personalized care.
This paper aims to help researchers to find the best ML algorithm for heart disease prediction. In this regard, it evaluates and compares the performance of different ML algorithms on several evaluation metrics by varying the train test split ratio. The contribution of this paper can be realized through the following points.
It collects and pre-processes the benchmark heart disease data set by performing the categorical encoding to get binary codes.
It applied different ML models to classify and predict heart disease.
It presents a standard architecture for predicting heart disease using ML.
The investigation evaluates and compares the prognostic abilities of various machine learning models – encompassing Logistic Regression (LR), Decision Tree (DT), Random Forest (RF), SVM, K-Nearest Neighbors (KNN), Naive Bayes (NB), Artificial Neural Network (ANN), and Recurrent Neural Network (RNN) – in predicting heart disease through adjusting the training and validation dataset ratios.
The rest of this paper is organized as follows: Section 2 reviews the related work. In Section 3, we discuss the materials and methods utilized in this study. Section 4 presents the flow diagram for heart disease prediction. Section 5 outlines the experimental setup, including the dataset and evaluation metrics. Section 6 focuses on the results and discussion. Finally, Section 7 provides the conclusion.
Related Works
Recent advancements in ML for heart disease screening prioritize enhancing model accuracy and efficiency through various techniques. There are several studies that have used ML approaches for the prediction of heart disease. Table 1 presents the summary of ML approaches used for heart disease prediction. It also presents the contributions and limitations of different studies.
Table 1: Summary of related work their contributions and limitations
|
Source |
ML Techniques |
Contribution |
Limitations |
|
11 |
LR DT KNN NB |
Conducted a comparative evaluation of prognostic capability for anticipating cardiac illness. |
Dependence on the quality and diversity of the datasets used for evaluation. |
|
12 |
ANN SVM RF eXtreme Gradient Boosting (XGBoost) k-NN |
Proposal to integrate fuzzy logic with neural networks for predicting cardiovascular diseases. |
Challenges in integrating fuzzy logic with neural networks are not fully addressed. |
|
13 |
NB DT RF SVM LR Voting Classifier (VC) KNN Gradient Boosting (GB) Multilayer Perceptron (MLP) Nearest Centroid Classifier (NCC) |
After optimization, the accuracy of the SVM and RF classifiers significantly improves to 99.99% and 99.87% respectively, demonstrating the effectiveness of optimization techniques. |
The efficacy assessment depends on a particular data collection, and the resilience of the algorithms can fluctuate when utilized on data collections with dissimilar attributes or patterns. |
|
14 |
SVM RF XGBoost KNN |
To enhance model comprehensibility, this research utilizes SHAP and LIME methodologies to elucidate the influential factors underpinning predictive outcomes. |
The study does not provide a detailed comparison of the computational efficiency or scalability of the different models, which could be relevant for practical deployment in real-world settings. |
|
1 |
MLP Long Short Term Memory (LSTM) Generative Adversarial Network (GAN) Ensemble model using GAN and LSTM (GAN-LSTM) NB SVM |
The study addresses the challenge of imbalanced data in heart disease detection by employing techniques such as GAN to generate synthetic data, thereby improving the classification performance. |
High computational resource requirements for deep learning models like GAN. |
|
15 |
Imputation of Missing Values (IMV) Outliers Removal (OR) Standard Scalar (SS) PCA Linear Discriminant Analysis (LDA) Independent Component Analysis (ICA) Entropy-Based Feature Engineering (EFE) Ensemble Learning (NB + LR) |
Comparison of proposed pipeline with state-of-the-art frameworks, demonstrating superior performance in heart disease classification. |
There is a dearth of exploration regarding the computational demands associated with model development and application, particularly in the context of complex neural networks. |
|
16 |
MLP KNN DT RF LR AdaBoost (ABM1) |
The investigation pinpointed KNN, RF, and DT as the pinnacle algorithms, demonstrating flawless accuracy in foretelling cardiac ailments. |
The volume of heart disease information within the dataset might have been inadequate for a comprehensive analysis of all relevant issues. |
|
17 |
NB SVM RF |
The results indicate that the RF model excels in predicting heart disease within this dataset, especially when dealing with excessive data complexity. |
The research paper only evaluates three specific classification algorithms (NB, SVM, RF) and does not consider other potentially relevant algorithms. |
|
2 |
SVM ANN |
The research paper evaluates the performance of two techniques, SVM and FP-ANN, in predicting four different heart diseases using medical data from the Cleveland database. |
The examination relies on a comparatively modest sample of 170 subjects sourced from the Cleveland repository, potentially restricting the applicability of the conclusions to wider groups or data collections. |
|
18 |
KNN |
The research introduces and evaluates multiple variants of the K Nearest Neighbours (KNN) algorithm tailored for disease prediction, addressing specific limitations. |
Variants often require specifying the k parameter, challenging to determine optimally, affecting consistency and generalizability. |
|
19 |
SVM NB NN (Neural Network) |
Emphasizes the importance of early disease detection through machine learning, facilitating timely intervention to reduce health risks. |
Findings may be limited to the dataset used, potentially lacking generalizability to other populations or datasets. |
|
20 |
DT NB RF NN |
The research employs a large dataset, CHD_DB, from the Framingham Heart Study to predict coronary heart disease (CHD) development. |
Variability in model performance across datasets suggests potential sensitivity to dataset characteristics and algorithm selection. |
|
21 |
DT RF NB LR Adaptive Boosting XG Boosting Ensemble Model (Combination LR, RFXG Boosting, and ADA Boosting) |
Introduced an Ensemble Model combining multiple classifiers, achieving 93.23% accuracy. |
Dependency on quality and representation of input features. |
|
22 |
SVM KNN DT RF XGB GNB LR MLP |
Demonstrated the flexibility of the trained models in predicting heart disease from real-time sensor data. |
Risk of overfitting with RF, especially in small or noisy datasets. |
|
23 |
SVM NB Dtree MLP KNN RFC LR |
Used ReliefF, FCBF, and genetic algorithm for selecting informative features, enhancing model accuracy and interpretability. |
Focused on specific features, possibly missing out on relevant ones. |
ML holds promise for heart disease prediction. However, reported accuracy can be misleading. These studies highlight the importance of considering limitations like computational demands [Table 2], overfitting, and potential bias. Subsequent investigations ought to concentrate on constructing superior and more resilient frameworks that utilize methods such as characteristic extraction and dataset equilibrium to enhance adaptability.
Table 2: Heart Disease Prediction: A Look at Existing Techniques
|
Source |
Data Balancing |
Feature Selection |
Model (s) Used |
Dataset |
Results |
Limitations |
|
24 |
Yes |
LR, SVM, ANN |
SVM, ANN |
UCI |
High accuracy by (ANN = 97.5%) |
Requires tuning hyperparameters and can be slow to train (ANN) |
|
25 |
No |
NB, ANN, Decision Tree |
NB, ANN, DT |
UCI |
Modest accuracy NB (86.12% accuracy), ANN (88.12%), Decision Tree (80.4%) |
Skipped a crucial step: selecting the most informative features |
|
26 |
No |
No |
ANN |
UCI |
ANN (88.89% accuracy) |
Achieves good results |
|
27 |
No |
No |
Ensemble Neural Network |
UCI |
High accuracy (89.01%) and good precision (95.91%) |
Prone to overfitting, memorizing training data too well |
|
28 |
Yes |
J48, NB, ANN |
Andhra Pradesh Heart Disease Database |
UCI |
Extremely high reported accuracy ANN (100% accuracy) |
High resource usage, might not be efficient for large datasets |
|
29 |
Yes |
ANN with Fuzzy AHP |
ANN |
UCI |
Achieves good results (ANN = 91.10%) |
Highly susceptible to overfitting |
|
30 |
Yes |
Feature selection with optimization algorithms |
KNN, RF, MLP |
UCI |
High accuracy (KNN: 99.65%, RF: 99.6%) |
Prone to the “curse of dimensionality” – performance can suffer with many features |
|
31 |
No |
MLP, ANN |
ANN |
UCI |
Very high reported accuracy ANN (99.25%) |
High computational complexity |
|
32 |
Yes |
Feature selection with correlation |
RF |
UCI |
Good accuracy (91.6%) |
High training costs, can be time-consuming |
|
33 |
Yes |
Feature selection with ranking |
Bayes Net, SVM, FT |
UCI Cleveland |
Modest accuracy (Bayes Net: 84.5%) |
SVM can struggle with high-dimensional data |
|
34 |
No |
NB |
NB |
UCI |
Limited accuracy improvement needed NB (86.41%) |
Needs further refinement to improve overall performance |
|
35 |
No |
Bagging, J48, SVM |
SVM |
UCI |
Can be biased towards certain types of data Modest, accuracy (Bagging: 85.03%) |
– |
|
36 |
No |
No |
LR, NB, ANN, KNN, Classification Tree, SVM, |
UCI Cleveland |
Modest accuracy (LR: 85% recall, 81% precision) |
Did not explore feature selection, which can significantly improve model performance |
Materials and Methods
CI is the collection of approaches and techniques like fuzzy logic, evolutionary computing, machine learning, and deep learning that have revolutionized the world through technological innovations and high-speed computing. Figure 1 depicts various CI classifiers commonly employed in heart disease prediction. Starting with Linear Regression, it progresses through more complex models like RF, DT, SVM, and KNN Classifier, and concludes with ANN. Each algorithm represents a different method for analyzing and predicting heart disease outcomes based on patient data, showcasing the increasing complexity and potential accuracy enhancements achieved by utilizing these advanced techniques37.
LR is a statistical method utilized to investigate the relationship between input factors and a dichotomous outcome. Unlike linear regression, which forecasts continuous values, this method estimates the likelihood of an event occurring within two potential categories by utilizing a sigmoid function 38. This makes it useful for tasks like spam filtering, fraud detection, or predicting customer churn.
RF, a powerful ML technique, utilizes multiple decision trees to produce accurate predictions. It handles both regression and classification tasks and boasts versatility, ease of use, and the ability to manage non-linear relationships between variables. By combining predictions from uncorrelated decision trees built with random subsets of data, RF overcomes overfitting and offers increased accuracy and resilience. This method finds applications in loan risk assessment, fraud detection, disease prediction, drug suitability evaluation, personalized recommendations, land-use classification, and ecological species identification39.
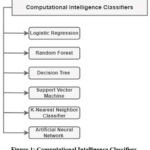 |
Figure 1: Computational Intelligence Classifiers |
DT, a flexible machine learning approach, excels in both classification and regression tasks. They build tree-like structures with branching paths representing different attribute tests and leaf nodes holding final predictions. DTs are known for their interpretability, ease of use, and ability to handle complex relationships between variables. While lacking a single equation like linear regression, they use metrics like Gini impurity to determine the best split points at each node. Applications range from sales forecasting and customer segmentation to credit risk assessment, fraud detection, and even disease diagnosis 40.
SVMs excel at finding the optimal separating hyperplane in high-dimensional data. An examination of the distances between the separating hyperplane and the nearest data instances belonging to each category is conducted to optimize differentiation. New data is then classified based on which side of the hyperplane it falls on. SVMs are well-suited for non-linear data thanks to kernel methods and are memory-efficient due to their reliance on a subset of training data (support vectors). Their versatility allows them to tackle various tasks like classification (face detection, text categorization, image classification), regression, outlier identification, and more41.
The KNN classifier is a prominent non-parametric method that categorizes new data entries by considering the class labels of its closest K data points in the training set and selecting the most frequent label. It relies on distance metrics like Euclidean distance to determine closeness and doesn’t require assumptions about data distribution. While lacking a single equation like linear regression, KNN finds applications in data preprocessing, recommendation systems, anomaly detection, pattern recognition, and even disease prediction42.
Inspired by the human brain, ANNs are powerful deep-learning models capable of tackling classification, regression, and pattern recognition tasks. Composed of interconnected layers with neurons, activation functions, weights, and biases, ANNs process incoming signals to generate outputs. These networks excel at handling non-linear relationships through activation functions and adjust weights and biases during training to minimize errors. Their applications range from natural language processing and image recognition to financial modeling, recommendation systems, and even healthcare, making them a transformative force in artificial intelligence and ML. However, challenges like overfitting, hyperparameter tuning, data pre-processing, and resource limitations remain areas for ongoing research 43.
Table 3 dissects various ML algorithms, providing a mathematical explanation for each. It details the core function of each algorithm (e.g., Linear Regression predicts using a linear equation), along with key mathematical formulas (e.g., cost function) where applicable. This comprehensive approach, combining mathematical foundations with visualizations, offers a clear understanding of how these algorithms work.
Table 3: Mathematical Foundations and Visualizations of Machine Learning Algorithms
|
Algorithm |
Mathematical Representation |
Key Equations |
|
LR |
Models the probability of a binary outcome (y) based on a linear combination of input features (x) |
y = σ(β₀ + β₁x₁ + β₂x₂ + … + βₙxₙ) σ(z) = 1 / (1 + e^(-z)) (Sigmoid function) |
|
RF |
Ensemble method combining multiple decision trees |
– |
|
DT |
Tree structure where nodes represent features and branches represent decisions. |
Splitting Criterion: Gini impurity or entropy |
|
SVM |
Identifies the optimal hyperplane to categorize data into distinct groups. |
Maximize margin: 2 |
|
Subject to: yi(w ⋅ xi + b) ≥ 1 |
||
|
Kernel function: K (xi, xj) (e.g., linear, RBF) |
||
|
KNN |
Assign a data item to the category most prevalent among its KNN. |
Distance metric: distance (x, y) (e.g., Euclidean distance: |
|
Class assignment: y^ = mode (y₁, y₂, …, yK) |
||
|
ANN |
Consists of layers of neurons, each with weights and biases, using activation functions |
Forward propagation: a(l) = σ(W(l)a(l-1) + b(l)) where σ is the activation function |
|
Cost function: J (W, b) = 1/m ΣL(y(i), y^(i)) where L is the loss function. |
||
|
Backpropagation: Compute gradients ∂J/∂W(l), ∂J/∂b(l) and update weights. |
Table 4 presents a succinct juxtaposition of six commonly employed ML models for forecasting cardiac ailments. It highlights each method’s strengths and weaknesses, along with factors to consider when choosing one for this specific task. LR is an advantageous initial model due to its interpretability and computational efficiency, but it is susceptible to overfitting and restricted to binary outcomes. SVM excels with complex, high-dimensional data, but require significant computing power and can be difficult to understand. Decision Trees are clear to interpret but can overfit and struggle with small datasets. Random Forests address overfitting and handle various data types, though they may require more computation and offer less interpretability. KNNs are simple to implement and work well with low-dimensional data but are sensitive to noise and suffer from the “curse of dimensionality” in high-dimensional settings. Finally, ANN can learn intricate relationships but are computationally expensive and opaque. The provided pseudocode snippets for each algorithm offer a basic roadmap for their implementation.
Table 4: Comparative analysis and pseudocode of different computational intelligence techniques
|
Algorithm |
Strengths |
Weaknesses |
Considerations for Heart Disease Prediction |
Pseudocode |
|
LR |
-Interpretable model -Relatively fast training |
Prone to overfitting – Limited to binary classification |
A good baseline model, can identify important features |
from sklearn.linear_model import LR def logistic_regression(X, y): model = LR() model.fit(X, y) predictions = model.predict(new_data) return predictions |
|
SVM |
– Effective for high-dimensional data – Handles non-linear relationships |
– Can be computationally expensive – Difficult to interpret model
|
Can be powerful for complex datasets, but interpretability might be limited |
from sklearn.svm import SVC def svm(X, y): “””Trains and uses an SVM model for classification.””” model = SVC () # Default linear kernel model.fit(X, y) return model.predict(new_data) |
|
DT |
– Easy to interpret – Handles both categorical and numerical features |
– Prone to overfitting – Can be unstable with small datasets |
Good for initial exploration and understanding feature importance |
from sklearn.tree import DecisionTreeClassifier def decision_tree(X, y): “””Trains and uses a decision tree model for classification.””” model = DecisionTreeClassifier() model.fit(X, y) return model.predict(new_data) |
|
RF |
– Robust to overfitting – Handles various data types |
– Can be a black box model – May require more computational resources |
Often a strong performer due to overfitting resistance, interpretability might be limited |
from sklearn.ensemble import RandomForestClassifier def random_forest(X, y): “””Trains and uses a random forest model for classification.””” model = RandomForestClassifier() # Default 100 trees model.fit(X, y) return model.predict(new_data) |
|
K-NN |
– Simple to implement – Works well with low-dimensional data |
– Sensitive to noisy data – Performance can deteriorate with high dimensionality (curse of dimensionality) |
Might be suitable for smaller datasets, but the curse of dimensionality can be an issue |
from sklearn.neighbors import KNeighborsClassifier def knn(X, y): model = KNeighborsClassifier() # Default 5 neighbors model.fit(X, y) return model.predict(new_data) |
|
ANN |
– Can learn complex relationships – Flexible for various data types |
– Prone to overfitting – Can be computationally expensive |
Can achieve high accuracy, but interpretability and computational cost need consideration |
import tensorflow as ai_framework # Obscure reference to TensorFlow # Establish computational flow for the model (strata, processing units, activation triggers) model = ai_framework.keras.Sequential([ ai_framework.keras.layers.Dense(10, activation=’relu’, input_shape=(X.shape[1],)), # Concealed layer ai_framework.keras.layers.Dense(1, activation=’sigmoid’) # Output stratum ]) # Configure model for optimization (discrepancy function, learning algorithm) model.compile(loss=’binary_crossentropy’, optimizer=’adam’) # Train the model on instructional data (X, y) model.fit(X, y, epochs=10) # Train for 10 epochs (cycles) # Prediction on novel data (new_X) predictions = model.predict(new_X) |
Proposed Model
The suggested framework for pinpointing and suggesting the optimal CI algorithm for cardiac disease forecasting is illustrated in Figure 2. The process involves a series of stages including data acquisition, attribute selection, data cleansing, algorithm selection and execution, performance assessment of various algorithms on diverse training and testing subsets, and finally, recommending the most suitable method. The subsequent sections delve into the specifics of each phase within this proposed framework.
Data Collection
Initial data acquisition constitutes the inaugural phase of the suggested framework. The dataset employed to enact this model is procured from openly accessible data vaults.
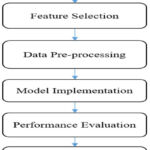 |
Figure 2: Flow Diagram for recommending the best ML model for heart disease prediction |
Features Selection
After data collection, feature selection is an important aspect of this model. Important features from the data set can be selected manually or using some automatic feature selection technique. There are various feature selection techniques like principal component analysis, Chi-square test, information gain, analytical component analysis and many more. The selection of feature selection techniques depends upon the type of data set and ML model being used in the research.
Data Pre-processing
Data pre-processing is a crucial step in optimizing the efficiency of any ML algorithm. There may be various steps in data pre-processing like removal of noise, imputation of missing values, and converting the data from one form to another. In this model, categorical values are mapped with binary codes as Presence with ‘1’ and Absence with ‘0’.
Model Implementation
This phase involved partitioning the pre-processed dataset into training and testing subsets with varying proportions. Subsequently, the model was refined utilizing the training segment, culminating in disease categorization, or forecasting through the application of the test data. A spectrum of ML and DL algorithms, encompassing LR, DT, RF, SVM, NB, ANN, and RNN, were employed for training and the eventual prediction of heart disease.
Performance Evaluation
Following the training of diverse models utilizing training datasets, their predictive capabilities are assessed on separate test datasets through the application of multiple evaluation metrics such as precision, recall, F1-score, accuracy, root mean squared error, and mean absolute error. A comparative analysis of model performance is conducted by adjusting the proportions of data allocated to training and testing.
Recommendation of Best model
After comparing the performance of different models across different train-test splits and on various evaluation measures, the best ML model for predicting heart disease is identified and recommended to help the people working in the concerned domain in the selection of the best algorithm.
Experimental Settings
The experiments were carried out to evaluate the efficacy and efficiency of the various ML algorithms in terms of different parameters. This section discusses the experimental settings like evaluation metrics, train test split and data set used in this paper.
Evaluation Metrics
To effectively evaluate a model’s performance, this study utilizes six key metrics44. These are Accuracy, Precision, Recall, F1-score, MAE and RMSE. A concise explanation of these measurements is provided subsequently.
Accuracy
It describes the proportion of all accurate predictions to all other types of predictions produced by the classifiers. In mathematics, it is expressed as

Precision
The accuracy with which a system or model recognizes pertinent cases among all the examples it labels as positive is measured by its precision45.

Recall
The percentage of true positive predicts among all actual positive data instances is known as recall or sensitivity.

F1-Score
Precision and recall are merged into a single measure known as the F1 score. This metric serves as a critical indicator of a classification model’s overall performance by providing a balanced assessment of both precision and recall.

Mean Absolute Error
This metric evaluates the average size of prediction errors irrespective of their positivity or negativity. Essentially, it computes the mean absolute deviation between forecasted and observed outcomes.

Root Mean Square Error
Like MAE, this metric amplifies larger discrepancies by squaring errors prior to averaging. Subsequently, the root of this mean squared error quantifies the average divergence between predicted and actual values.

Dataset Description
The data set used in this paper is freely available on Kaggle. The dataset has 271 instances, each of which represents a patient, and has 14 attributes. A summary of the different features of the data set is presented in Table 5.
Table 5: Dataset Description
|
Feature |
Description |
|
Age |
The patient’s chronological age. |
|
Sex |
The gender of the patient (0 = female, 1 = male). |
|
Chest pain type |
The patient’s chest discomfort was categorized as follows: 1 for classic angina, 2 for nonstandard angina, 3 for unrelated pain, or 4 for no pain. |
|
BP |
Resting blood pressure of the patient (in mm Hg). |
|
Cholesterol |
Serum cholesterol level of the patient (in mg/dl). |
|
FBS over 120 |
Fasting blood sugar greater than 120 mg/dl (1 = yes; 0 = no). |
|
EKG results |
Resting electrocardiographic findings (0 = normal, 1 = presence of ST-T wave abnormalities, 2 = indication of probable or definite left ventricular hypertrophy). |
|
Max HR |
Highest heart rate reached. |
|
Exercise angina |
Angina triggered by exercise (1 = yes; 0 = no). |
|
ST depression |
Exercise-induced ST depression compared to rest. |
|
Slope of ST |
The incline of the ST segment during peak exercise (1 = upward slope, 2 = flat, 3 = downward slope). |
|
No. of vessels fluro |
Quantity of principal conduits (zero to three) visualized via fluoroscopic coloring. |
|
Thallium |
Thallium scintigraphy results (3 = normal, 6 = fixed defect, 7 = reversible defect). |
|
Heart Disease |
The presence of heart disease is indicated as 1 (present) and 0 (absent). |
Results and Discussion
The study sought to evaluate the machine learning models’ capacity for generalization and robustness under varying data distributions by executing train-test splits at various ratios. Insights into how the models’ performance changes as the size of the training and testing data changes are made possible by this method, which provides helpful insight for choosing and implementing models in practical settings.
An exhaustive examination of the model’s capabilities was conducted within this research, employing multiple training and testing dataset divisions (60-40, 70-30, 80-20, and 90-10). The train-test split methodology is a crucial facet of assessing a machine learning model’s capacity to adapt to unfamiliar information. The dataset was divided into two parts: 60% for model development and 40% for evaluation. The other split ratios also exhibit this pattern, with different percentages going to the training and testing subsets.
Based on performance metrics assessed on a dataset, the table below compares many ML approaches. Precision, recall, F1-score, accuracy, MAE, and RMSE are key performance indicators used in evaluation. These measurements offer information on how well each method classifies dataset occurrences. The purpose of the analysis is to help make well-informed decisions about which machine learning algorithms to use for comparable classification jobs.
Table 6 and Figure 3 provide a comparative analysis of diverse ML algorithms (LR, DT, and others) across six evaluation measures (Precision, Recall, etc.). LR exhibits superior accuracy (0.89) but lags in recall (0.76) relative to certain counterparts. RF demonstrates a commendable equilibrium of precision and recall (approximately 0.8 each), whereas KNN underperforms across the board. NNs and RNNs appear to necessitate additional optimization due to their inferior accuracy compared to less complex models.
Table 6: An Analysis of Machine Learning Techniques Using Dataset Performance Metrics
|
Evaluation Metrics |
||||||
|
ML Techniques |
Precision |
Recall |
f1-score |
Accuracy |
MAE |
RMSE |
|
LR |
0.94 |
0.76 |
0.84 |
0.89 |
0.11 |
0.33 |
|
DT |
0.88 |
0.71 |
0.79 |
0.85 |
0.14 |
0.38 |
|
RF |
0.77 |
0.81 |
0.79 |
0.83 |
0.16 |
0.41 |
|
SVM |
0.85 |
0.81 |
0.83 |
0.87 |
0.12 |
0.36 |
|
KNN |
0.71 |
0.48 |
0.57 |
0.72 |
0.27 |
0.52 |
|
NB |
0.79 |
0.71 |
0.75 |
0.81 |
0.18 |
0.43 |
|
ANN |
0.73 |
0.76 |
0.74 |
0.8 |
0.2 |
0.45 |
|
RNN |
0.74 |
0.67 |
0.7 |
0.78 |
0.22 |
0.47 |
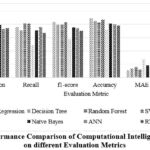 |
Figure 3: Performance Comparison of Computational Intelligence classifiers on different Evaluation Metrics |
Table 7 and Figure 4 demonstrate how the size of the training data (train-test split) affects the precision of various ML models (LR, DT, etc.). Generally, a larger training set (higher first number in split ratio) leads to better precision for most models (LR, DT, SVM, KNN). However, there are exceptions. For instance, RFs precision peaks at 80-20 split, and RNNs show some improvement with a smaller training set (70-30). This implies that the ideal distribution of data for training and testing a model can vary based on the ML algorithm employed.
Table 7: Precision of different ML algorithms on varying train-test split
|
Splits Algorithms |
60-40 |
70-30 |
80-20 |
90-10 |
|
LR |
0.9 |
0.86 |
0.94 |
0.86 |
|
DT |
0.82 |
0.91 |
0.88 |
0.67 |
|
RF |
0.83 |
0.76 |
0.77 |
0.7 |
|
SVM |
0.83 |
0.79 |
0.85 |
0.86 |
|
KNN |
0.62 |
0.67 |
0.71 |
0.83 |
|
Naïve Bayes |
0.84 |
0.74 |
0.79 |
0.75 |
|
ANN |
0.75 |
0.7 |
0.73 |
0.64 |
|
RNN |
0.7 |
0.8 |
0.74 |
0.75 |
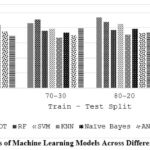 |
Figure 4: Precision Scores of Machine Learning Models Across Different Train-Test Split Ratios |
Table 8 and Figure 5 investigate how the train-test split ratio impacts the recall of ML models. In most cases, a larger training set (the higher first number in the split) leads to lower recall (LR, DT, SVM, KNN). This suggests the models might be overfitting to the training data and missing true positives in the testing data. However, there are interesting exceptions. RF shows a peak in recall at 80-20, while ANNs maintain high recall even with a smaller training set (70-30). This highlights the importance of finding the optimal train-test split ratio for each model to balance memorization of training data and generalizability to unseen data.
Table 8: Recall of different ML algorithms on varying train-test split
|
Splits Algorithms |
60-40 |
70-30 |
80-20 |
90-10 |
|
LR |
0.82 |
0.77 |
0.76 |
0.6 |
|
DT |
0.73 |
0.65 |
0.71 |
0.6 |
|
RF |
0.66 |
0.84 |
0.81 |
0.7 |
|
SVM |
0.86 |
0.84 |
0.81 |
0.6 |
|
KNN |
0.41 |
0.45 |
0.48 |
0.5 |
|
NB |
0.84 |
0.81 |
0.71 |
0.6 |
|
ANN |
0.89 |
0.9 |
0.76 |
0.7 |
|
RNN |
0.8 |
0.77 |
0.67 |
0.6 |
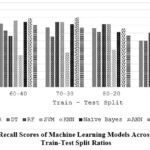 |
Figure 5: Recall Scores of Machine Learning Models Across Different Train-Test Split Ratios |
Table 9 and Figure 6 examine how train-test split ratios influence F1 scores, a metric combining precision and recall. Generally, a larger training set (higher first number) benefits most models (LR, SVM, KNN). However, Random Forest performs best at an 80-20 split, suggesting it might strike a good balance between training and generalizability. Interestingly, ANNs and RNNs maintain decent F1 scores even with a smaller training set, potentially requiring less data for effective learning. In general, the ideal division of data into training and testing sets appears to be contingent upon the ML algorithm employed.
Table 9: F-1 score of different ML algorithms on varying train-test split
|
Splits Algorithms |
60-40 |
70-30 |
80-20 |
90-10 |
|
LR |
0.86 |
0.81 |
0.84 |
0.71 |
|
DT |
0.77 |
0.75 |
0.79 |
0.63 |
|
RF |
0.73 |
0.8 |
0.79 |
0.7 |
|
SVM |
0.84 |
0.81 |
0.83 |
0.71 |
|
KNN |
0.49 |
0.54 |
0.57 |
0.62 |
|
Naïve Bayes |
0.84 |
0.77 |
0.75 |
0.67 |
|
ANN |
0.81 |
0.79 |
0.74 |
0.67 |
|
RNN |
0.74 |
0.79 |
0.7 |
0.67 |
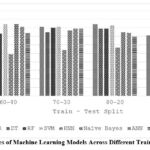 |
Figure 6: F1 Scores of Machine Learning Models Across Different Train-Test Split Ratios |
Table 10 and Figure 7 explore how the size of the training set (train-test split) affects the overall accuracy of various ML models. In most cases, a larger training set (higher first number in the split ratio) leads to better accuracy (LR, DT, SVM). However, some models like RF seem to perform well with a balanced split (80-20), while RNNs maintain decent accuracy even with a smaller training set. This suggests the optimal split ratio can vary depending on the model’s learning style.
Table 10: Precision of different ML algorithms on varying train-test split
|
Splits Algorithms |
60-40 |
70-30 |
80-20 |
90-10 |
|
LR |
0.89 |
0.86 |
0.89 |
0.81 |
|
DT |
0.82 |
0.84 |
0.85 |
0.74 |
|
RF |
0.81 |
0.84 |
0.83 |
0.78 |
|
SVM |
0.87 |
0.85 |
0.87 |
0.81 |
|
KNN |
0.66 |
0.7 |
0.72 |
0.78 |
|
NB |
0.87 |
0.81 |
0.81 |
0.77 |
|
ANN |
0.83 |
0.81 |
0.79 |
0.74 |
|
RNN |
0.78 |
0.83 |
0.77 |
0.77 |
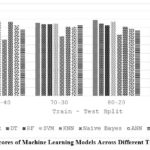 |
Figure 7: Accuracy Scores of Machine Learning Models Across Different Train-Test Split Ratios |
Table 11 and Figure 8 analyze how the train-test split ratio affects a model’s error (measured by MAE). Generally, a larger training set (higher first number) benefits most models (LR, SVM) by reducing error. However, some models like RF show similar errors across splits, suggesting they might be less sensitive to training data size. Conversely, KNN exhibits lower error with a smaller training set, potentially due to its simpler structure. Overall, the optimal split ratio for minimizing error seems to depend on the specific machine learning model’s learning behavior.
Table 11: MAE of different ML algorithms on varying train-test split
|
Splits Algorithms |
60-40 |
70-30 |
80-20 |
90-10 |
|
LR |
0.11 |
0.13 |
0.11 |
0.18 |
|
DT |
0.17 |
0.16 |
0.14 |
0.26 |
|
RF |
0.19 |
0.16 |
0.16 |
0.22 |
|
SVM |
0.13 |
0.15 |
0.12 |
0.18 |
|
KNN |
0.34 |
0.29 |
0.27 |
0.22 |
|
NB |
0.12 |
0.18 |
0.18 |
0.22 |
|
ANN |
0.16 |
0.18 |
0.2 |
0.25 |
|
RNN |
0.22 |
0.16 |
0.22 |
0.22 |
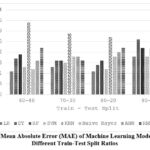 |
Figure 8: Mean Absolute Error (MAE) of Machine Learning Models Across |
Table 12 and Figure 9 explore how the train-test split ratio influences the error of ML models, measured by RMSE. Like MAE (Table 8), a larger training set (higher first number) generally reduces error (RMSE) for models like LR and SVM. RF shows similar errors across splits, while KNN benefits from a smaller training set. This suggests the ideal split ratio to minimize error depends on the model’s learning characteristics. Notably, RMSE values are generally higher than MAE in Table 8, reflecting its emphasis on larger errors.
Table 12: RMSE Variations in Machine Learning with Different Training Set Sizes
|
Splits Algorithms |
60-40 |
70-30 |
80-20 |
90-10 |
|
LR |
0.33 |
0.36 |
0.33 |
0.43 |
|
DT |
0.42 |
0.4 |
0.38 |
0.51 |
|
RF |
0.44 |
0.4 |
0.41 |
0.47 |
|
SVM |
0.36 |
0.38 |
0.36 |
0.43 |
|
KNN |
0.58 |
0.54 |
0.52 |
0.47 |
|
NB |
0.36 |
0.43 |
0.43 |
0.47 |
|
ANN |
0.4 |
0.43 |
0.45 |
0.5 |
|
RNN |
0.47 |
0.4 |
0.47 |
0.47 |
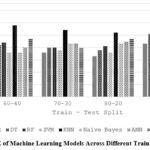 |
Figure 9: RMSE of Machine Learning Models Across Different Train-Test Split Ratio
|
This study investigated the influence of training data size (train-test split ratio) on various ML models. We employed four split ratios: 60-40, 70-30, 80-20, and 90-10. Interestingly, the split ratio at which each model achieved its peak accuracy varied.
LR excelled in the 60-40 and 80-20 splits, reaching an accuracy of 89%. DT performed best in the 80-20 split with 85% accuracy. SVM remained consistent across the 60-40 and 80-20 splits, achieving the highest accuracy of 87% in both. RF, however, found its sweet spot in the 70-30 split, reaching 84% accuracy.
The trend continued for other models. KNN achieved its peak of 78% accuracy in the 90-10 split, while NBs performed best in the 60-40 split with 87% accuracy. ANN and RNN also exhibited their highest performance (83% accuracy) in the 60-40 and 70-30 splits, respectively.
These findings are further supported by our broader analysis (presented in a separate section). It revealed that while a larger training set generally improves accuracy and reduces error for most models, the optimal split ratio can vary depending on the specific model. Random Forest performs well with a balanced split, while some models like KNN benefit from less training data. Interestingly, NNs maintain decent performance even with a smaller training set, suggesting they might require less data to learn effectively. The choice of error metric (MAE vs. RMSE) also influences the observed error. Overall, finding the optimal train-test split ratio for each model is crucial to balancing the memorization of training data and generalizability to unseen data.
Conclusion
In conclusion, the application of ML models in heart disease prediction heralds a new era in precision medicine. These ML models assume a predominance over conventional methods by revealing complex correlations and patterns that may have been missed by these conventional approaches. These machine learning models have completely revolutionized personalized risk assessments and treatment strategies for patients prone to heart diseases. This early prognosis and diagnosis have become possible through training the models using large datasets of the medical history of the patients, and some of their personal information, including lifestyle decisions and genetic markers. As we have shown in this research paper, to maximize the accuracy of the predictions provided by these models, the selection of suitable ML techniques based on the parameters available is of pivotal importance. Furthermore, the increased accuracy of the predictions made by these ML models can be proved useful giving physicians significant aid and assistance in their decision-making. The early detection and treatment predictions given by the ML models can save a lot of lives lost due to heart diseases.
Subsequent investigations may concentrate on creating methodologies to systematically determine the ideal division of data for training and testing within specific machine learning models and datasets. This would improve the efficiency of the training process and ensure models are not overfit or underfit to the training data. Furthermore, examining additional performance indicators beyond accuracy, such as the F1 measure or AUC-ROC, could offer a more comprehensive assessment of model capabilities across varying training and testing data proportions.
Acknowledgement
The author would like to thank Bennett University for providing all necessary facilities to carry out this research work.
Funding sources
The author(s) received no financial support for the research, authorship, and/or publication of this article
Conflict of Interest
Corresponding author on behalf of all authors declare that there is no conflict of interest.
Data Availability Statement
This statement does not apply to this article.
Ethics Statement
This research did not involve human participants, animal subjects, or any material that requires ethical approval
Informed Consent Statement
This study did not involve human participants, and therefore, informed consent was not required
Clinical Trial Registration
This research does not involve any clinical trials
Authors Contribution
Khalid Anwar: Conceptualization, writing, review, editing and supervision.
Raghav Goel: Experimentation, Results analysis
Shahnawaz Ahmad: Writing, Review, and supervision.
Shivangi Goel: Writing.
References
- Rath A, Mishra D, Panda G, Satapathy SC. Heart disease detection using deep learning methods from imbalanced ECG samples. Biomed Signal Process Control. 2021;68:102820.
CrossRef - Khaleel Faieq A, Mijwil MM. Prediction of heart diseases utilising support vector machine and artificial neural network. Indones J Electr Eng Comput Sci. 2022;26(1):374-380.
CrossRef - Kadhim MA, Radhi AM. Heart disease classification using optimized Machine learning algorithms. Iraqi J Comput Sci Math. 2023;4(2):31-42.
CrossRef - Shuvo MS, Nawaz F, Adil K. An Early Detection of Heart Disease using Machine Learning(recurrent neural network) ML research on Heart Disease Prediction. Ieee. Published online 2023:1-10.
CrossRef - Wang J, Rao C, Goh M, Xiao X. Risk assessment of coronary heart disease based on cloud-random forest. Artif Intell Rev. 2023;56(1):203-232.
CrossRef - Qadri AM, Raza A, Munir K, Almutairi MS. Effective Feature Engineering Technique for Heart Disease Prediction With Machine Learning. IEEE Access. 2023;11:56214-56224.
CrossRef - Niloy Biswas, Md Mamun Ali, Md Abdur Rahaman, Minhajul Islam, Md. Rajib Mia, Sami Azam, Kawsar Ahmed, Francis M. Bui, Fahad Ahmed Al-Zahrani, Mohammad Ali Moni, Machine Learning-Based Model to Predict Heart Disease in Early Stage Employing Different Feature Selection Techniques. Biomed Res Int. 2023;2023.
CrossRef - Anwar K, Zafar A, Iqbal A. An efficient approach for improving the predictive accuracy of multi-criteria recommender system. Int J Inf Technol. 2024;16(2):809-816.
CrossRef - Özen Kavas P, Recep Bozkurt M, Kocayiğit İ, Bilgin C. Machine learning-based medical decision support system for diagnosing HFpEF and HFrEF using PPG. Biomed Signal Process Control. 2023;79.
CrossRef - Q Xu, W Xie, B Liao, C Hu, L Qin, Z Yang, H Xiong, Y Lyu, Y Zhou, A Luo, Interpretability of Clinical Decision Support Systems Based on Artificial Intelligence from Technological and Medical Perspective: A Systematic Review. J Healthc Eng. 2023;2023.
CrossRef - Priya BH, Chaitra C, Reddy KV. Performance Analysis of Machine Learning Algorithms for Disease Prediction. 2021 Grace Hopper Celebr India, GHCI 2021. 2021;03007.
CrossRef - Swathy M, Saruladha K. A comparative study of classification and prediction of Cardio-Vascular Diseases (CVD) using Machine Learning and Deep Learning techniques. ICT Express. 2022;8(1):109-116.
CrossRef - Biswas N, Uddin KMM, Rikta ST, Dey SK. A comparative analysis of machine learning classifiers for stroke prediction: A predictive analytics approach. Healthc Anal. 2022;2
CrossRef - Asih PS, Azhar Y, Wicaksono GW, Akbi DR. Interpretable Machine Learning Model For Heart Disease Prediction. Procedia Comput Sci. 2023;227:439-445.
CrossRef - Rajendran R, Karthi A. Heart disease prediction using entropy based feature engineering and ensembling of machine learning classifiers. Expert Syst Appl. 2022:117882.
CrossRef - Ali MM, Paul BK, Ahmed K, Bui FM, Quinn JMW, Moni MA. Heart disease prediction using supervised machine learning algorithms: Performance analysis and comparison. Comput Biol Med. 2021;136:104672.
CrossRef - Sondhi P. Random Forest Based Heart Disease Prediction. 2021;10(2):2019-2022.
- Uddin S, Haque I, Lu H, Moni MA, Gide E. Comparative performance analysis of K-nearest neighbour (KNN) algorithm and its different variants for disease prediction. Sci Rep. 2022;12(1):1-11.
CrossRef - Krithiga B, Sabari P, Jayasri I, Anjali I. Early detection of coronary heart disease by using naive bayes algorithm. J Phys Conf Ser. 2021;1717(1).
CrossRef - Mariettou S, Koutsojannis C, Mariettou S, Koutsojannis C, Triantafillou V. EasyChair Preprint Machine Learning Improves Accuracy of Coronary Heart Disease Prediction of Coronary Heart Disease Prediction. Published online 2024.
- Bogelly K, Rao CR, Uppari S, Shilpa K. Hybrid Classification Using Ensemble Model to Predict Cardiovascular Diseases. Int J Res Appl Sci Eng Technol. 2023;11(4):697-705.
CrossRef - Hasan M, Sahid MA, Uddin MP, Marjan MA, Kadry S, Kim J. Performance discrepancy mitigation in heart disease prediction for multisensory inter-datasets. PeerJ Comput Sci. 2024;10:e1917.
CrossRef - Abdollahi J, Nouri-Moghaddam B. A hybrid method for heart disease diagnosis utilizing feature selection based ensemble classifier model generation. Iran J Comput Sci. 2022;5(3):229-246.
CrossRef - Gudadhe M, Wankhade K, Dongre S. Decision support system for heart disease based on support vector machine and artificial neural network. 2010 Int Conf Comput Commun Technol ICCCT-2010. Published online 2010:741-745.
CrossRef - Palaniappan S, Awang R. Intelligent heart disease prediction system using data mining techniques. AICCSA 08 – 6th IEEE/ACS Int Conf Comput Syst Appl. Published online 2008:108-115.
CrossRef - Olaniyi EO, Oyedotun OK, Adnan K. Heart Diseases Diagnosis Using Neural Networks Arbitration. Int J Intell Syst Appl. 2015;7(12):75-82.
CrossRef - Das R, Turkoglu I, Sengur A. Effective diagnosis of heart disease through neural networks ensembles. Expert Syst Appl. 2009;36(4):7675-7680.
CrossRef - Jabbar MA, Deekshatulu BL, Chandra P. Classification of Heart Disease using Artificial Neural Network Classification of Heart Disease using Artificial Neural Network and Feature Subset Selection. Glob J Comput Sci Technol Neural Artif Intell. 2013;13(3):5-14.
- Samuel OW, Asogbon GM, Sangaiah AK, Fang P, Li G. An integrated decision support system based on ANN and Fuzzy_AHP for heart failure risk prediction. Expert Syst Appl. 2017;68:163-172.
CrossRef - Khourdifi Y, Bahaj M. Heart disease prediction and classification using machine learning algorithms optimized by particle swarm optimization and ant colony optimization. Int J Intell Eng Syst. 2019;12(1):242-252.
CrossRef - Miss, Chaitrali S, Dangare, Sulabha S. A Data Mining Approach for Prediction of Heart Disease Using Neural Network. Int J Comput Eng Technol (IJCET),. 2012;3(3):30-40.
- Xu S, Zhang Z, Wang D, Hu J, Duan X, Zhu T. Cardiovascular risk prediction method based on CFS subset evaluation and random forest classification framework. 2017 IEEE 2nd Int Conf Big Data Anal ICBDA 2017. Published online 2017:228-232.
CrossRef - Otoom AF, Abdallah EE, Kilani Y, Kefaye A, Ashour M. Effective diagnosis and monitoring of heart disease. Int J Softw Eng its Appl. 2015;9(1):143-156.
- Vembandasamyp K, Sasipriyap RR, Deepap E. Heart Diseases Detection Using Naive Bayes Algorithm. IJISET-International J Innov Sci Eng Technol. 2015;2(9):1-4.
- Chaurasia V, Pal S. Data Mining Approach to Detect Heart Dieses. Int J Adv Comput Sci Inf Technol. 2013;2(4):56-66.
- Dwivedi AK. Performance evaluation of different machine learning techniques for prediction of heart disease. Neural Comput Appl. 2018;29(10):685-693.
CrossRef - Wasid M, Anwar K. Incorporating Contextual Information and Feature Fuzzification for Effective Personalized Healthcare Recommender System. Published online 2023:197-211.
CrossRef - Ottaviani FM, Marco A De. Multiple Linear Regression Model for Improved Project Cost Forecasting. Procedia Comput Sci. 2021;196(2021):808-815.
CrossRef - Palimkar P, Shaw RN, Ghosh A. Machine Learning Technique to Prognosis Diabetes Disease: Random Forest Classifier Approach. Lect Notes Networks Syst. 2022;218:219-244.
CrossRef - Klusowski JM, Tian PM. Large Scale Prediction with Decision Trees. J Am Stat Assoc. 2024;119(545):525-537.
CrossRef - Sandhy Y a. Prediction of Heart Diseases using Support Vector Machine. Int J Res Appl Sci Eng Technol. 2020;8(2):126-135.
CrossRef - Chethana C. Prediction of heart disease using different KNN classifier. Proc – 5th Int Conf Intell Comput Control Syst ICICCS 2021. Published online 2021:1186-1194.
CrossRef - Sarra RR, Dinar AM, Mohammed MA. Enhanced accuracy for heart disease prediction using artificial neural network. Indones J Electr Eng Comput Sci. 2023;29(1):375-383.
CrossRef - Anwar K, Zafar A, Iqbal A. Neutrosophic MCDM Approach for Performance Evaluation and Recommendation of Best Players in Sports League. Int J Neutrosophic Sci. 2023;20(1):128-149.
CrossRef - Wasid M, Anwar K. An Augmented Similarity Approach for Improving Collaborative Filtering based Recommender System. 2022 Int Conf Data Anal Bus Ind ICDABI 2022 :751-755.
CrossRef


