
Manuscript accepted on :30-11-2023
Published online on: 07-05-2024
Plagiarism Check: Yes
Reviewed by: Dr. Mohini Kuchekar
Second Review by: Dr. Mustafa TÜRKMEN
Final Approval by: Dr. Ayush Dogra
Sagar Sarkar1, 2 , Rejuan Islam1, Amlan Jyoti Ghosh1, Supriyo Ghosh1and Tilak Saha1*
1Immunology and Microbiology Laboratory, Department of Zoology, University of North Bengal, West Bengal, India,
2Department of Zoology, Siliguri College, Darjeeling, West Bengal, India.
Corresponding Author E-mail: tilaksaha@nbu.ac.in
DOI : https://dx.doi.org/10.13005/bpj/2910
Abstract
Effects of Costus pictus leaf extract (CPLE) in ameliorating the adverse outcomes of hyperglycemia-associated renal injury is investigated in Swiss Albino Mice. To induce renal injury associated with hyperglycemia, adult mice were given intraperitoneal injections of Streptozotocin (STZ) dissolved in 0.5mol citrate buffer for five days. Animals were divided into five groups, namely CMC (vehicle control group, receiving only carboxy methyl cellulose), DC (Disease control group, receiving only STZ and without any treatment), GLD (positive control group, receiving standard drug glibenclamide), LD (experimental group treated with CPLE at 250 mg/kg bw) and HD (experimental group treated with CPLE at 500 mg/kg bw). After a rearing/treatment regimen of 4 weeks, animals were sacrificed to analyze various parameters. Oral glucose tolerance test (OGTT) based area under the curve of plasma glucose (AUCglucose), kidney index, lipid profiling, serum, urine parameters (creatinine, albumin, urea), antioxidant studies and kidney histopathology were carried out. It was found that harmful lipids like cholesterol, triglycerides (TG) and low-density lipoprotein-C (LDL-C) levels were significantly elevated in the DC group, whereas LD, HD and GLD showed a tendency towards normalcy. Urine and serum parameters also showed the same trend in treatments and the GLD group, whereas the DC group showed steep abnormalities. Antioxidant study also reveals that treatment with CPLE, balances antioxidant activity by mitigating the effects of reactive oxygen species (ROS). Histopathological investigations displayed significant disruptions in the microstructure of glomeruli of the DC group compared to both the treatments and GLD groups. These preliminary findings indicate that CPLE shows a trend to ameliorate hyperglycemia-associated renal complications and demands further detailed study.
Keywords
Alternative medicine; Hyperglycemia; Nephropathy; Nephroprotection; Renal Injury; Streptozotocin
Download this article as:| Copy the following to cite this article: Sarkar S, Islam R, Ghosh A. J, Ghosh S, Saha T. Effects of Methanolic Leaf-extract of Costus pictus D. Don on Swiss Albino Mice with Hyperglycemia Associated Renal Complications. Biomed Pharmacol J 2024;17(2). |
| Copy the following to cite this URL: Sarkar S, Islam R, Ghosh A. J, Ghosh S Saha T. Effects of Methanolic Leaf-extract of Costus pictus D. Don on Swiss Albino Mice with Hyperglycemia Associated Renal Complications. Biomed Pharmacol J 2024;17(2). Available from: https://bit.ly/3UDKCuK |
Introduction
Diabetes mellitus (DM) has gained international attention as a remarkable health threat. Unusually prolonged hyperglycemia, a major hallmark of diabetic individuals, results in several pathophysiological problems1 often affecting vital organs like the eye, kidney, heart and nerves2. There are two major forms of DM, one is type-I and other is type-II, which are also known as Insulin-dependent diabetes mellitus (IDDM) and non-insulin-dependent diabetes mellitus (NIDDM), respectively. Type-I diabetes is an autoimmune disorder that causes a localized inflammatory response, in and around the islets of Langerhans, followed by the selective death of β-cells that secrete insulin. Type-II diabetes is characterized by reduced insulin secretion and peripheral insulin resistance3,4. Diabetes prevalence is predicted to increase from 2.8% in 2000 to 4.4% in 2030 across all age groups and according to projections, there will be 366 million people with diabetes worldwide by 2030, up from 171 million in 20005. Diabetic nephropathy (DN) is the most prevalent and serious consequence of prolonged diabetes and has been identified as the leading cause of kidney damage and eventual renal failure, which ultimately necessitates regular dialysis or kidney transplantation6,7. According to reports, DN or end-stage renal failure can develop in 30–40% of people worldwide sooner than later8,9. The hallmarks of DN include thickening of the basement membrane, growth of mesangial cells and podocyte cell death, which result in morphological and functional abnormalities in the filtration barrier10,11. In such nephropathic individuals, the impaired renal basement membrane causes an increase in the excretion of urine albumin, urea and creatinine which lowers the glomerular filtration rate (GFR)12.
One of the often used naturally occurring diabetes-inducing substances used on laboratory animals is streptozotocin (STZ), derived from Streptomyces achromogenes, which is chemically known as N (Methylnitrosocarbamoyl)-±-D-glucosamine13. According to studies, oral or intravenous administration of STZ to animals causes pancreatic beta cells to die, which causes the animals to develop diabetes14. STZ enters the β cell via the GLUT-2 transporter and causes alkylation of DNA, thereby inducing the activation of polyADP ribosylation, leading to depletion of cellular NAD+ and ATP, which without medical intervention can lead to the condition of DN15. STZ was intraperitoneally employed in our investigation to establish the DN mouse model.
In addition to conventional diabetic treatments, including insulin therapy and oral hypoglycemic medications, many diabetic patients adopt supplementary and alternative approaches, as it is believed to have fewer side effects and are cost-effective as well16. Hence, adopting a plant-based therapeutic approach in context with the management of diabetes and associated complications is an essential strategy. It has also been reported that a related plant of C. pictus known as C. afer, originated in Africa having anti-nephrotoxicity effects17. Moreover, the mixture of C. pictus with metformin and enalapril showed beneficial effects in the management of DN18. So, the current study investigated the effects of methanolic extract of C. pictus for attenuation of DN. A wide range of phytochemical substances, including alkaloids, glycosides, tannins, phenols, steroids, terpenoids, and flavonoids, were found in C. pictus. In particular, quercetin, a flavonoid available in C. pictus leaf extract has a strong antioxidant effect, which helps scavenge superoxide radicals and inhibit xanthine oxidase19. Among all the parts of C. pictus, methanolic leaf extract demonstrated the best antioxidant activity20. It has also been revealed that the leaf extract of C. pictus has anti-inflammatory properties. These extracts reduced the levels of pro-inflammatory cytokines such as tumor necrosis factor-α and C-reactive protein by inhibiting the molecules involved in the stress-sensitive signaling cascade. Additionally, it suppressed the expression of monocyte chemotactic protein and interleukin 6 (IL-6), the inflammatory cytokines often linked to insulin resistance, obesity, diabetes and metabolic syndrome21. The potent anti-inflammatory of the plant qualities could be attributed to the rich phenolic compounds present in C. pictus leaves22. The biochemical pathways influenced by the bioactive components present in the methanolic extract of C. pictus leaves,leading to beneficial effects on diabetic kidney injury advocate for further molecular investigations.
Material and methods
Collection and Identification of C. pictus
Naturally, growing C. pictus D. Don, also known as insulin plant or Sugar plant (Family: Costaceae), were collected in and around the area of Siliguri (26.7271°N, 88.3953°E), West Bengal, India during January-February in the year of 2020. The Taxonomy of Angiosperm and Biosystematics Laboratory, Department of Botany of the University of North Bengal authenticated the collected plant specimens. The voucher specimen was deposited in the herbarium of the Department of Botany, University of North Bengal, with the depository accession number (Accession no: 11783).
Preparation of methanolic extract of C. pictus leaves
Collected C. pictus leaves were shed and dried at room temperature for two weeks. Then the leaves were ground into fine powder and then stored in airtight containers at room temperature. For extraction, the powder was suspended in absolute methanol in a 5 g: 250 ml (w/v) ratio for 72 hours in the Soxhlet apparatus. The extract was concentrated using a Buchi-style rotary evaporator (Cole Parmer RV1010D596, India) at a lower pressure and temperature (45°C). Then, the concentrated semi-liquid component was taken into a Petri dish and dried at room temperature. Then, the final yield efficiency was calculated. The dried sample was collected into a glass vial and kept at -20o C for future use.
Induction of renal injury
For the induction of the renal injury associated with hyperglycemia, a batch of animals (n=6) were given intraperitoneal injections of STZ, dissolved in freshly prepared 0.5 mol citrate buffer (pH 8) at the fixed dosage of 30mg/kg body weight (bw) for five days with a gap of one day between 2 dosages. Animals that had fasting blood glucose levels above 215 mg/dL were selected for further study on the 10th day of the experiment23,24. Animals were monitored for another seven days for any changes in blood glucose levels to ensure no reversal of the hyperglycemic state. On the 17th day of the experiment, animals were grouped for further experimentation.
Animal Experimental Design
The animals were divided into five groups: CMC (vehicle control group; animals that were given carboxy methyl cellulose along with food and water ad libitum for 28 days duration), DC (Disease control group; renal injury-induced disease group that were subjected to only food and water ad libitum without any specific treatment for 28 days duration), GLD (positive control group; renal injury induced group that were treated with glibenclamide dissolved in carboxy methyl cellulose along with food and water ad libitum for 28 days duration), LD (Treatment groups with low dose; renal injury induced group that were treated with low dose of CPLE at 250 mg/kg bw dissolved in carboxy methyl cellulose along with food and water ad libitum for 28 days duration) and HD (Treatment groups with high dose; renal injury induced group that were treated with a high dose of CPLE at 500 mg/kg bw dissolved in carboxy methyl cellulose along with food and water ad libitum for 28 days duration)
Determination of OGTT-based Area Under Curve of Plasma Glucose (AUCglucose)
OGTT-based AUCglucose was performed at the end of the experimental duration. The levels of blood glucose were measured by pricking the tail vein of 16 hours-fasted animals, aseptically with a sterile needle. For this study, the mice were administered a single oral dose of glucose (2 g/kg bw) and the reading was taken just before the glucose administration (0 min) and after 30,60, 90, and 120-minute time intervals using a handheld glucometer (Dr. Morepen BG03, Morpen Laboratories Ltd., India). Then, using the values of the respective glucose levels at different time intervals, AUCglucose was measured25.
Kidney Index
Before sacrificing, each mouse was weighed individually and after sacrifice, both kidneys were weighed24. Finally, the kidney index was calculated by dividing the kidney weight by the bw and multiplying by 100.
Biological samples collection
Urine, blood and tissue samples were collected aseptically by following standard protocols. Specimens except blood were stored at -20oC until further evaluations. For the blood sample, serum was separated by centrifuging the clotted blood samples at 3000 rpm for 5 min and stored at -20°C until analysis.
Serological Lipid Profiling
Standard colorimetric kits were used (Coral Clinical System, India) to evaluate the lipid profile, which included serum total cholesterol (TC, Cat No. 1102040275), high-density lipoprotein-C (HDL-C, Cat No. 1102150040) and Triglyceride (TG, Cat No. 1102220075). The manufacturer’s instructions were followed for performing serum lipid profile testing, and LDL-C was calculated, following the Martin-Hopkin calculation26.
Serological and urological profiling of renal injury parameters
Standard colorimetric kits from Coral Clinical System, India were used following the manufacturer’s instructions to estimate Albumin (Cat No. 1101021150), Creatinine (Cat No. 1101070275) and Urea (Cat No. 1102240075) parameters of serum and urine as renal injury markers.
In-vivo antioxidant study
Preparation of kidney homogenate
After sacrifice, the kidneys were dissected and washed in phosphate buffer saline (PBS). The kidney tissue was homogenized to make 10% homogenate with phosphate buffer (PB) in a 50 mM concentration at 7.4 pH. The homogenate was centrifuged at 1000 g for 15 minutes at 4°C27.
Estimation of lipid peroxidation (MDA)
Lipid peroxidation was estimated by thiobarbituric acid (TBA) method with slight modification28. In short, a reaction mixture was prepared with 1 ml of TBA (0.5%) and 1 ml of trichloroacetic acid (20%). In this mixture, 50 μl of tissue homogenate was mixed. The whole mixture was kept in a water bath at 95°C for 30 minutes. After that, to stop the reaction, it was ice-cooled for 5 minutes, followed by centrifugation at 2000 g for 12 minutes. Absorbance was taken at 532 and 600 nm, respectively.
Estimation of superoxide dismutase (SOD)
SOD was estimated by the nitroblue tetrazolium (NBT) method with slight modification29. A reaction mixture of 1 ml sodium carbonate (50 mM), 400 μl of NBT (25 mM) and 200 μl of hydroxylamine hydrochloride (0.1 mM) was made. On that mixture, 100 μl of tissue homogenate was mixed and absorbance was taken at 560 nm.
Estimation of reduced glutathione (GSH)
GSH was estimated by the Elman reagent method with slight modification30. At first, Elman reagent was prepared by mixing 19.8 mg of DTMB and it was dissolved in 100 ml of sodium nitrate (0.1%). On that reagent, 1 ml of tissue homogenate and 3 ml of phosphate buffer were added and absorbance was taken at 412 nm.
Estimation of catalase activity
Catalase activity was estimated by the hydrogen peroxide (H2O2) method with slight modification31. A reaction mixture of 500 μl of H2O2 (0.34 nM) and 2.5 ml distilled water was made. In that reaction mixture, 40 μl of tissue homogenate was added. After that, absorbance was taken at 240 nm.
Histopathological Evaluation
By following standard protocol, histological evaluations were carried out from the animal tissue. Surgically, the kidneys were removed and washed with chilled PBS and placed in Bouins fixative for fixation. After that, serial ethanol dilutions were used to dehydrate the tissues before embedding them in paraffin wax. Haematoxylin and eosin were used for staining and six μm thick sections were cut from a paraffin-embedded block32. Following that, using a light microscope, microscopic inspections were performed (Nikon Eclipse E200, Nikon, Tokyo, Japan) with a 40X magnification.
Statistical analysis
With the aid of a statistical package program (KyPlot 6.0), Dunnett’s test was done to compare the groups statistically, and p ≤ 0.05 was considered significant for all statistical analyses in this study.
Results and Discussion
AUCglucose
Plasma Glucose determined by OGTT-based Area Under Curve (AUCglucose) It has been found that the values of AUCglucose were significantly higher (p≤0.05) in the DC group (469.28 ± 87.93 mg h/dL;) when compared with that of the CMC group (246.13 ± 7.30 mg h/dL); whereas, the values of GLD (252.76 ± 8.88 mg h/dL), LD (277.75 ± 24.26 mg h/dL) and HD (275.77 ± 11.19 mg h/dL) group were statistically non-significant with CMC group (Fig.1).
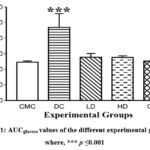 |
Figure 1: AUCglucose values of the different experimental groups, where, *** p ≤0.001 |
Kidney Index
Statistical analysis showed that the kidney index of the DC (1.24 ± 0.47 gm;) group significantly (p≤0.05) elevated compared to the CMC (0.64 ± 0.25 gm) group. Whereas, LD (0.84 ± 0.25 gm), HD (0.84 ± 0.20 gm) and GLD (0.62± 0.27 gm) group shows insignificant results compared to the CMC group (Fig. 2).
 |
Figure 2: Kidney index value of different experimental groups, where, *p ≤ 0.05 |
Lipid Profile Analysis
Colorimetric kits were used to evaluate the lipid profile (serum TC, HDL-C and TG) of the experimental animals on the last day of the experiment. The HDL-C levels were significantly (p≤0.05) lower in the disease group (26.68±31 mg/dl) compared to the CMC (34.44±7.47 mg/dl), and GLD, LD, and HD group shows values are close to the CMC group. Whereas, serum total cholesterol was significantly higher in the disease group (156.27±4.50 mg/dl) compared to the CMC (136.66±12.20 mg/dl) group, the GLD, LD, and HD parameters showed non-significant variation. The TG values in the disease group (141.37±2.57 mg/dl) and CMC group (122.55±7.04 mg/dl) also significantly (p≤0.05) differed, but comparison with LD, HD with CMC showed non-significant differences. In the case of bad cholesterol like LDL-C, the value in disease control (101.67±5.31mg/dl) is considerably high compared to the CMC (77.66±13.51 mg/dl) group; the GLD, LD, and HD groups show non-significant variations (Fig. 3).
 |
Figure 3: Serum lipid profile among experimental groups: A. Concentration of serum cholesterol B. Concentration of serum triglycerides |
Serum parameters of Albumin, Creatinine and Urea
At the end of the experimental duration, it was found that the levels of serum albumin were significantly lower in the DC group (2.90 ± 0.18 g/dL) when compared with the CMC group (4.12 ± 0.59 g/dL). Whereas, the values of the same tests observed in the treated groups (HD and LD) and GLD were close to that of the CMC group. For the serum creatinine, the DC group showed significantly elevated (p≤0.05) levels (0.98 ± 0.25 mg/dL) when compared with the CMC group (0.77 ± 0.03 mg/dL). Other experimental groups LD, HD and GLD showed slight elevations in the serum creatinine levels (0.87 ± 0.03 mg/dL, 0.85 ± 0.03 and 0.82 ± 0.07 mg/dL respectively), but these are not significant (p≤0.05) when compared with the CMC group. Serum urea parameter was also significantly (p≤0.05) higher (42±1.67 mg/dL) in the DC group compared to the CMC group (29.66 ± 2.94 mg/dL), but the treatment groups (33.66 ± 2.87 mg/dL and 32.5 ± 3.61 mg/dL value of LD and HD respectively) and GLD (31.83 ± 3.06 mg/dL) group shows insignificant result compared with CMC group (Fig. 4).
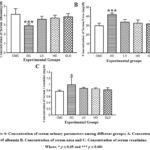 |
Figure 4: Concentration of serum urinary parameters among different groups; A. Concentration of albumin B. Concentration of urea |
Urine parameters of Albumin, Creatinine, and urea
At the end of the experimental duration, it was found that the levels of urine albumin were significantly higher (p≤0.05) in the DC group (3.83 ± 0.25 mg/dL) when compared to the CMC group (2.87 ± 0.22 mg/dL). Whereas, the levels of the same in the groups LD, HD (3.29 ± 0.28 mg/dl, 3.14 ± 0.43 mg/dL respectively) is a bit higher than in the CMC group but not significantly (p≤0.05) differ. With regards to the urine creatinine, the DC group showed significantly elevated (p≤0.05) levels (1.85 ± 0.49 g/L) when compared with the CMC group (1.26 ± 0.30 g/L). The groups LD, HD and GLD showed slight elevations in the levels (1.41 ± 0.35 g/L, 1.34 ± 0.32 and 1.32 ± 0.31 g/L respectively), but these are not significant (p≤0.05) when compared with the CMC group. For the Urine urea parameter, it was also significantly higher levels (5.53± 0.53 mg/dL) in the DC group compared with the CMC group (3.22 ± 0.44 mg/dL), but the LD (3.95 ± 0.44 mg/dL), HD (3.55 ± 0.57) and GLD (3.08 ± 0.50 mg/dL) group shows insignificant result compared with CMC group. (Fig. 5).
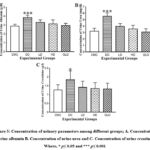 |
Figure 5: Concentration of urinary parameters among different groups; A. Concentration of urine albumin B. Concentration of urine urea. |
In-vivo antioxidant study
The MDA level in the case of DC (0.08±0.01nM/mg tissue) was significantly higher (p≤0.05) than other groups (0.048±0.015; 0.066±0.014; 0.066±0.011; 0.058±0.10 nM/mg tissue values of CMC, LD, HD and GLD respectively). The SOD level in the case of DC (0.079±0.023 Unit/mg tissue) was significantly lower (p ≤ 0.05), but the treatment group was able to increase the level of SOD (LD: 0.145±0.053; HD: 0.154±0.050; GLD: 0.151±0.11) which was close to CMC group (CMC: 0.149±0.058). The relative GSH concentration level in the case of DC (33.66±9.52) significantly (p < 0.05) reduced than the CMC group (CMC: 87.5±4.13). The treatment group namely HD (0.77.83±9.70) and GLD (86.5±2.07) showed an increase in the GSH level toward normalcy. However, the LD (76.33±7.50) group GSH relative concentration value shows a bit significant difference compared to the CMC group. In terms of catalase levels, the group treated with DC (634.16±47.55 Unit/g tissue) displayed significantly (p ≤ 0.05) lower levels of GSH compared to the CMC group (912.66±223.14 Unit/g tissue). All the HD (856.16±143.06 Unit/g tissue), LD (813.16±262.08 Unit/g tissue) and GLD (901.33±131.42 Unit/g tissue) groups demonstrated a trend towards normalization (Fig. 6).
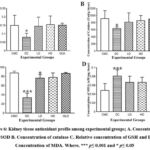 |
Figure 6: Kidney tissue antioxidant profile among experimental groups; A. Concentration of SOD B. Concentration of catalase. |
Histopathological evaluation:
In the histological study, we have found the normal architecture of the kidney and glomerular size in the CMC group. However, in the case of STZ-induced mice, it showed moderate to severe vascular degeneration of the glomerular tubule, increased glomerular and finally, atrophy in the glomerulus. At the same time, it is observed that among the treatment groups, the HD and the GLD groups showed a tendency toward normalcy of glomerulus architecture. However, LD also shows effects on restoration glomerulus architecture but is not as promising as HD (Fig. 7).
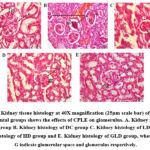 |
Figure 7: Kidney tissue histology at 40X magnification (25µm scale bar) of different experimental groups shows the effects of CPLE on glomerulus. |
Discussion
Nephropathy resulting from diabetes poses a substantial danger to human health due to its high morbidity and mortality rates. DN affects about 15–25% of type 1 diabetes patients and 30–40% of type 2 diabetes patients33. Despite the availability of therapeutics that slow the development of DN, there is increased interest in using herbal remedies to stop the development of this condition. When mice with STZ-induced hyperglycemia were administered ethanolic and methanolic extracts from C. pictus leaves, the hyperglycemic condition was significantly reduced34,35. C. pictus methanolic leaf extract is also reported to restore renal function, lower cholesterol levels and bring blood sugar levels back to normal in STZ-induced hyperglycemic mice36.In the initial and crucial stage of performing a study on phytomedicine, the choice of solvent holds immense importance. Opting for polar solvents such as methanol yields the greatest concentration of natural compounds37. Additionally, the methanolic extract boasts the highest levels of bioactive substances, further enhancing its extraction efficiency. Therefore, methanol is widely regarded as the optimal solvent for achieving elevated levels of phytochemical components38 and in our study, the yield efficiency of the methanolic leaf extract was 9.80%. However, our investigation observed that in the DC group, the glucose levels were elevated throughout the entire experimental duration (0 to 120 mins). However, the LD, HD, and GLD groups restored the glycemic profile just like the CMC group. These findings indicated that the CPLE helps to restore metabolic stress along with glycemic parameters positively. Because of the hyperglycemia and hypoinsulinemia caused by STZ-induced diabetes, there is a considerable loss in bw39 and increased protein loss from tissues as well as muscle atrophy40. The kidney index parameter of our study reveals that the bw of STZ-diabetic mice gradually decreased, while treatment with CPLE considerably increased the bw, indicating a reduction in the risk of hyperglycemia-induced damage to muscle tissue; it was also observed that in STZ-induced hyperglycemic mice, kidney weight (hypertrophy) increases proportionally to bw. Hypercholesterolemia and hypertriglyceridemia are brought on by diabetes mellitus41,42. After receiving CPLE, these elevated levels returned to normal, suggesting the potential of CPLE to enhance lipid metabolism. Albumin is by far the most abundant protein in nephrotic urine43. The relationship between albuminuria and declining kidney function was shown by the fact that the serum albumin concentration was significantly lower, and urine albumin levels were higher in STZ-diabetic mice. Treatment with CPLE normalized these levels, demonstrating the drug’s protective effects against microalbuminuria. Reduced excretion of creatinine in the urine and elevated urea and serum creatinine levels are signs that DN is developing22. These effects were reversed in STZ-diabetic Swiss albino mice treated with CPLE.Hyperglycemia also leads to an increase in reactive oxygen species (ROS), which disrupts normal tissue and cellular function, contributing to various diabetic complications, including DN44. These elevated ROS levels impair cellular defences by interfering with the normal functioning of lipids, DNA and proteins. Glutathione (GSH) plays a crucial role in preserving the plasma’s normal state by scavenging free radicals. Superoxide dismutase (SOD) captures superoxide molecules, converting their activity into less reactive ROS. When catalase combines with hydrogen peroxide (H2O2), it neutralizes ROS45. Malondialdehyde (MDA) is a byproduct of lipid oxidation and serves as an indicator of ROS44. In our experiment, we observed that both high and low doses of CPLE effectively reduced MDA levels. Furthermore, GLD also demonstrated the ability to decrease MDA levels. However, we observed low levels of SOD, GSH and catalase, indicating a diminished antioxidant status in STZ-induced DN mice. Notably, the HD CPLE group exhibited a more significant tendency toward restoring normal GSH levels than the LD group. Additionally, both HD and LD groups displayed the capacity to normalize SOD and catalase levels. In conclusion, our findings suggest that CPLE can help maintain the balance between oxidants and antioxidants by mitigating the effects of ROS. Kidney sections from STZ-diabetic mice underwent histopathological evaluation and the results revealed significant tubular vascular degeneration, increased glomerular space, thickening of the basement membrane and atrophy of the glomerulus in the DC group. Comparing the treatment groups and positive control group to the disease control group, the number of completely and partially malformed glomeruli is likewise deficient, which shows the restoration power of CPLE extract. Though the HD group’s restoration of glomerulus architecture proved to be more intense than that of the LD group, the LD group still shows the ability to restore glomerulus architecture compared to the DC group. It can be concluded, that treatment with CPLE significantly reduced the alterations of the glomerulus and restored other important parameters, like oxidative stress management. While compared with LD and HD, all the data shows promising results for managing renal complications except the value of GSH of the LD group, which showed a significant difference (≤ 0.05) compared with the CMC group. Thus, our experiments demonstrate a protective role of CPLE in controlling the nephrological complications and glycaemic parameters.
Conclusion
In the current study, STZ-induced diabetic Swiss albino mice that received CPLE treatment were found to have normalized blood sugar levels, cholesterol and triglyceride levels, improved serum and urine parameters of albumin, creatinine, urea and maintained the antioxidant level of the tissue. Histopathological investigations suggest that CPLE treatment helps repair the renal basement membrane, possibly through its anti-inflammatory and antioxidant activities. Although the mechanism of the nephroprotective action of the prepared leaf extract is yet to be established, the preliminary data suggest that CPLE possesses potent antioxidant, antihyperglycemic and antihyperlipidemic activity, thus exhibiting a protective action in STZ-induced DN. Further investigation may elucidate the detailed mechanism of action of CPLE at the cellular and molecular levels.
Acknowledgment
The authors thank the University of North Bengal, Siliguri College, Council of Scientific and Industrial Research (CSIR), Govt. of India, and University Grants Commission.
Conflicts of interest
The authors declare no conflict of interest.
Funding source
The authors thank the University of North Bengal for partial financial support (Ref. No. 2274/R-2021 Dated 24.06.2021) to carry out the works. Support from Siliguri College is hereby acknowledged for SS. Fellowship support from the Council of Scientific and Industrial Research (CSIR), Govt. of India for AJG (Ref. No. 09/285(0089)/2019-EMR-I Dated 07.10.2019) and from University Grants Commission (UGC), Govt. of India for RI (UGC- No. F.16-6 (DEC-2018)/2019(NET/CSIR UGC Ref. No. 711/ (CSIR-UGC NET DEC.2018) and SG (NTA Ref. No.201610130713 Dated 01.04.2021) is also acknowledged.
References
- Gregg EW, Sattar N, Ali MK. The changing face of diabetes complications. Lancet Diabetes Endocrinol. 2016;4(6):537-547. doi:10.1016/S2213-8587(16)30010-9.
CrossRef - Gispen WH, Biessels GJ. Cognition and synaptic plasticity in diabetes mellitus. Trends Neurosci. 2000;23(11):542-549. doi:10.1016/s0166-2236(00)01656-8.
CrossRef - Arora S, Ojha S, Vohora D. Characterization of Streptozotocin-Induced Diabetes Mellitus in Swiss Albino Mice. Glob. J. Pharmacol. 2009;3:81–84.
- Paschou SA, Papadopoulou-Marketou N, Chrousos GP, Kanaka-Gantenbein C. On type 1 diabetes mellitus pathogenesis. Endocr Connect. 2018;7(1):R38-R46. doi:10.1530/EC-17-0347.
CrossRef - Wild S, Roglic G, Green A, Sicree R, King H. Global prevalence of diabetes: estimates for the year 2000 and projections for 2030. Diabetes Care. 2004;27(5):1047-1053. doi:10.2337/diacare.27.5.1047.
CrossRef - Yamamoto T, Nakamura T, Noble NA, Ruoslahti E, Border WA. Expression of transforming growth factor beta is elevated in human and experimental diabetic nephropathy. Proc Natl Acad Sci U S A. 1993;90(5):1814-1818. doi:10.1073/pnas.90.5.1814.
CrossRef - Anders HJ, Huber TB, Isermann B, Schiffer M. CKD in diabetes: diabetic kidney disease versus nondiabetic kidney disease. Nat Rev Nephrol. 2018;14(6):361-377. doi:10.1038/s41581-018-0001-y.
CrossRef - Schena FP, Gesualdo L. Pathogenetic mechanisms of diabetic nephropathy. J Am Soc Nephrol. 2005;16 Suppl 1:S30-S33. doi:10.1681/asn.2004110970.
CrossRef - Tanios BY, Ziyadeh FN. Emerging therapies for diabetic nephropathy patients: beyond blockade of the Renin-Angiotensin system. Nephron Extra. 2012;2(1):278-282. Published 2012 Oct 30. doi:10.1159/000343312.
CrossRef - Dickson LE, Wagner MC, Sandoval RM, Molitoris BA. The proximal tubule and albuminuria: really!. J Am Soc Nephrol. 2014;25(3):443-453. doi:10.1681/ASN.2013090950.
CrossRef - Mori KP, Yokoi H, Kasahara M, et al. Increase of Total Nephron Albumin Filtration and Reabsorption in Diabetic Nephropathy. J Am Soc Nephrol. 2017;28(1):278-289. doi:10.1681/ASN.2015101168.
CrossRef - Molitoris BA. Acute kidney injury. In: Goldman L, Ausiello D, eds. Cecil Medicine. 23rd ed. Saunders Elsevier; 2007.
- Eleazu CO, Eleazu KC, Chukwuma S, Essien UN. Review of the mechanism of cell death resulting from streptozotocin challenge in experimental animals, its practical use and potential risk to humans. J Diabetes Metab Disord. 2013;12(1):60. doi:10.1186/2251-6581-12-60.
CrossRef - Furman BL. Streptozotocin-Induced Diabetic Models in Mice and Rats. Curr Protoc Pharmacol. 2015;70:5.47.1-5.47.20. doi:10.1002/0471141755.ph0547s70.
CrossRef - Balkis Budin S, Othman F, Louis SR, et al. Effect of alpha lipoic acid on oxidative stress and vascular wall of diabetic rats. Rom J Morphol Embryol. 2009;50(1):23-30.
- Ceylan-Isik AF, Fliethman RM, Wold LE, Ren J. Herbal and traditional Chinese medicine for the treatment of cardiovascular complications in diabetes mellitus. Curr Diabetes Rev. 2008;4(4):320-328. doi:10.2174/157339908786241142.
CrossRef - Ezejiofor AN, Udowelle NA, Orisakwe OE. Nephroprotective and antioxidant effect of aqueous leaf extract of Costus afer Ker gawl on cyclosporin-a (Csa) induced nephrotoxicity. Clin. Phytosci. 2016;2:11.
CrossRef - Sanaye M, Sathyapal G, Kulkarni YA. Effect of Costus pictus per se and in combination with Metformin and Enalapril in streptozotocin induced diabetic nephropathy in rats. J Diabetes Metab Disord. 2022;21(2):1349-1358. doi:10.1007/s40200-022-01065-5.
CrossRef - Rice-Evans CA, Miller NJ, Paganga G. Structure-antioxidant activity relationships of flavonoids and phenolic acid. Free Radic Biol Med. 1996;20(7):933-956. doi:10.1016/0891-5849(95)02227-9.
CrossRef - Majumdar M, Parihar PS. Antibacterial, antioxidant and antiglycation potential of Costus pictus from southern region, India. Asian J. Plant Sci. Res. 2012;2(2):95–101.
CrossRef - Ashwini S, Bobby Z, Joseph M, Jacob SE, Padmapriya R. Insulin plant (Costus pictus) extract improves insulin sensitivity and ameliorates atherogenic dyslipidaemia in fructose induced insulin resistant rats: molecular mechanism. J. Funct. Foods. 2015;17:749–760.
CrossRef - Lesjak M, Beara I, Simin N, et al. Antioxidant and anti-inflammatory activities of quercetin and its derivatives. J. Funct. Foods. 2018;40:68–75.
CrossRef - Huang X, Shi Y, Chen H, et al. Isoliquiritigenin prevents hyperglycemia-induced renal injuries by inhibiting inflammation and oxidative stress via SIRT1-dependent mechanism. Cell Death Dis. 2020;11(12):1040. doi:10.1038/s41419-020-03260-9.
CrossRef - Aldahmash BA, El-Nagar DM, Ibrahim KE, Metwaly MS. Biotin amelioration of nephrotoxicity in streptozotocin-induced diabetic mice. Saudi J Biol Sci. 2015;22(5):564-569. doi:10.1016/j.sjbs.2015.03.003.
CrossRef - Sakaguchi K, Takeda K, Maeda M, et al. Glucose area under the curve during oral glucose tolerance test as an index of glucose intolerance. Diabetol Int. 2015;7(1):53-58. doi:10.1007/s13340-015-0212-4.
CrossRef - Martin SS, Blaha MJ, Elshazly MB, et al. Comparison of a novel method vs the Friedewald equation for estimating low-density lipoprotein cholesterol levels from the standard lipid profile. JAMA. 2013;310(19):2061-2068. doi:10.1001/jama.2013.280532.
CrossRef - Dutta S, Chakraborty AK, Dey P, et al. Amelioration of CCl4 induced liver injury in swiss albino mice by antioxidant rich leaf extract of Croton bonplandianus Baill. PLoS One. 2018;13(4):e0196411. doi:10.1371/journal.pone.0196411.
CrossRef - Heath RL, Packer L. Reprint of: Photoperoxidation in Isolated Chloroplasts I. Kinetics and Stoichiometry of Fatty Acid Peroxidation. Arch Biochem Biophys. 2022;726:109248. doi:10.1016/j.abb.2022.109248.
CrossRef - Misra HP, Fridovich I. The role of superoxide anion in the autoxidation of epinephrine and a simple assay for superoxide dismutase. J Biol Chem. 1972;247(10):3170-3175.
CrossRef - Rahman I, Kode A, Biswas SK. Assay for quantitative determination of glutathione and glutathione disulfide levels using enzymatic recycling method. Nat Protoc. 2006;1(6):3159-3165. doi:10.1038/nprot.2006.378.
CrossRef - Luck H. Catalase. In: Bergmeyer HU, Ed. Method of Enzymatic Analysis. Academic Press; 885-894. doi: org/10.1016/B978-0-12-395630-9.50158-4.
CrossRef - Cardiff RD, Miller CH, Munn RJ. Manual hematoxylin and eosin staining of mouse tissue sections. Cold Spring Harb Protoc. 2014;2014(6):655-658. doi:10.1101/pdb.prot073411.
CrossRef - Wang GG, Lu XH, Li W, Zhao X, Zhang C. Protective Effects of Luteolin on Diabetic Nephropathy in STZ-Induced Diabetic Rats. Evid Based Complement Alternat Med. 2011;2011:323171. doi:10.1155/2011/323171.
CrossRef - Gireesh G, Thomas SK, Joseph B, Paulose CS. Antihyperglycemic and insulin secretory activity of Costus pictus leaf extract in streptozotocin induced diabetic rats and in in vitro pancreatic islet culture. J Ethnopharmacol. 2009;123(3):470-474. doi:10.1016/j.jep.2009.03.026.
CrossRef - Remya R, Daniel M. Phytochemical and pharmacognostic investigation of anti-diabetic Costus pictus D. Don. Int J Pharm Bio Med Res. 2013;3(1):30-39.
- Tienda-Vázquez MA, Morreeuw ZP, Sosa-Hernández JE, et al. Nephroprotective Plants: A Review on the Use in Pre-Renal and Post-Renal Diseases. Plants (Basel). 2022;11(6):818. doi:10.3390/plants11060818.
CrossRef - Do QD, Angkawijaya AE, Tran-Nguyen PL, et al. Effect of extraction solvent on total phenol content, total flavonoid content, and antioxidant activity of Limnophila aromatica. J Food Drug Anal. 2014;22(3):296-302. doi:10.1016/j.jfda.2013.11.001.
CrossRef - Truong DH, Nguyen DH, Ta NTA, Bui AV, Do TH, Nguyen HC. Evaluation of the use of different solvents for phytochemical constituents, antioxidants, and in vitro anti-inflammatory activities of Severinia buxifolia. Journal of food quality. 2019.
CrossRef - Zafar M, Naqvi SN. Effects of STZ-induced diabetes on the relative weights of kidney, liver, and pancreas in albino rats: a comparative study. Int J Morphol. 2010;28(1):135-142.
CrossRef - Cheng D, Liang B, Li Y. Antihyperglycemic effect of Ginkgo biloba extract in streptozotocin-induced diabetes in rats. Biomed Res Int. 2013;2013:162724. doi:10.1155/2013/162724.
CrossRef - Patel AN, Bandwane DD, Mhetre NK. Pomegranate (Punica granatum Linn.) leaves attenuate disturbed glucose homeostasis and hyperglycemia mediated hyperlipidemia and oxidative stress in streptozotocin induced diabetic rats. EurJ Integr Med. 2014;6:307-321.
CrossRef - Nesbitt KN. An overview of diabetic nephropathy. J Pharm Prac. 2004;17(1):75-79.
CrossRef - Viswanathan V, Snehalatha C, Kumutha R, Jayaraman M, Ramachandran A. Serum albumin levels in different stages of type 2 diabetic nephropathy patients. Indian J Nephrol. 2004;14:89-92.
CrossRef - King GL, Loeken MR. Hyperglycemia-induced oxidative stress in diabetic complications. Histochem Cell Biol. 2004;122(4):333-338. doi:10.1007/s00418-004-0678-9.
CrossRef - Niedowicz DM, Daleke DL. The role of oxidative stress in diabetic complications. Cell Biochem Biophys. 2005;43(2):289-330. doi:10.1385/CBB:43:2:289.
CrossRef

