
Manuscript accepted on :10-01-2024
Published online on: 09-02-2024
Plagiarism Check: Yes
Reviewed by: Dr. Ahemed Flayyih Hasan Aljanabe and Dr. Hany Akeel
Second Review by: Dr. Loai Aljerf
Final Approval by: Dr. Patorn Promchai
Kasimu Ghandi Ibrahim 1,2,3* , Eliton Chivandi3 and Kennedy Honey Erlwanger3
1Department of Basic Medical and Dental Sciences, Faculty of Dentistry, Zarqa University, P.O. Box 2000, Zarqa 13110, Jordan.
2Department of Physiology, Faculty of Basic Medical Sciences, College of Health Sciences, Usmanu Danfodiyo University, PMB 2254, Sokoto 84001, Nigeria.
3School of Physiology, Faculty of Health Sciences, University of the Witwatersrand, 7 York Road, Parktown 2198, Johannesburg, South Africa.
Corresponding Author E-mail: kibrahim@zu.edu.jo
DOI : https://dx.doi.org/10.13005/bpj/2836
Abstract
Fenofibrate, a PPAR α agonist used in the treatment of hyperlipidaemia is known to prevent diabetes and its complications. It is cautiously used during pregnancy and in neonates due to its potential for teratogenesis. The suckling period is a critical window for developmental programming. Drugs with antimetabolic syndrome activities have been used during critical developmental periods to program for protection against metabolic syndrome or its components. We evaluated the long-term metabolic effects of fenofibrate when administered during suckling and whether it would prevent the poor metabolic outcomes associated with high fructose intake in adolescent rats. A total of 119, 6-day-old (male and female) Sprague Dawley pups were randomly allocated to four groups and either orally gavaged with 10ml.kg-1 DMSO (0.5%), 100mg.kg-1 fenofibrate, 20% (w/v) fructose or both fructose and fenofibrate till 21 days after birth (PND) 21. Following weaning onto standard commercial rat cubes, the groups were split up further into two based on their drinking fluid: either fructose (20%, w/v) or tap water till PND 63 when they were subjected to an overnight fast before being terminated. Blood was taken for hormone analysis. The kidneys, pancreas, liver and visceral fat pad were weighed. Hepatic tissue was stored at -20ºC until quantification of hepatic fat content. Although the rats gained weight significantly (p<0.0001) throughout the study period, there were no significant differences in terminal body weights across the groups (p>0.05). The interventions did not significantly (p>0.05) alter concentrations of blood glucose, adiponectin and insulin. In both sexes, the HOMA-IR, liver lipids and visceral masses were similar in the different treatment groups. Fenofibrate administered to suckling rats did not adversely impact health of the study rats. It may therefore be safe for use in neonates.
Keywords
Fructose; Fenofibrate; Metabolic Syndrome; Neonates; Suckling Period
Download this article as:| Copy the following to cite this article: Ibrahim K. G, Chivandi E, Erlwanger K. H. The Impact of Administration of Fenofibrate During Suckling on Glucose Homeostasis and Programming of Metabolic Function in Adolescent Sprague Dawley Rats. Biomed Pharmacol J 2024;17(1). |
| Copy the following to cite this URL: Ibrahim K. G, Chivandi E, Erlwanger K. H. The Impact of Administration of Fenofibrate During Suckling on Glucose Homeostasis and Programming of Metabolic Function in Adolescent Sprague Dawley Rats. Biomed Pharmacol J 2024;17(1). Available from: https://bit.ly/3HVlEAM |
Introduction
Fenofibrate belongs to the class of drugs called fibrates 1 and is a peroxisome proliferator-activated receptor-alpha (PPAR-α) agonist used as an antihyperlipidaemic agent 2, 3. Its main biological action is reducing the levels of blood triglyceride in both fasting and postprandial states 4.
However, in addition to its primary antihyperlipidaemic activity, it has shown additional benefits when used in patients with metabolic syndrome by significantly reducing the likelihood of having serious cardiovascular problems such as incident coronary heart disease, cardiac ischaemia and mortality when used in combination with statins 5. Fenofibrate is also known to protect against diabetes mellitus (DM) and related pathologies 6. By its action of regulating the metabolism of sphingolipid, fenofibrate was shown to protect against the development of DM by modifying the lipids in the pancreas to a less toxic state 7. It also, probably through its anti-inflammatory effect, prevents the development of diabetes-related pathologies such as the progression of retinopathy 8, 9, nephropathy 10, 11 and cardiopathy 12. Fenofibrate also protects against liver diseases including non-alcoholic fatty liver disease 13, 14.
The prevalence of DM and non-alcoholic fatty liver disease (NAFLD) are on the rise globally, driven by environmental factors such as endocrine disrupting chemicals, epigenetics and poor dietary choices especially increased dietary intake of fructose and fat, and physical inactivity 15, 16. Moreover, fructose rich diets have been shown to cause metabolic syndrome, thereby predisposing individuals to insulin resistance (IR) and type II diabetes mellitus (T2DM) 17. The cost of managing diabetes mellitus and NAFLD is huge 18, 19, making it more prudent to prevent their occurrence. Unfortunately, the increased consumption of fruit juices, beverages and confectionaries usually loaded with high fructose, in children and adolescents 20-22 has led to an equally increased incidence of metabolic diseases in those age groups 23.
Studies have shown that the early critical periods of life (when the tissues are highly developmentally plastic) can be epigenetically impacted by the application of stressors like nutritional interventions 24. These interventions then subsequently determine the expression of genes associated with metabolism, and whether these changes will protect or make vulnerable, the individual to developing metabolic derangements in future 25. This is a concept called developmental programming, a central idea in the “developmental origins of health and disease (DOHaD)” hypothesis 26. In rodents, the period of suckling provides a window of opportunity for targeted interventions seeking to induce neonatal metabolic programming 27, 28.
The broad spectrum of metabolic effects exhibited by fenofibrate makes it an ideal choice for use in programming against metabolic dysfunction. However, its use in children, especially neonates is not without concern. Currently, there is limited data on safety, efficacy and dosing of fenofibrate in the paediatric age group 29, 30. Moreover, there is conflicting data on its ability to cross the placenta as shown in a study involving virgin and pregnant rats 31, as well as the fear that it could be both embryotoxic and teratogenic 32-34.
Despite the above concerns, neonates are still exposed to fenofibrate. As a pregnancy class C drug, fenofibrate is prescribed with caution for the treatment of pregnant women with hyperlipidaemia 35, 36, as it may cross the placenta and cause harm to the developing embryo 37. In neonatology, fenofibrate is now being used to boost the effectiveness of phototherapy in clinical management of unconjugated hyperbilirubinemia as a single or twice only oral dose 38, 39 with resultant improvement of symptoms, reduction in hospitalization and no reported side effects after 48 hours 40. However, the extended consequences of this early life exposure to fenofibrate requires further exploration.
In view of the use of fenofibrate in neonates, we investigated the long-term health impact of administering fenofibrate to neonate male and female pups and whether it would affect their response to a postweaning diet high in fructose, in late adolescence.
Materials and methods
Study Site
The research on animals was carried out in the Wits Research Animal Facility (WRAF), while the various assays were done in the laboratories of the Nutrition and Metabolism team of the School of Physiology, University of the Witwatersrand, Johannesburg, South Africa.
Ethical clearance/approval
The conduct and reporting of the research were aligned to the ARRIVE guidelines 41. Ethical approval (Certificate number: AESC2016/04/18/B) for the study protocols was issued by the Animal Ethics Screening Committee of the University of the Witwatersrand. Additionally, strict adherence to international ethical guidelines and standards for the use and welfare of laboratory rodents was ensured in the study.
Chemicals and reagents
The chemical agents for this research were sourced as follows: Dimethyl sulfoxide, DMSO; was from Sigma-Aldrich, Missouri, USA. It was prepared as a 0.5% solution in distilled water. Fenofibrate was from Sigma-Aldrich, Missouri, USA and was dissolved in the vehicle solution and administered as 100mg.kg-1 body mass. Food-grade fructose was purchased from Nature’s Choice (Randvaal, Republic of South Africa). The fructose solution was prepared to a concentration of 20% using distilled water (0.5% DMSO) in the suckling phase of the rats and then in tap water (without DMSO) post-weaning. The chow fed to the rats was sourced from Epol® in Centurion, South Africa.
General care of the study animals
In this study, 6-day old nursing male and female rat pups (Sprague Dawley) were used. The pups were litter mates from fourteen dams obtained from the WRAF. We ensured that the litter size for each dam was between 8-10 pups to avoid the impact of litter size (under- or over-nutrition) on the study 42, 43. There was no intervention in the dams but the pups nursed freely with their own dams in the first phase of the study. The temperature in the allocated room at the WRAF was kept at 26 ± 2ºC (each room had its own separate temperature control) with provision of adequate through and through ventilation. A 12-hour light/dark cycle (lights on at 0700hrs, off at 1900hrs) was used.
At weaning, 21 days after birth (PND 21), the pups were separated from their dams and kept in individually labelled perspex cages, with wire mesh lids and fed standard rat cubes with either plain tap water or a 20% fructose solution. The design of the cages enabled the rats to see each other for welfare socialisation. The dams not used for any further studies.
Study design
This prospective, randomized intervention study was performed in two distinct phases (see Figure 1). Phase one (pre-weaning) of the study extended from postnatal day (PND) 6 to PND 21 during suckling, with the dual aim of inducing metabolic programming with fenofibrate and fructose, and also providing neonatal exposure to fenofibrate in order to monitor any adverse effects either immediately or later in life. The phase two (post-weaning) of the study which lasted for six weeks, commenced on PND 22 until PND 63. The rationale for the post-weaning intervention was to explore the potential impact (increased predisposition or protection) of the initial treatments on how the rats would respond to the post-weaning high fructose.
A total of 119 pups of both sexes (61 males and 58 females) were initially grouped randomly using a split-litter pattern into four and administered with the following treatments per Kg of their body mass (BM):
C – 0.5% DMSO solution
F – fenofibrate, 100mg.kg-1 BM.
FD – 20% fructose solution
FFD- combination of fenofibrate and fructose solution
The treatments were dispensed to the pups once daily through oral gavage, between 9 am and 11 am, using a 10ml.kg-1 BM volume to prevent over-filling of the stomach.
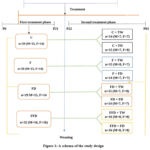 |
Figure 1: A schema of the study design. |
C= 0.5% dimethyl sulfoxide; F=fenofibrate,100mg.kg-1BM; FD=20% fructose solution; FFD=fenofibrate and fructose; TW= tap water; M= males; F= females.
In study phase two (post-weaning) which started on PND 22, the weanling rats from each of the initial four treatment groups were randomly allocated to two equally sized sub-groups which were all fed with normal rat chow. The sub grouping was based on the drinking fluid of the rats, either tap water or a 20% fructose solution provided ad libitum. These phase two interventions were continued for six weeks and ended on PND 63. Therefore, during the second phase, there were eight groups of rats (Fig 1).
Measurement of the body mass of the rats
The rat body masses were recorded every day during the pre-weaning phase in order to ensure correct dosing by making the necessary adjustments to their administered treatments. Post-weaning, the body masses were determined twice weekly for the purpose of growth and general health monitoring. However, only the induction weight at the beginning of the study, the weight at weaning and the terminal weight of the rats are specifically reported on in this manuscript.
Euthanasia and sample preparation
The night prior to the termination of the rats (PND62), they were deprived of food overnight (12h) and their body masses measured and recorded in the morning of PND 63. Before euthanasia, the rats fasting blood glucose (FBG) concentration was determined with a glucometer (Contour Plus ™, Bayer Corporation, Mishawaka, USA) using blood obtained from the tail vein through a pin prick.
Euthanasia was done using sodium pentobarbitone (Euthapent; Kyron Laboratories, South Africa) administered at a dose of 150mg.kg-1 BM intraperitoneally. The thorax of each of the rats was cut open to expose the heart from where about 5-7ml of blood was drawn using a 10ml syringe and emptied gently into tubes for blood collection (Becton Dickinson Vacutainer Systems Europe, Meylan Cedex, France) containing heparin. Plasma was harvested for hormonal analysis by centrifuging the blood in a centrifuge (Hermle Z 230A, B Hermle AG, Germany) for `15 minutes at 4000 x g at 4ºC. The abdomen was incised and the liver, kidneys, pancreas, and visceral fat pad removed and weighed. The hepatic samples were kept in a freezer at -20ºC and susbequently processed for the deremination of its lipid content.
Plasma adiponectin and insulin concentration assays, and calculation of HOMA-IR
Two rat enzyme-linked immunosorbent assay (ELISA) kits specific for adiponectin (Elabscience ® Rat ADP/Acrp30 ELISA kit, Houston, TX, USA) and insulin [Elabscience ® INS (Insulin) ELISA kit, Houston, TX, USA] respectively were used for the quantification of plasma adiponectin and insulin, according to the instructions of the manufacturer. We then calculated the homeostatic model of insulin resistance using the formula proposed by 44:
HOMA-IR = [fasting insulin concentration (ng.dL-1) x fasting glucose concentration (mg.dl-1)]/405 .
Hepatic lipid content quantification
The hepatic lipid content of the rats was assayed gravimetrically using solvent (chloroform and methanol) extraction methods 45. The hepatic fat content was then computed as a percentage of the liver weight.
Statistical analyses
Data
analysis was done using the statistical software GraphPad Prism version 9.0
(GraphPad Software Inc., San Diego, CA,
USA). Data are presented as mean ± standard error of the mean (SEM). Body mass
data was analysed by a repeated measure analysis of variance (ANOVA) while all
other data was analysed using a one-way ANOVA for comparison of the means of
the treatment groups. A Bonferroni post
hoc test to identify
significant differences across the groups. Statistical significance was accepted
at p<0.05.
Results
Tables 1a and 1b display the rats’ body masses at induction, weaning and termination following a pre-weaning administration of fenofibrate and a postweaning high fructose diet. Rats of both sexes gained significant (p<0.0001) body masses through the three time points across all the treatment groups.
Table 1a: Impact of post-weaning diet high in fructose on the body masses of male adolescent rats which had been administered fenofibrate in the suckling phase.
|
Treatment groups |
Induction mass (g) |
Weaning mass (g) |
Terminal mass (g) |
|
C + TW |
13 ± 1.00a |
45 ± 1.40b |
276 ± 12.00c |
|
C + FD |
14 ± 0.48 a |
44 ± 1.10 b |
276 ± 5.20 c |
|
F + TW |
13 ± 0.68 a |
39 ± 1.10 b |
286 ± 11.00 c |
|
F + FD |
14 ± 0.46 a |
41 ± 2.00 b |
238 ± 13.00 c |
|
FD + TW |
15 ± 0.60 a |
45 ± 2.90 b |
303 ± 14.00 c |
|
FD + FD |
15 ± 0.46 a |
45 ± 1.80 b |
259 ± 11.00 c |
|
FFD + TW |
13 ± 0.53 a |
39 ± 1.10 b |
272 ± 16.00 c |
|
FFD + FD |
14 ± 0.49 a |
40 ± 1.60 b |
263 ± 9.10 c |
a,b ,c = Means with different superscripts across rows are significantly different at p< 0.0001 using repeated measures ANOVA. C= 10ml.kg-1 of a 0.5% dimethyl sulfoxide solution, FD= 20% fructose drink, F= fenofibrate, 100mg.kg-1 BM, TW= tap water, FFD= fenofibrate and fructose. The first letters before the addition sign in the designation of the treatment groups indicate the pre-weaning treatment while the letters after the addition sign indicate the post-weaning treatments. Data are expressed as mean ± SEM, n= 7-8 rats in each group.
Table 1b: Impact of a diet high in fructose post-weaning on the body masses of female adolescent rats which had been administered fenofibrate in the suckling phase.
|
Treatment groups |
Induction mass (g) |
Weaning mass (g) |
Terminal mass (g) |
|
C + TW |
12 ± 0.45 a |
43 ± 1.10 b |
206 ± 7.10 c |
|
C + FD |
14 ± 0.38 a |
41 ± 1.50 b |
203 ± 5.80 c |
|
F + TW |
13 ± 0.40 a |
38 ± 1.40 b |
208 ± 7.20 c |
|
F + FD |
13 ± 0.40 a |
36 ± 1.70 b |
192 ± 6.50 c |
|
FD + TW |
13 ± 0.20 a |
45 ± 2.00 b |
211 ± 5.90 c |
|
FD + FD |
13 ± 0.36 a |
42 ± 1.10 b |
215 ± 4.00 c |
|
FFD + TW |
12 ± 0.60 a |
38 ± 1.40 b |
202 ± 6.40 c |
|
FFD + FD |
12 ± 0.50 a |
37 ± 2.00 b |
198 ± 4.80 c |
a,b ,c = Means with different superscripts across rows are significantly different at p< 0.0001 using repeated measures ANOVA. C= 10ml.kg-1 of a 0.5% dimethyl sulfoxide solution, FD= 20% fructose drink, F= fenofibrate, 100mg.kg-1 BM, TW= tap water, FFD= fenofibrate and fructose. The first letters before the addition sign in the designation of the treatment groups indicate the pre-weaning treatment while the letters after the addition sign indicate the post-weaning treatments. Data are expressed as mean ± SEM, n= 7-8 rats in each group.
Tables 2a and 2b show fasting circulating glucose and insulin concentration and the computed HOMA-IR of rats of male and female which received fenofibrate during the pre-weaning phase followed by a high fructose solution as drinking fluid postweaning.
Circulating fasting glucose and insulin concentrations, and HOMA-IR were not significantly different (p>0.05, ANOVA) amongst the treatment groups in both males and females.
Table 2a: Impact of a post-weaning high fructose diet on concentrations of fasting blood glucose and insulin, and the computed HOMA-IR of male adolescent rats administered fenofibrate in the pre-weaning phase
|
Treatment groups |
FBG mg/dl |
Insulin ng/ml |
HOMA-IR |
|
C + TW |
74 ± 3.40 |
4.8 ± 0.05 |
0.89 ± 0.03 |
|
C + FD |
81 ± 4.00 |
4.9 ± 0.06 |
0.97 ± 0.05 |
|
F + TW |
81 ± 5.70 |
5.0 ± 0.07 |
0.99 ± 0.07 |
|
F + FD |
70 ± 2.10 |
5.0 ± 0.07 |
0.87 ± 0.04 |
|
FD + TW |
81 ± 4.50 |
4.9 ± 0.05 |
0.98 ± 0.06 |
|
FD + FD |
73 ± 2.00 |
5.0 ± 0.03 |
0.90 ± 0.03 |
|
FFD + TW |
77 ± 4.60 |
4.4 ± 0.55 |
0.83 ± 0.12 |
|
FFD + FD |
73 ± 2.10 |
4.9 ± 0.03 |
0.88 ± 0.03 |
C= 10ml.kg-1 of a 0.5% dimethyl sulfoxide solution, FD= 20% fructose drink, F= fenofibrate, 100mg.kg-1 BM, TW= tap water, FFD= fenofibrate and fructose. The first letters before the addition sign in the designation of the treatment groups indicate the pre-weaning treatment while the letters after the addition sign indicate the post-weaning treatments. Data are presented as mean ± SEM, n= 7-8 rats.
Table 2b: Impact of a post-weaning diet high in fructose on the concentration of fasting blood glucose and insulin, and the computed HOMA-IR of female adolescent rats administered fenofibrate during the pre-weaning phase
|
Treatment groups |
FBG mg/dl |
Insulin ng/ml |
HOMA-IR |
|
C + TW |
78 ± 3.50 |
4.9 ± 0.05 |
0.94 ± 0.04 |
|
C + FD |
78 ± 2.90 |
4.9 ± 0.05 |
0.94 ± 0.03 |
|
F + TW |
72 ± 1.70 |
5.0 ± 0.04 |
0.90 ± 0.03 |
|
F + FD |
71 ± 2.30 |
5.0 ± 0.04 |
0.87 ± 0.03 |
|
FD + TW |
73 ± 5.20 |
4.9 ± 0.06 |
0.88 ± 0.07 |
|
FD + FD |
72 ± 1.80 |
4.9 ± 0.04 |
0.87 ± 0.02 |
|
FFD + TW |
74 ± 2.70 |
4.9 ± 0.05 |
0.90 ± 0.03 |
|
FFD + FD |
76 ± 2.60 |
4.9 ± 0.05 |
0.92 ± 0.03 |
C= 10ml.kg-1 of a 0.5% dimethyl sulfoxide solution, FD= 20% fructose drink, F= fenofibrate, 100mg.kg-1 BM, TW= tap water, FFD= fenofibrate and fructose. The first letters before the addition sign in the designation of the treatment groups indicate the pre-weaning treatment while the letters after the addition sign indicate the post-weaning treatments. Data are presented as mean ± SEM, n= 7-8 rats in each group.
The impact of a diet high in fructose post-weaning on the liver masses, hepato-somatic indices and hepatic percentage lipid content of adolescent rats gavaged with fenofibrate when they were neonates are presented in Tables 3a and 3b.
The liver masses, hepatosomatic indices and liver lipid content of female and male rats in the different groups were similar (p>0.05, ANOVA) in both sexes.
Table 3a: Impact of a post-weaning diet high in fructose on liver masses, hepatosomatic index and lipid content of adolescent male rats were gavaged with fenofibrate during the neonatal phase.
|
Treatment groups |
Liver mass (g) |
Hepatosomatic index |
Liver lipids (%) |
|
C + TW |
9.6 ± 0.44 |
3.5 ± 0.08 |
7.5 ± 0.06 |
|
C + FD |
9.6 ± 0.28 |
3.5 ± 0.07 |
6.4 ± 1.10 |
|
F + TW |
11 ± 0.69 |
3.7 ± 0.19 |
4.7 ± 0.21 |
|
F + FD |
8.4 ± 0.48 |
3.5 ± 0.11 |
6.9 ± 0.66 |
|
FD + TW |
11 ± 0.50 |
3.6 ± 0.18 |
6.8 ± 0.58 |
|
FD + FD |
9.1 ± 0.42 |
3.5 ± 0.05 |
8.5 ± 0.27 |
|
FFD + TW |
9.8 ± 0.78 |
3.6 ± 0.20 |
7.7 ± 1.00 |
|
FFD + FD |
9.1 ± 0.34 |
3.5 ± 0.05 |
8.4 ± 0.63 |
C= 10ml.kg-1 of a 0.5% dimethyl sulfoxide solution, FD= 20% fructose drink, F= fenofibrate, 100mg.kg-1 BM, TW= tap water, FFD= fenofibrate and fructose. The first letters before the addition sign in the designation of the treatment groups indicate the pre-weaning treatment while the letters after the addition sign indicate the post-weaning treatments. Data are presented as mean ± SEM, n= 7-8 rats in each group.
Table 3b: Impact of a post-weaning diet high fructose on the liver masses, hepatosomatic index and hepatic lipid content of female adolescent rats which received fenofibrate during the neonatal phase.
|
Treatment groups |
Liver mass (g) |
Hepatosomatic index |
Liver lipids (%) |
|
C + TW |
7.4 ± 0.53 |
3.6 ± 0.18 |
9.5 ± 0.39 |
|
C + FD |
7.4 ± 0.26 |
3.7 ± 0.08 |
7.5 ± 0.60 |
|
F + TW |
7.2 ± 0.32 |
3.5 ± 0.09 |
8.7 ± 1.10 |
|
F + FD |
7.3 ± 0.33 |
3.8 ± 0.11 |
8.7 ± 1.10 |
|
FD + TW |
7.6 ± 0.62 |
3.6 ± 0.20 |
10 ± 1.00 |
|
FD + FD |
7.8 ± 0.19 |
3.6 ± 0.06 |
7.5 ± 0.06 |
|
FFD + TW |
7.2 ± 0.31 |
3.6 ± 0.12 |
12 ± 0.91 |
|
FFD + FD |
7.5 ± 0.27 |
3.8 ± 0.09 |
12 ± 1.50 |
C= 10ml.kg-1 of a 0.5% dimethyl sulfoxide solution, FD= 20% fructose drink, F= fenofibrate, 100mg.kg-1 BM, TW= tap water, FFD= fenofibrate and fructose. The first letters before the addition sign in the designation of the treatment groups indicate the pre-weaning treatment while the letters after the addition sign indicate the post-weaning treatments. Data are presented as mean ± SEM, n= 7-8 rats in each group.
Tables 4a and 4b show the effect of a post-weaning high fructose diet on the absolute (g) and relative (% body mass) masses of the kidneys, pancreas and abdominal visceral fat mass of male and female adolescent rats that were administered with fenofibrate as neonates.
In both sexes, there was no significant difference (p>0.05) seen in the above parameters of the different intervention groups.
Table 4a: Effect of a post-weaning high fructose diet on `masses of the kidneys, pancreata and abdominal visceral fat masses of adolescent male Sprague Dawley rats administered with fenofibrate as neonates
|
Treatment groups |
Kidneys (g) |
Kidneys %body mass |
Pancreas (g) |
Pancreas % body mass |
Visceral fat pad (g) |
Visceral Fat Pad % body mass |
|
C + TW |
2.0 ± 0.08 |
0.72 ± 0.01 |
0.96 ± 0.08 |
0.35 ± 0.04 |
3.0 ± 0.22 |
1.10 ± 0.11 |
|
C + FD |
1.9 ± 0.06 |
0.71 ± 0.02 |
1.0 ± 0.06 |
0.36 ± 0.02 |
2.9 ± 0.19 |
1.00 ± 0.02 |
|
F + TW |
2.2 ± 0.06 |
0.71 ± 0.01 |
0.93 ± 0.05 |
0.40 ± 0.04 |
3.2 ± 0.30 |
1.10 ± 0.13 |
|
F + FD |
2.2 ± 0.14 |
0.77 ± 0.03 |
0.91 ± 0.07 |
0.35 ± 0.02 |
2.1 ± 0.37 |
0.86 ± 0.12 |
|
FD + TW |
2.2 ± 0.07 |
0.72 ± 0.02 |
1.2 ± 0.13 |
0.40 ± 0.02 |
3.2 ± 0.55 |
1.10 ± 0.22 |
|
FD + FD |
2.2 ± 0.14 |
0.86 ± 0.01 |
0.92 ± 0.08 |
0.35 ± 0.04 |
2.6 ± 0.34 |
1.00 ± 0.10 |
|
FFD + TW |
1.9 ± 0.11 |
0.72 ± 0.02 |
1.0 ± 0.05 |
0.38 ± 0.03 |
3.5 ± 0.44 |
1.30 ± 0.19 |
|
FFD + FD |
1.9 ± 0.07 |
0.71 ± 0.02 |
1.0 ± 0.05 |
0.40 ± 0.02 |
3.0 ± 0.38 |
1.10 ± 0.12 |
C= 10ml.kg-1 of a 0.5% dimethyl sulfoxide solution, FD= 20% fructose drink, F= fenofibrate, 100mg.kg-1 BM, TW= tap water, FFD= fenofibrate and fructose. The first letters before the addition sign in the designation of the treatment groups indicate the pre-weaning treatment while the letters after the addition sign indicate the post-weaning treatments. Data are presented as mean ± SEM, n= 7-8 rats in each group.
Table 4b: Impact of a post-weaning diet high in fructose on the masses of the kidneys, pancreata and abdominal visceral fat masses of adolescent female Sprague Dawley rats administered with fenofibrate as neonates.
|
Treatment |
Kidneys (g) |
Kidneys % body mass |
Pancreas (g) |
Pancreas % body mass |
Visceral fat pad
|
Visceral fat pad % Body mass |
|
C + TW |
1.5 ± 0.05 |
0.71 ± 0.01 |
0.77 ± 0.03 |
0.38 ± 0.02 |
5.0 ± 0.47 |
2.4 ± 0.22 |
|
C + FD |
1.5 ± 0.03 |
0.74 ± 0.01 |
0.89 ± 0.05 |
0.44 ± 0.03 |
4.4 ± 0.58 |
2.1 ± 0.24 |
|
F + TW |
1.5 ± 0.03 |
0.73 ± 0.01 |
0.84 ± 0.04 |
0.47 ± 0.01 |
3.7 ± 0.37 |
2.1 ± 0.32 |
|
F + FD |
1.6 ± 0.03 |
0.78 ± 0.01 |
0.88 ± 0.04 |
0.41 ± 0.03 |
4.2 ± 0.29 |
1.9 ± 0.20 |
|
FD + TW |
1.5 ± 0.03 |
0.72 ± 0.01 |
0.94 ± 0.08 |
0.44 ± 0.03 |
4.2 ± 0.54 |
2.0 ± 0.31 |
|
FD + FD |
1.6 ± 0.03 |
0.74 ± 0.01 |
0.88 ± 0.04 |
0.41 ± 0.02 |
5.1 ± 0.23 |
2.4 ± 0.10 |
|
FFD + TW |
1.5 ± 0.05 |
0.72 ± 0.01 |
0.85 ± 0.03 |
0.38 ± 0.02 |
4.3 ± 0.49 |
2.1 ± 0.15 |
|
FFD + FD |
1.6 ± 0.05 |
0.75 ± 0.01 |
0.94 ± 0.08 |
0.49 ± 0.01 |
5.0 ± 0.50 |
2.0 ± 0.21 |
C= 10ml.kg-1 of a 0.5% dimethyl sulfoxide solution, FD= 20% fructose drink, F= fenofibrate, 100mg.kg-1 BM, TW= tap water, FFD= fenofibrate and fructose. The first letters before the addition sign in the designation of the treatment groups indicate the pre-weaning treatment while the letters after the addition sign indicate the post-weaning treatments. Data are presented as mean ± SEM, n= 7-8 rats in each group.
The impact of a post-weaning diet high in fructose on the fasting plasma levels of adiponectin in male and female rats which received fenofibrate during the suckling phase are displayed in Figures 2a and 2b.
The fasting plasma concentration of adiponectin not significantly different (p>0.05) in both sexes of the different treatment groups.
 |
Figure 2a: Effect of post-weaning high fructose diet on the fasting plasma concentration of adiponectin in adolescent male rats administered with fenofibrate as neonates |
C= 10ml.kg-1 of a 0.5% dimethyl sulfoxide solution, FD= 20% fructose drink, F= fenofibrate, 100mg.kg-1 BM, TW= tap water, FFD= fenofibrate and fructose. The first letters before the addition sign in the designation of the treatment groups indicate the pre-weaning treatment while the letters after the addition sign indicate the post-weaning treatments. Data are presented as mean ± SEM, n= 7-8 rats in each group.
 |
Figure 2b: Effect of post-weaning high fructose diet on the fasting plasma concentration of adiponectin in adolescent female rats administered with fenofibrate as neonates |
C= 10ml.kg-1 of a 0.5% dimethyl sulfoxide solution, FD= 20% fructose drink, F= fenofibrate, 100mg.kg-1 BM, TW= tap water, FFD= fenofibrate and fructose. The first letters before the addition sign in the designation of the treatment groups indicate the pre-weaning treatment while the letters after the addition sign indicate the post-weaning treatments. Data are presented as mean ± SEM, n= 7-8 rats in each group.
Discussion
Currently, the global epidemic of metabolic syndrome affects all age groups 46 and is partially driven by an increased consumption of fructose rich diets 47, 48. However, in this our current study, our postweaning high fructose intervention failed to produce metabolic dysfunction in the adolescent rats. All the metabolic parameters we measured were similar in both sexes regardless of the treatment. A number of factors which we will discuss shortly could be responsible for this finding. However, of significance, is the fact that the administration of fenofibrate to suckling rats did not produce any overt side effects in the rats, at least until late adolescence when they were terminated.
We consider this as a significant finding because it adds to the evidence that supports the safe use of fenofibrate in the neonatal and young age groups. Even though, fenofibrate is currently used with caution together with phototherapy as a therapeutic approach for management of neonatal hyperbilirubinaemia 38-40, there is always the fear of its embryotoxic and teratogenic potential 32-34. It is therefore used as a single or at most twice-only dosage.
In our study, we administered 100mg of fenofibrate per kg body mass to the suckling pups daily for 15 days starting from PND6 to PND 21. It has been shown that the early postnatal days in rats correspond to the last trimester of gestation in humans 49, 50. The period within which we administered our pre-weaning treatments is a period of developmental plasticity that is similar to the last pregnancy trimester and the early postnatal years (approximately three years old) in humans. Interestingly, we did not observe any overt or biochemical adverse effects in the adolescent rats. This finding can be interpreted to suggest that fenofibrate may actually be safe and could therefore be used with more confidence in pregnant women with dyslipidaemia and in neonates for the treatment of hyperbilirubinaemia and other conditions. However, it is notable that the study did not use pregnant rats and hence the transplacental pharmacodynamics and maternal metabolism of fenofibrate would need to also be taken into consideration.
In the present study, we fed weanling rats with fructose (20%) solution for 6 weeks without any resultant induction of metabolic dysfunction. In both sexes of rats, the measured metabolic parameters including the body masses, visceral fat pads, fasting blood glucose and insulin concentrations, computed HOMA-IR, plasma concentration of adiponectin and liver lipid content were similarly comparable between the different treatment groups. This finding is at variance with that of several studies where in rats, the administration of a 20% fructose caused metabolic syndrome. Feeding Sprague Dawley rats with 20% fructose water has previously been shown to cause increased blood lipids and glucose concentrations, visceral fat mass, hypoinsulinaemia and insulin resistance 51 and increased liver lipids content 52. In another study, 20% fructose solution administered for 60 days to Sprague Dawley rats produced hyperinsulinemia, insulin resistance, and an increase in low-density lipoprotein (LDL), visceral fat, and significantly increased the liver weights of the rats 53.
Adiponectin, a circulating hormone secreted by the adipose tissue exerts protective effects against inflammation and modulates the endocrine system, by enhancing insulin sensitivity in obese animals as well as in humans 54. Disruption of glucose homeostasis by a high fructose diet has been shown to decrease the concentration of adiponectin 55. However, in our study there were no differences in adiponectin concentrations of the rats across the different groups suggesting that the fenofibrate and high fructose did not impair adiponectin homeostasis and function.
In the current study, we targeted the late adolescent and early adulthood group to enable us to explore the programming outcomes of neonatal administration of both fructose and fenofibrate when accompanied by a postweaning fructose diet. Accordingly, the rats were placed on fructose in the active growth phase of their lives. The metabolic rate of nursing rat pups and weanling/growing rats is greater compared to adult rats because of their higher ratio of body surface area to volume, which leads to oxidation of the excess consumed fructose and utilization for growth and maintenance of homeostasis without inducing metabolic dysfunction 56. Younger rats have also been reported to be protected from the deleterious consequences of high fructose diets through some adaptive mechanism that involves the increased efficiency of GLuT 4 transport proteins for glucose 57, 58. Up till weaning, the GLuT 5 fructose transporters in the small intestines are still very few and immature 59-61 and might not effectively ensure the absorption of fructose from the GIT. However, the fructose transporters may undergo precocious maturation if fructose is introduced early in life 62, 63, as we did in our study. Unfortunately, we did not assay for the GLuT 5 transporters in this study, and we therefore do not know whether their expression was increased due to our neonatal fructose administration. Future studies should explore this possibility.
The data on body mass gain and organ weights also support the safety of fenofibrate use during suckling. This is because all the rats gained weight significantly from induction through weaning and at termination of the study indicating there was no unfavourable impact on growth and development of the experimental animals. Moreover, the masses of the organs that were weighed (liver, kidneys, pancreas) remained the same irrespective of the treatments administered. The body mass and organ masses of experimental animals are surrogate markers in the determination of toxicity of administered chemicals and drugs 64. Moreover, alterations in weights of organs are usually associated with treatment-related effects and can give information on potential target organs for the chemical or drug 65. However, changes in organ weights may actually be indicators of the overall body mass changes induced by the chemical and not necessarily related to the specific organ 66. Hence, the use of relative masses of the organs to the overall body mass is more appropriate 67. In our study, relative masses of the weighed organs were not different across treatments, suggesting the safety of fenofibrate administration in neonates.
Additionally, similar body mass of the rats drinking fructose solution compared to those drinking tap water were observed. This is not surprising because it has been previously shown that fructose-induced changes in body mass usually appear during adulthood when the rats are around 100 days old 68. However, at the time of the rats were terminated, they were 63 days old (late adolescence) and therefore had not yet experienced that excess accumulation of fats. Moreover, it has been suggested that a combination of fructose and a high fat diet better develops the obese phenotype than the use of fructose alone 69.
Fenofibrate has been shown to be useful in preventing diabetes and its related complications. This is one of the reasons we used it with the aim of programming for protection against the development of a high-fructose-induced disruption of glucose homeostasis. Even though, there was no increase in fasting blood glucose concentration, fasting insulin and the computed HOMA-IR, we are unable to say that this is a result of the protective effects of fenofibrate. This is because the high fructose diet did not also produce any effects in the control groups as earlier mentioned. Therefore, there is a need for further investigation using a different model of metabolic syndrome, perhaps in older rats.
Finally, a gene expression study of some of the genes involved in carbohydrate and lipid metabolism such as PPAR or fatty acid synthase (FAS) would probably have shed more light on the impact of fenofibrate at the mechanistic level. Additionally, global DNA methylation or specific methylation studies would have provided evidence on whether fenofibrate programmed for metabolic function in the rats or not. Indeed, these are worthwhile investigations that should form the core of future research in this area.
Conclusion
Neonatal administration of fenofibrate did not subsequently adversely affect the health of the adolescent rats with or without a high fructose diet and may therefore be safe for use in neonates.
Acknowledgements
We acknowledge the assistance we received from the members of the Nutrition and Metabolism Research Team of the School of Physiology during the termination of the rats and sample collection. We are also grateful to the employees in the University of the Witwatersrand Animal Research Facility (WRAF) for their help with caring for the rodents.
Conflict of Interest
The authors declare that they have no conflict of interest.
Funding Sources
KGI (Grant number: 001.251.8521101.5121105.000000. 0000000000.4550) was a recipient of grants from the Faculty of Health Sciences Research Committee of the University of the Witwatersrand, Johannesburg while KHE (Grant number: IRF 2010041900009) received grants from the National Research Foundation of South Africa).
References
- Uchida A, Slipchenko MN, Cheng J-X, Buhman KK. Fenofibrate, a peroxisome proliferator-activated receptor α agonist, alters triglyceride metabolism in enterocytes of mice. Biochim Biophys Acta (BBA)-Mol Cell Biol. Lipids., 2011;1811(3):170-6; https://doi.org/10.1016/j.bbalip.2010.12.011.
CrossRef - Gunwal D, Dutt B, Choudhary M. A comprehensive review on the drug: fenofibrate. Int. J. Res. Pharm. Sci., 2021; 12(3):2164-72.
CrossRef - Mahmoudi A, Jamialahmadi T, Johnston TP, Sahebkar A. Impact of fenofibrate on NAFLD/NASH: a genetic perspective. Drug Discov. Today., 2022; 27(8):2363-72.
CrossRef - Lawitz EJ, Bhandari BR, Ruane PJ, Kohli A, Harting E, Ding D, et al. Fenofibrate mitigates hypertriglyceridemia in nonalcoholic steatohepatitis patients treated with cilofexor/firsocostat. Clin. Gastroenterol. Hepatol., 2023; 21(1):143-52. e3.
CrossRef - Kim NH, Han KH, Choi J, Lee J, Kim SG. Use of fenofibrate on cardiovascular outcomes in statin users with metabolic syndrome: propensity matched cohort study. BMJ, 2019; 366: l5125; doi: https://doi.org/10.1136/bmj.l5125.
CrossRef - Jin L, Hua H, Ji Y, Jia Z, Peng M, Huang S. Anti-inflammatory role of fenofibrate in treating diseases. Biomolecules and Biomedicine, 2023; 23(3):376-91; doi: 10.17305/bb.2022.8534
CrossRef - Holm LJ, Haupt-Jorgensen M, Giacobini JD, Hasselby JP, Bilgin M, Buschard K. Fenofibrate increases very-long-chain sphingolipids and improves blood glucose homeostasis in NOD mice. Diabetologia, 2019;62:2262-72; https://doi.org/10.1007/s00125-019-4973-z.
CrossRef - Knickelbein JE, Abbott AB, Chew EY. Fenofibrate and diabetic retinopathy. Curr. Diab. Rep., 2016; 16:1-6; https://doi.org/10.1007/s11892-016-0786-7.
CrossRef - Kim NH, Choi J, Kim YH, Lee H, Kim SG. Addition of fenofibrate to statins is associated with risk reduction of diabetic retinopathy progression in patients with type 2 diabetes and metabolic syndrome: A propensity-matched cohort study. Diabetes Metab., 2023; 49(3):101428.
CrossRef - Cheng Y, Zhang X, Ma F, Sun W, Wang W, Yu J, et al. The role of Akt2 in the protective effect of fenofibrate against diabetic nephropathy. Int. J. Biol. Sci., 2020; 16(4):553-67; doi: 10.7150/ijbs.40643
CrossRef - Feng X, Gao X, Wang S, Huang M, Sun Z, Dong H, et al. PPAR-α agonist fenofibrate prevented diabetic nephropathy by inhibiting M1 macrophages via improving endothelial cell function in db/db mice. Front. Med., 2021; 8:652558; | https://doi.org/10.3389/fmed.2021.
CrossRef - Cevey ÁC, Pieralisi AV, Donato M, Rada J, Gelpi RJ, Mirkin GA, et al. Macrophages Mediate Healing Properties of Fenofibrate in Experimental Chagasic Cardiomyopathy. ACS Infect. Dis., 2023; 9(2):213-20; https://doi.org/10.1021/acsinfecdis.2c00535.
CrossRef - Huang K, Du M, Tan X, Yang L, Li X, Jiang Y, et al. PARP1-mediated PPARα poly (ADP-ribosyl) ation suppresses fatty acid oxidation in non-alcoholic fatty liver disease. J. Hepatol., 2017; 66(5):962-77; https://doi.org/10.1016/j.jhep.2016.11.020.
CrossRef - Shiri-Sverdlov R, Wouters K, van Gorp PJ, Gijbels MJ, Noel B, Buffat L, et al. Early diet-induced non-alcoholic steatohepatitis in APOE2 knock-in mice and its prevention by fibrates. J. Hepatol., 2006; 44(4):732-41.
CrossRef - Vetrano E, Rinaldi L, Mormone A, Giorgione C, Galiero R, Caturano A, et al. Non-alcoholic fatty liver disease (NAFLD), type 2 diabetes, and non-viral hepatocarcinoma: Pathophysiological mechanisms and new therapeutic strategies. Biomedicines, 2023; 11(2):468; https://doi.org/10.3390/biomedicines11020468.
CrossRef - Aljerf L, Alhaffar I. Salivary distinctiveness and modifications in males with diabetes and Behçet’s disease. Biochem. Res. Int., 2017; 2017:1-12; https://doi.org/0.1155/2017/9596202.
CrossRef - Johnson RJ, Lanaspa MA, Sanchez-Lozada LG, Tolan D, Nakagawa T, Ishimoto T, et al. The fructose survival hypothesis for obesity. Philos. Trans. R. Soc. Lond. B., 2023; 378(1885):20220230; https://doi.org/10.1098/rstb.2022.0230.
CrossRef - Dokmak A, Lizaola-Mayo B, Trivedi HD. The impact of nonalcoholic fatty liver disease in primary care: a population health perspective. Am. J. Med., 2021; 134(1):23-9; https://doi.org/10.1016/ j.amjmed. 2020.08.010.
CrossRef - Misra A, Gopalan H, Jayawardena R, Hills AP, Soares M, Reza‐Albarrán AA, et al. Diabetes in developing countries. J. Diabetes, 2019; 11(7):522-39; https://doi.org/10.1111/753-0407.12913.
CrossRef - Wright LS, Rifas-Shiman SL, Oken E, Litonjua AA, Gold DR. Prenatal and early life fructose, fructose-containing beverages, and midchildhood asthma. Ann. Am. Thorac. Soc., 2018; 15(2):217-24; https://doi.org/10.1513/AnnalsATS.201707-530OC.
CrossRef - Goran MI, Dumke K, Bouret SG, Kayser B, Walker RW, Blumberg B. The obesogenic effect of high fructose exposure during early development. Nat. Rev. Endocrinol., 2013; 9(8):494-500.
CrossRef - Yu R, Yang B, Cai L, Lu X, Wang X. Excess free fructose beverages and allergy in children and adolescents: Results from NHANES 2005-2006. Ann. Fam. Med., 2018; 16(5):408-18; https://doi.org/10.1370/afm.2292.
CrossRef - Jahangiry L, Aune D, Farhangi MA. Screen time and the risk of metabolic syndrome among children and adolescents: A systematic review and dose-response meta-analysis. Nutr. Metab. Cardiovasc. Dis., 2022; 32:2483-92; https://doi.org/10.1016/j.numecd.2022.08.004.
CrossRef - Vickers M. Early life nutrition and neuroendocrine programming. Neuropharmacology, 2022; 205:108921; https://doi.org/10.1016/j.neuropharm.2021.
CrossRef - Matsumoto C. The impacts of secondhand smoke on future generations and the responsibility of society as a whole to protect the well-being of our future descendants. Hypertens. Res., 2023; 46(4):887-9; https://doi.org/10.1038/s41440-023-01208-y.
CrossRef - Lapehn S, Paquette AG. The placental epigenome as a molecular link between prenatal exposures and fetal health outcomes through the DOHaD hypothesis. Curr. Environ. Health Rep., 2022; 9(3):490-501; https://doi.org/10.1007/s40572-022-00354-8.
CrossRef - Colldén G, Caron E, Bouret SG. Neonatal leptin antagonism improves metabolic programming of postnatally overnourished mice. Int. J. Obesity, 2022; 46(6):1138-44; https://doi.org/10.038/s41366-022-01093-4.
CrossRef - Parra-Vargas M, Bouret SG, Bruning JC, de Moura EG, Garland Jr T, Lisboa PC, et al. The long-lasting shadow of litter size in rodents: litter size is an underreported variable that strongly determines adult physiology. Mol. Metab., 2023; 71:101707; https://doi.org/10.1016/j.molmet.2023.
CrossRef - Roth GA, Mensah GA, Johnson CO, Addolorato G, Ammirati E, Baddour LM, et al. Global burden of cardiovascular diseases and risk factors, 1990–2019: update from the GBD 2019 study. J. Am. Coll. Cardiol., 2020; 76(25):2982-3021.
- Butt WZ, Yee JK. The role of non-statin lipid-lowering medications in youth with hypercholesterolemia. Curr. Atheroscler. Rep., 2022; 24(5):379-89; https://doi.org/10.1007/s11883-022-01013-x.
CrossRef - Soria A, Bocos C, Herrera E. Opposite metabolic response to fenofibrate treatment in pregnant and virgin rats. J. Lipid Res., 2002; 43(1):74-81.
CrossRef - Gupta M, Liti B, Barrett C, Thompson PD, Fernandez AB. Prevention and management of hypertriglyceridemia-induced acute pancreatitis during pregnancy: a systematic review. Am. J. Med., 2022; 135(6):709-14.
CrossRef - Pieper PG, Elkayam U, Eskandar J, Ruys TP. Cardiovascular Drugs in Pregnancy and Lactation. In: Elkayam U, editor. Cardiac Problems in Pregnancy. New Jersey: Wiley; 2019. Pp. 456-490.
CrossRef - Sunman H, Canpolat U, Sahiner L, Aytemir K. Use of fenofibrate during the first trimester of unplanned pregnancy in a patient with hypertriglyceridemia. Ann. Pharmacother., 2012; 46(2):e5.
CrossRef - Ahmed SS. An update on pharmacotherapy of dyslipidemia for adults. J. Adv. Med. Med. Res., 2020; 32(8):86-109.
CrossRef - Kleess LE, Janicic N. Severe hypertriglyceridemia in pregnancy: a case report and review of the literature. AACE Clin. Case Rep., 2019; 5(2):e99-e103.
CrossRef - Lewek J, Banach M. Dyslipidemia Management in Pregnancy: Why Is It not Covered in the Guidelines? Curr. Atheroscler. Rep., 2022; 24:547-56.
CrossRef - Shabo SK, Gargary KH, Erdeve O. Indirect Neonatal Hyperbilirubinemia and the Role of Fenofibrate as an Adjuvant to Phototherapy. Children, 2023; 10(7):1192.
CrossRef - Awad MH, Amer S, Hafez M, Nour I, Shabaan A. Fenofibrate as an adjuvant to phototherapy in pathological unconjugated hyperbilirubinemia in neonates: a randomized control trial. J. Perinatol., 2021; 41(4):865-72.
CrossRef - Saadat SH, Goodarzi R, Gharaei B. Oral fenofibrate for hyperbilirubinemia in term neonates: A single-blind randomized controlled trial. J. Clin. Transl. Sci., 2023; 7(1):e85; : https://doi.org/10.1017/cts.2023.35.
CrossRef - Percie du Sert N, Hurst V, Ahluwalia A, Alam S, Avey MT, Baker M, et al. The ARRIVE guidelines 2.0: Updated guidelines for reporting animal research. J. Cereb. Blood Flow Metab., 2020; 40(9):1769-77; https://doi.org/10.177/0271678X20943823.
CrossRef - Parra-Vargas M, Ramon-Krauel M, Lerin C, Jimenez-Chillaron JC. Size does matter: Litter size strongly determines adult metabolism in rodents. Cell Metab., 2020; 32(3):334-40; https://doi.org/10.1016/j.cmet.2020.07.014.
CrossRef - Desai M, Ross MG. Maternal-infant nutrition and development programming of offspring appetite and obesity. Nutr. Rev., 2020; 78(Supplement_2):25-31; https://doi.org/10.1093/nutrit/nuaa121.
CrossRef - Matthews D, Hosker J, Rudenski A, Naylor B, Treacher D, Turner R. Homeostasis model assessment: insulin resistance and β-cell function from fasting plasma glucose and insulin concentrations in man. Diabetologia, 1985; 28(7):412-9.
CrossRef - Bligh EG, Dyer WJ. A rapid method of total lipid extraction and purification. Can. J. Biochem. Physiol., 1959; 37(8):911-7.
CrossRef - Gregory JW. Prevention of obesity and metabolic syndrome in children. Front. Endocrinol., 2019; 10:669; https://doi.org/10.3389/fendo.2019.00669.
CrossRef - Taskinen MR, Packard CJ, Boren J. Dietary Fructose and the Metabolic Syndrome. Nutrients, 2019; 11(9) 1987; https://doi.org/10.3390/nu11091987.
CrossRef - Mortera RR, Bains Y, Gugliucci A. Fructose at the crossroads of the metabolic syndrome and obesity epidemics. Front. Bioscience-Landmark, 2019; 24(2):186-211; https://doi.org/10.2741/4713.
CrossRef - Quinn R. Comparing rat’s to human’s age: how old is my rat in people years? Nutrition, 2005; 21(6):775-7.
CrossRef - Semple BD, Blomgren K, Gimlin K, Ferriero DM, Noble-Haeusslein LJ. Brain development in rodents and humans: Identifying benchmarks of maturation and vulnerability to injury across species. Prog. Neurobiol., 2013; 106:1-16; https://doi.org/0.1016/j. pneurobio. 2013.04. 001.
CrossRef - Er F, Zorba E, Günay M, Koz M, Yılmaz C, Paşaoğlu ÖT, et al. Effect of exercise and quercetin in rats with metabolic syndrome induced with fructose. Metab. Syndr. Relat. Disord., 2022; 20(1):57-66.
- Ibrahim KG, Chivandi E, Nkomozepi P, Matumba MG, Mukwevho E, Erlwanger KH. The long-term protective effects of neonatal administration of curcumin against nonalcoholic steatohepatitis in high-fructose-fed adolescent rats. Physiol. Rep., 2019; 7(6):e14032; doi: 10.814/phy2.
CrossRef - Irfan HM, Khan NAK, Asmawi MZ. Moringa oleifera Lam. leaf extracts reverse metabolic syndrome in Sprague Dawley rats fed high-fructose high fat diet for 60-days. Arch. Physiol. Biochem., 2022; 128(5):1202-8; https://doi.org/10.080/13813455.2020.1762661.
CrossRef - Khoramipour K, Chamari K, Hekmatikar AA, Ziyaiyan A, Taherkhani S, Elguindy NM, et al. Adiponectin: Structure, physiological functions, role in diseases, and effects of nutrition. Nutrients, 2021; 13(4):1180; https://doi.org/10.3390/nu13041180.
CrossRef - Rodrigues DF, do Carmo Henriques MC, Oliveira MC, Menezes-Garcia Z, Marques PE, da Glória Souza D, et al. Acute intake of a high-fructose diet alters the balance of adipokine concentrations and induces neutrophil influx in the liver. J. Nutr. Biochem., 2014; 25(4):388-94; https://doi.org/10.1016/j.jnutbio.2013.11.012.
CrossRef - Tillman EJ, Morgan DA, Rahmouni K, Swoap SJ. Three months of high-fructose feeding fails to induce excessive weight gain or leptin resistance in mice. PLoS One, 2014; 9(9):e107206; https://doi.org/10.1371/journal.pone.0107206.
CrossRef - de Moura RF, Ribeiro C, de Oliveira JA, Stevanato E, de Mello MAR. Metabolic syndrome signs in Wistar rats submitted to different high-fructose ingestion protocols. Brit. J. Nutr., 2009; 101(08):1178-84.
CrossRef - Ghezzi AC, Cambri LT, Botezelli JD, Ribeiro C, Dalia RA, Rostom de Mello MA. Metabolic syndrome markers in wistar rats of different ages. Diabetol. Metab. Syndr., 2012; 4(1):16; https://doi.org/0.1186/758-5996-4-16.
CrossRef - Patel C, Douard V, Yu S, Tharabenjasin P, Gao N, Ferraris RP. Fructose-induced increases in expression of intestinal fructolytic and gluconeogenic genes are regulated by GLUT5 and KHK. Am. J. Physiol. Regul. Integr. Comp. Physiol., 2015; 309(5):R499-R509.
CrossRef - Xu H, Ghishan FK. Chapter 10 – Molecular Physiology of Gastrointestinal Function During Development. In: Said HM, editor. Physiology of the Gastrointestinal Tract (Sixth Edition): Academic Press; 2018. p. 235-69.
CrossRef - Boudry G, David ES, Douard V, Monteiro IM, Le Huërou-Luron I, Ferraris RP. Role of intestinal transporters in neonatal nutrition: carbohydrates, proteins, lipids, minerals, and vitamins. J. Pediatr. Gastroenterol. Nutr., 2010; 51(4):380-401; DOI: 10.1097/MPG.0b013e3181eb5ad6.
CrossRef - Castello A, Guma A, Sevilla L, Furriols M, Testar X, Palacin M, et al. Regulation of GLUT5 gene expression in rat intestinal mucosa: regional distribution, circadian rhythm, perinatal development and effect of diabetes. Biochem. J., 1995; 309(1):271-7.
CrossRef - Ferraris RP, Choe J-y, Patel CR. Intestinal absorption of fructose. Ann. Rev. Nutr., 2018; 38:41-67; https://doi.org/10.1146/annurev-nutr-082117-51707.
CrossRef - Sellers RS, Mortan D, Michael B, Roome N, Johnson JK, Yano BL, et al. Society of Toxicologic Pathology position paper: organ weight recommendations for toxicology studies. Toxicol. Pathol., 2007; 35(5):751-5; https://doi.org/10.1080/01926230701595300.
CrossRef - Wolfsegger MJ, Jaki T, Dietrich B, Kunzler JA, Barker K. A note on statistical analysis of organ weights in non-clinical toxicological studies. Toxicol. Appl. Pharmacol., 2009; 240(1):117-22; https://doi.org/10.1016/j.taap.2009.06.012.
CrossRef - Aljerf L, Williams M, Ajong AB, Onydinma UP, Dehmchi F, Pham V, et al. Comparative study of the biochemical response behavior of some highly toxic minerals on selenosis in rats. Revista de Chimie., 2021; 72(2):9-18; https://doi.org/0.37358/Rev.Chim.1949.
CrossRef - Lazic SE, Semenova E, Williams DP. Determining organ weight toxicity with Bayesian causal models: Improving on the analysis of relative organ weights. Sci. Rep., 2020; 10(1):6625; https://doi.org/10.1038/s41598-020-63465-y.
CrossRef - Patel MS, Srinivasan M. Metabolic Programming Due to Alterations in Nutrition in the Immediate Postnatal Period. J. Nutr., 2010; 140(3):658-61.
CrossRef - Lima TdR, Voltarelli FA, Freire LS, da Silva FA, de Almeida PC, Ávila ETP, et al. High‐fat diet and fructose drink introduced after weaning rats, induces a better human obesity model than very high‐fat diet. J. Food Biochem., 2021; 45(4):e13671; https://doi.org/10.1111/jfbc.
CrossRef

