
Manuscript accepted on :23-01-2023
Published online on: 09-02-2024
Plagiarism Check: Yes
Reviewed by: Dr. Raju Thenge and Dr. Ramdas Bhat
Second Review by: Dr. Nivedhitha Subramanian
Final Approval by: Dr. H Fai Poon
Madhuri Baghel1* , Meenakshi Bharkatiya2, Alka Singh3 and Sadhana J. Rajput4
1Apollo College of Pharmacy, Anjora, Durg, Chattisgarh, India.
2B. N. Institute of Pharmaceutical Sciences, Udaipur, Rajasthan, India.
3Uttaranchal Institute of Pharmaceutical Sciences, Uttaranchal University, Dehradun, Uttarakhand, India
4The Maharaja Sayajirao University of Baroda, Vadodara, Gujarat, India.
Corresponding Author E-mail: banchhormadhuri@gmail.com
DOI : https://dx.doi.org/10.13005/bpj/2878
Abstract
Pidotimod is a synthetic biological and immunological modulator with dipeptide structure. It has been used for a long time to treat and prevent recurring respiratory infections. .Pidotimod stress testing and degradation profiling were carried out under ICH-recommended stress degradation protocols. To resolve Pidotimod and its impurities, the degradation products generated by various stress conditions were combined and separated on RP-C-18 column. LC-MS-MS study revealed existence of nine degradation products, six of which were previously unknown. On the basis of m/z values, degradation pathways for degradation products generated after stress testing were postulated.
Keywords
Acute respiratory tract infections (ARTIs); LC-MS-MS; Pidotimod; Stability indicating assay method (SIAM); Stress degradation
Download this article as:| Copy the following to cite this article: Baghel M, Bharkatiya M, Singh A, Rajput S. J. Stress Testing of Pidotimod by LC and LC-MS/MS. Biomed Pharmacol J 2024;17(1). |
| Copy the following to cite this URL: Baghel M, Bharkatiya M, Singh A, Rajput S. J. Stress Testing of Pidotimod by LC and LC-MS/MS. Biomed Pharmacol J 2024;17(1). Available from: https://bit.ly/3SyJ5ov |
Introduction
Poli Industria Chimica, an Italian enterprise, discovered Pidotimod (PDM) and launched it for commercial use in 1993. PDM was the first peptide-like, biological response modifier that activates both primary and acquired immune responses to bacteria and viruses1,2. PDM has been studied in vitro and in vivo3 for prevention, management and treatment of acute ARTIs (respiratory tract infections) in children. Although most of the studies on PDM were published over 25 years ago, it is still utilized to prevent ARTIs today. Despite the fact that publications were available during the approval of PDM, there is a void in the literature in terms of complete pharmacological and analytical research. PDM research has recently looked into new ways for inducing primary and secondary immune responses4-6. PDM was also reevaluated7 after a few years, and a new synthetic method was published8.
An exhaustive literature search found that only few analytical procedures for estimating PDM have been established and reported, including HPLC-UV9; HILIC-MS/MS12; HPLC–MS10; and HPLC-MS/MS11. A bioequivalence study of two formulations of PDM was published13. There is only one published study on the use of GC to determine residual organic solvents in PDM14. Crimella et al.15 described the synthesis and pharmacological evaluation of PDM; it’s carboxamido derivatives, enantiomers and diastereomers16, as well as the analytical and chemical profile of PDM in 1994. They found two process-associated impurities, as well as two other impurities not connected to the process, in an industrial batch of PDM. On the CHIRALPAK17 and CHIRADEX18 stationary phases, chiral separation of PDM and its enantiomers has been described. PDM enantiomers have recently been studied in terms of thermodynamic characteristics, crystal structure, and molecular docking19.
Despite its widespread use and effectiveness in mitigating ARTIs, only one study on PDM impurity profiling was published15. To our knowledge, stress degradation and structural characterization of PDM degradation products (DPs) have not been published in the literature. As a result, the aim of the work was to investigate Pidotimod degradation behaviour under ICH-recommended stress degradation parameters. To separate diverse degradation products, a liquid chromatographic technique was developed. The structure of degradation products were speculated, and fragmentation pathways were described, based on an LC-MS-MS investigation.
Materials and Methods
Reagents and Chemicals
Swapnaroop pharmaceuticals in Aurangabad, India, provided the PDM bulk drug. Spectrochem . Limited Mumbai, India; supplied HPLC graded ammonium acetate; MeOH (methanol) and ACN (acetonitrile). Unless otherwise specified, the solutions were filtered via nylon 6, 6, membrane filter [0.2 µ; Ultipor® N66® from Pall Life Sciences Limited; USA] before use. SD Fine chemicals; Mumbai, India, supplied analytical grade HCl (hydrochloric acid); NaOH (sodium hydroxide); and H2O2 (hydrogen peroxide).
Chromatographic Conditions and Equipment’s
Thermal lining services, Vadodara, India, provided precision water baths with temperature controllers for degradation experiments. In a photo-stability chamber (by Thermolab Scientific Equipments; Limited, Vadodara) coupled by a light pool containing fluorescent (OSRAM L20) and 4 UV (OS-RAM L73) lamps, photolytic degradation was studied. Thermal and humidity chamber (by SR Labs Instruments; Maharastra) was utilized for the evaluation of temperature – humidity conditions.
Waters Acquity from Waters Corporation: Milford: USA; with Empower 2 software and PDA detector was used for HPLC analysis. At wavelength of 215 nm, the separation was carried out using RP C18 column (Phenomenex; 5 µm; 250 mm and 4.6 mm,). The mobile phase was made up of 97:03 v/v mixture of buffer (ammonium acetate;10 mM, with pH 4.5 balanced with glacial acetic acid) and 90:10 v/v of MeOH/CAN, at flow rate of 1.0 ml/min with isocratic elution. The experimentation was carried out in a column oven at 400C with a 20-µL injection volume. “The LC-MS-MS experiments were run in positive and negative ESI mode utilizing Xcalibur software on the LCQ fleet, a Thermo Fisher scientific instrument connected with an Agilent HPLC 1100 series quaternary system delivery module.” Following parameters were set for experimentation: nebulizer pressure =20 psi, gas temperature = 2500C (using nitrogen as a drying gas at pressure of 30 psi) and capillary voltage = 5500 V”20.
Preparation of Degradation Products (DPs)
Various stress conditions were applied for the bulk drug in the stress degradation experiments. Placebo samples were developed to compare with the stress-degraded samples.
10 mL of 1 mg/mL of PDM was prepared in 0.8 N HCl or 0.1 N NaOH and was refluxed (800C; in dark) for 3 hours, for acid and base degradation. Before analysis, a 2 mL aliquot of the samples was reserved, neutralized using the same strength of NaOH or HCl, and stored at -100C. Sample of 10 mL of 1 mg/mL was prepared in double distilled water and refluxed (800C; in dark) for 6 hours for neutral degradation. Oxidative degradation was carried out in 10 mL of 1 mg/mL of PDM that was produced with 0.01 percent H2O2 and refluxed at 800C in the dark for 1.5 hours. API (Active Pharmaceutical Ingredient) was smeared 1mm thick on a petri dish and exposed to UV light (5382 LUX and 144 UW/cm2; for 21 days) for photolytic degradation. API was spreaded in 1mm thickness in petridish and was placed in an oven (800C; for 21 days) in the dark to prepare the thermal degradation product. For thermal humidity degradation, PDM was kept in the stability chamber for 21 days (40ºC±2ºC; 75±5 percent RH).
Results
Method Development
To segregate the peaks of PDM and DPs, the DPs generated under the stress conditions were combined and diluted to 150 ppm with respect to PDM. PDM is polar in nature due to its dipeptide structure. Because DPs (excluding DP4) were even more polar than PDM, a greater buffer ratio was used to lengthen retention time (Rt) and resolve the DPs. The pH of the buffer had a significant impact on PDM Rt. Lowering the buffer pH to 3.8 delayed PDM Rt and resolved DP3, DP2, and DP1. The Rt of PDM reduced when the pH was raised to 5.8, and DP3, DP2, and DP1 were co-eluted. At all pH levels, DP4 was well resolved. Despite the fact that ACN has a higher sensitivity, it gives shorter Rt of PDM. DP3, DP2, and DP1 were also co-eluted, making resolution challenging at larger buffer ratios. MeOH increases the Rt of PDM and helps to resolve DPs at greater buffer ratios, but it decreases sensitivity. To optimize Rt, resolution, and sensitivity, a combination of MeOH and ACN (90:10 v/v) was used. Rt, peak symmetry, and sensitivity of PDM and DPs are all affected by column temperature. As a result, optimization required the use of ammonium acetate buffer and MeOH/ACN. The best separation was accomplished with a mobile phase consisting buffer (ammonium acetate; pH 4.5, 10 mM) and MeOH/ACN (90:10 v/v) in a ratio of 97:03 v/v at 400C. Stressed samples were scanned in a PDA detector (200 to 400 nm); PDM and DPs exhibited good sensitivity at 215 nm, therefore detection was carried out at this wavelength. Figure 1a shows the final chromatogram developed with the chosen mobile phase, which shows highly resolved peaks of PDM and DPs.
Stress Degradation studies
When degradant mixture was evaluated in LC PDA, peaks of five DPs were obtained, as shown in figure 1a. Table 1 summarizes the forced degradation settings with percent degradation (percent Deg) under various situations. The formula for calculating percent Deg21 used was-
PDM was the most vulnerable to oxidative deterioration. Under acid and basic degradation, it degrades significantly. Photolytic, thermal humidity and neutral degradation showed minor deterioration. The drug is most stable under thermal degradation. Figure 1b shows the chromatograms of individual stressed samples.
 |
Figure 1: a) Optimized chromatogram, b) Individual chromatograms of various degradation conditions |
Table 1: PDM and synthetic mixture stress degradation summary
|
Stressor |
Conc. of Stressor |
Time |
% Deg (API) |
% Deg (synthetic mixture) |
DPs formed with Rt |
|
Acid degradation |
0.8 N, 800C |
3 Hrs |
46.44 |
46.21 |
DP1(2.88), DP2(3.40), DP3(3.74), DP4(12.22) |
|
Base degradation |
0.1 N, 800C |
3 Hrs |
61.25 |
60.99 |
DP1(3.01), DP2(3.43), DP3(3.82), DP4(12.86) |
|
Neutral degradation |
800C |
6 Hrs |
10.4 |
10.1 |
DP1(2.91), DP3(2.84), DP4(12.22) |
|
Oxidative degradation |
0.01 %, 800C |
1.5 Hrs |
75.38 |
74.14 |
DP1(2.94), DP2(3.24), DP3(3.79), DP5(6.19) |
|
Photolytic degradation |
— |
21 days |
8.25 |
8.0 |
DP1(2.90), DP2(3.28), DP3(3.86), DP4(12.36) |
|
Thermal degradation |
800C |
21 days |
No degradation |
No degradation |
No degradation |
|
Thermal Humidity induced degradation |
400C 20C and 750C 50C |
21 days |
5.2 |
5.0 |
DP1(2.91), DP3(3.84), DP4(11.98) |
Discussion
Structural characterization of PDM and DPs
MS-MS Spectra of PDM (m/z 245)
PDM’s [M+H]+ ion’s ESI-MS/MS spectrum revealed that the loss of water resulted in the most prevalent fragment ion at m/z 227. Fragmentations of INH-2 (Inherent impurity-2) i. e. thiazolidine carboxylic acid [15], gives fragment ion at m/z 88 as a result of loss of –COO+H2. The spectra also revealed a low abundance fragment ion with an m/z of 187.
MS-MS Spectra of DP’s
As stated in table 2, PDM has been shown to have four impurities[15].Two process related impurities (INH-1 and INH-2) were observed at Rt of 2.95 and 3.79. These processes related impurities were also formed during stress degradation and were identified as DP1 and DP3 respectively. The MW of INH-1 was determined to be 129 after an LC-MS-MS analysis, which corresponds to the process impurity Pyroglutamic acid; whereas the MW of INH-2 was found to be 133, which corresponds to the process impurity thiazolidine carboxylic acid. Also MW of DP-4 (MW 244) matched with the impurity reported by Crimella T [15]. Other DPs were identified by LC-MS-MS since their molecular weights did not match those of the identified impurities. Five DPs were found using LC-PDA, and total nine DPs were found by LC-MS-MS analysis, including DP1 and DP3. Different masses were observed in LC-MS-MS for individual stress degradation condition which gives same retention time in LC-PDA when the mixtures of DPs are injected (peak purity studies reveled that some peaks were not pure in LC-PDA when mixture of degradants was injected). Oxidative degradation showed different masses of peaks that had same retention time in LC-PDA as photolytic; neutral; thermal humidity; acid and base degradation. Hence for degradants observed in LC-MS-MS different nomenclature have been used for DPs. For oxidative degradation these were named DP6; DP7; DP8 and DP9. Also the peak of DP2 that was observed as single pure peak in LC-PDA (in case of acid, base, photolytic degradation) and was observed as bifurcated peak in LC-MS-MS with same MW hence two different nomenclature DP2 and DP2 (e) was used during explanation.
For PDM and DPs, the fragmentation paths and structures were predicted using the m/z values. Figure 2a and 2b show the ESI-MS-MS spectra of the DPs. Figure 3 depict the possible fragmentation pathways of DPs.
DP 1 (m/z 128): There was an abundance of [M-H]– ion at m/z 128(127.92) in the negative ion ESI-MS of DP1; corresponding to MW of INH-1 Pyroglutamic acid. The MS-MS spectra of DP1 could not be generated due to low sensitivity and absence of ionization.
DP2 and DP2 (e) (m/z 263): The ESI-MS-MS spectrum of the ion at m/z 263 gives two different fragmentation patterns that was detected as a shouldered peak in LC-MS-MS while it was recorded as a single peak in LC-PDA. A possible explanation is the existence of an isomeric peak. Due to the loss of H2O, both had an abundance of fragment ions at m/z of 245. There was also an abundance of the fragmentation product (DP-2(e)) at m/z 227) as well as DP-2(m/z 148).
DP3 (m/z 134): The abundant [M+H]+ ion was observed at m/z of 134 in the positive ion ESI-MS, that did not show protonated ions. The MW of parent ion confirmed the anticipated structure for DP3 (table2) that is thiazolidine carboxylic acid; the process related impurity (INH-2) of PDM.
DP 4 (m/z 245): The [M+H]+ ion at m/z 245 was prevalent in the positive ion ESI-MS-MS of DP4. The loss of H2O in the [M+H]+ ion’s ESI-MS-MS spectra revealed abundant fragment ion at m/z 227. The spectra also contains an abundant fragment ion of INH-2 (Thiazolidine carboxylic acid), corresponding to m/z 134.
DP 5 (m/z 119): The abundance of [M-H]– ion at m/z 119, was observed in the negative ion ESI-MS spectrum of DP5, which did not show protonation.
DP 6 (m/z 261): The [M+H]+ ion at m/z 261 was prevalent in the positive ion ESI-MS-MS spectra of DP6. As shown by the ESI-MS-MS spectrum, the most abundant [M+H]+ ion fragment ion was found to be the PDM or DP4 fragment ion, which fragmented to generate fragment ion at m/z 132.
DP 7 (m/z 267): There was an abundance of [M+H]+ in the DP-9 positive ion ESI-MS-MS spectra, which exhibited a m/z 267. An abundant fragment ion at m/z 261 found in the spectra of DP7, probably belong to DP6. These fragment ions further fragment to generate the most abundant fragment ions at m/z 245 which correspond to either PDM or DP-4.Fragment ion m/z 245 further fragment to give m/z of 148 that fragment to give m/z of 132.
DP 8 (m/z 521): The positive ion DP8’s ESI-MS-MS spectra revealed an abundance of the [M+H]+ ion at m/z 521, which may be the result of dimerization (m/z 261) of DP8 causing the [M+H]+ ion abundance. The [M+H]+ ion of DP10 has fragment ions of m/z 485 and 243 in the ESI-MS/MS spectra.
DP 9: The ACN adduct of DP8 was observed at Rt 2.9 in oxidative degradation that gave [M+H]– ion in negative ion ESI-MS spectrum at m/z 306.
Finally, structures and degradation schemes for all DPs were presented based on the aforementioned findings and interpretations. TABLE 2 shows the chemical structures of PDM and all of its related compounds (both known and unknown), as well as their origins, degradation pathways, Rt, and observed m/z values of major fragments.
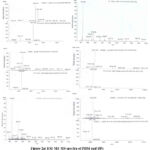 |
Figure 2: a) ESI-MS-MS spectra of PDM and DPs |
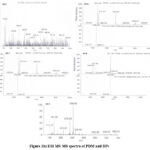 |
Figure 2b) ESI-MS-MS spectra of PDM and DPs |
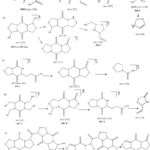 |
Figure 3: Anticipated fragmentation pathway of PDM and DPs |
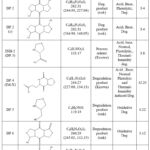 |
Table 2: PDM and related molecules chemical structures, origin, degradation process, Rt, and measured m/z values for main fragments. |
Conclusion
LC-PDA detection and LC-MS-MS investigation were employed during the profiling to track the impurities and determine the degradability of Pidotimod. LC-PDA detected five impurities in total, including degradation related and intrinsic or inherent impurities, while LC-MS-MS detected nine. Two degradation products produced during stress degradation were identified as inherent/process related impurities INH-1 and INH-2. Out of nine impurities identified, six impurities are not reported in literature. On the basis of LC-MS-MS analyses, structures, fragmentation pathways, and a degradation strategy for degradation products were presented. This provides all of the data about Pidotimod’s degradation chemistry.
Acknowledgement
None to declare
Conflict of Interest
The authors have no financial or other conflicts of interest.
Funding Source
There is no funding sources.
References
- Amato MD, Paris D, Molino A, and Motta A, 2019. The Immune-Modulator Pidotimod Affects the Metabolic Profile of Exhaled Breath Condensate in Bronchiectatic Patients: A Metabolomics Pilot Study. Frontiers in Pharmacology. 10, 1115.
CrossRef - Zuccotti GV, Mameli C, 2013. Pidotimod: the past and the present. International Journal of Pediatrics. 39(75), Pages-2-3.
CrossRef - Mailland F, Coppi G, Signorelli G, 1991. Pidotimod. Drugs Future. 16 (21)1096.
CrossRef - Mameli C, Pasinato A, Picca M, et al,2015. Pidotimod for the prevention of acute respiratory infections in healthy children entering into daycare: A double blind randomized placebo-controlled study. Pharmacological Research. 97, Pages-79-83.
CrossRef - Giagulli C, Noerder M, Avolio M, et al, 2009. Pidotimod promotes functional maturation of dendritic cells and displays adjuvant properties at the nasal mucosa level. International Immunopharmacology. 9(12), Pages-1366-73.
CrossRef - Masihi K, 2000. Immunomodulatory agents for prophylaxis and therapy of infections. International Journal of Antimicrobial Agents. 4(3), Pages-181-91.
CrossRef - Riboldi P, Gerosa M, Meroni P,2009. Pidotimod: A reappraisal. International Journal of Immunopathology and Pharmacology. 22(2), Pages- 255-62.
CrossRef - Ye L, Luo Y, Ou X, 2012. Improvement of the Synthesis Technology of Pidotimod. China Pharmacy. 1, 017.
- Coppi G, Barchielli M, 1991. Simple high-performance liquid chromatographic method for the determination of PGT/1A, a new immunostimulating drug, in biological fluids. Journal of Chromatography B: Biomedical Sciences and Applications. 563(2), Pages- 385-391.
CrossRef - Zhang Y, Xiong Z, Qin F, et al, 2009. High-performance liquid chromatography–tandem mass spectrometry for the determination of pidotimod in human plasma and its application to a pharmacokinetic study. Journal of Chromatography B. 877(24), Pages-2566-2570.
CrossRef - Lou H, Ruan Z, Jiang B, 2012. Quantitative determination of pidotimod in human plasma by liquid chromatography tandem mass spectrometry. Application to a bioequivalence study. Arzneimittel-Forschung. 62(2), Pages- 99-104.
CrossRef - ChenH, ShenM, Chen L, 2011. HILIC-MS-MS for the Quantification of Pidotimod in Human Plasma; Chromatographia. 73(7-8), Pages-767-773.
CrossRef - Huang JH, Huang XH, Wang K, et al, 2013. Bioequivalence evaluation of two formulations of pidotimod using a limited sampling strategy. Biomedicine and Pharmacotherapy.67(6), Pages- 475-480.
CrossRef - Junfang L, 2009. Determination of Residual Organic Solvents in Pidotimod Tablets by GC. China Pharmacy. 31,028.
- Crimella T, Orlandi R, BocchiolaG,et al,1994. Analytical and chemical profile of Pidotimod. Arzneimittel-Forschung. 44(12A), Pages-1405-1410.
- Magni A, Signorelli G, Bocchiola G,1994. Synthesis and preliminary pharmacological evaluation of pidotimod, its enantiomer, diastereomers and carboxamido derivatives. Arzneimittel-Forschung. 44(12A), Pages-1402-1404.
- Zhang LX, Yin TJ, Shen WY, et al 2011. Enantiomeric separation of Pidotimod by HPLC using chiral stationary phase. Journal of china pharmaceutical university. 42(3), Pages-238-341.
- Baghel M, Rajput S, 2016. HPLC separation of Pidotimod enantiomers using beta-cyclodextrin based chiral stationary phase;Indo American journal of pharmaceutical research. 06(07), Pages- 6182-6189.
- Dou X, Su X, Wang Y, et al, 2015. Studies on Pidotimod Enantiomers with Chiralpak-IA crystal structure, thermodynamic parameters and molecular docking. Chirality. 27(11), Pages-802-808.
CrossRef - Baghel M, Rajput S, 2017. Degradation and impurity profile study of ciclopirox olamine after pre-column derivatization. A risk based approach. Journal of Chromatographic Science, 1–12.
CrossRef - Baghel M, Rajput S, 2018. Stress degradation of edaravone. separation, isolation and characterization of major degradation products. Biomedical Chromatography. 32 (4), Pages-e4146-4149.
CrossRef

