
Manuscript accepted on :05-05-2023
Published online on: 10-01-2024
Plagiarism Check: Yes
Reviewed by: Dr. Rajendran Susai
Second Review by: Dr. Hind Shakir
Final Approval by: Dr. Ziyad S. Haidar
Devi Lakshmi. A1* , Purnima. S1, Atchaya. V1, Avesha. R1, Divya Bharathi. S1, and Prasanna. S2
1Department of Biomedical Engineering, Jerusalem College of Engineering, Pallikaranai, Chennai Tamil Nadu, India.
2Department of Oral and Maxillofacial Pathology, Seema Dental College and Hospital, Rishikesh, Uttarakhand, india.
Corresponding Author E-mail: devilakshmi186@gmail.com
DOI : https://dx.doi.org/10.13005/bpj/2862
Abstract
Diabetic Nephropathy, is a condition that is characterized by loss of kidney function and mostly occurs in individuals with Diabetes Mellitus. The development of Diabetic Nephropathy is easier to treat if diagnosed in the early stage (appearance of an abnormal amount of salivary biomarkers). The conventional methods are mostly invasive and have many limitations like irregular monitoring of the glucose, creatinine, urea etc., Saliva is a multi-constituent biological fluid. It is one of the most abundant secretions and its collection is easy and non-invasive. With this novel idea, the present study aimed in estimating the salivary parameters in the diagnosis of diabetic nephropathy. The objective of the project is to reduce the dependence on hemodialysis and kidney transplantation of a person suffering from ESRD by estimation of glucose by GOD-POD method, creatinine by Jaffe’s method and urea by Berthelot-Urease method
Keywords
Creatinine; Diabetic Mellitus; Diabetic Nephropathy; Glucose; Urea
Download this article as:| Copy the following to cite this article: Lakshmi A. D, Purnima S, Atchaya V, Avesha R, Bharathi S. D, Prasanna S. Salivary Biomarkers in the Diagnosis of Diabetic Nephropathy – An Non- Invasive Approach. Biomed Pharmacol J 2024;17(1). |
| Copy the following to cite this URL: Lakshmi A. D, Purnima S, Atchaya V, Avesha R, Bharathi S. D, Prasanna S. Salivary Biomarkers in the Diagnosis of Diabetic Nephropathy – An Non- Invasive Approach. Biomed Pharmacol J 2024;17(1). Available from: https://bit.ly/3Hbfhcr |
Introduction
Diabetic Mellitus (DM) usually shows metabolic abnormalities in carbohydrate, protein and lipid that can leads to various complications namely retinopathy, neuropathy, nephropathy and Cardiovascular system diseases 2.
In the present scenario, diabetes mellitus is diagnosed by estimating the serum parameters which is invasive, and traumatic to the individual both physically and psychologically. As a result, people are reluctant in undergoing investigations and there is a lack of prompt diagnosis and making diabetes the cause of death worldwide. So, an alternate biological sample that is easy to collect, requires less technical knowledge, non-invasive, low- cost and can be collected multiple times by direct approach, this is where saliva comes in role play which satisfies all the criteria that are needed 1.
These salient features of saliva make it as a most convenient biological sample which can be employed in sample collection for pediatric and older individuals whereas receiving blood samples will be of great difficulty 1.
The chronic renal disorder is one of the diseases which can show alterations in salivary composition. In subjects with chronic kidney disease (CKD), salivary creatinine and urea levels can be estimated instead of blood samples 2. Biochemical markers have a very important contribution in the early detection and control of diabetes thereby reducing complications and increasing the individual’s lifespan 3.
With this note, the present study aimed in estimating salivary biomarkers like glucose, creatinine and urea in diabetic nephropathy (DN), diabetes mellitus (DM) and normal subjects.
Materials and Method
In this study, a total of 30 subjects were selected with a median age group of about 18-60 years. Out of 30 subjects, 10 subjects were normal subjects, 10 subjects were diabetic, and 10 subjects were Diabetic nephropathy subjects. All 30 subjects were subjected to three tests namely – estimation of glucose, creatinine and urea.
Collection of Samples
Serum and saliva were collected from each subject after 1½ hours breakfast. About 2 mL of blood was collected by the veni-puncturing method in an ethylenediamine tetra acetic acid (EDTA) tube and it was centrifuged at 4000 rpm for 5-10 minutes. The resultant serum is used for the estimation. For saliva collection, the subjects were informed to avoid food intake for 2hours before collection. Saliva was collected by making the subject rinse his/her mouth with water and was insisted to open mouth for 5 minutes without swallowing, and about 2 mL of saliva was collected in a sterile container by the spitting method. The whole saliva is centrifuged at 2000 rpm for 2-3 minutes. The resultant supernatant is used for the estimation.
Estimation of Glucose
By using the Glucose Oxidase- Peroxidase (GOD – POD) method, both serum and salivary glucose levels were estimated. Four test tubes were taken. The test tubes are labeled as ‘Blank’, ‘Standard’, ‘Test Serum’ and ‘Test Saliva’ respectively. About 1 mL of Glucose enzyme reagent is added to each test tube. Then, 10 µL of the standard was added to the tube marked as ‘Standard’, followed by 10 µL of the test serum sample to the ‘Test Serum’ test tube and 10 µL of the test saliva sample to the ‘Test Saliva’ test tube. After mixing well, the test tubes were kept incubated at 37oC for 15 minutes. The reagent “Blank” was aspirated in a colorimeter first, followed by a standard solution and therefore the absorbance values were noted at 546nm (±20 nm). Then, the test serum sample followed by the test saliva sample was aspirated and the absorbance values were noted at 546nm (±20 nm). Finally, the glucose was estimated by using the formula.
Estimation of Creatinine
By using Jaffe’s method (Alkaline Picrate Method), both serum and salivary creatinine levels were estimated. Four test tubes were taken. The test tubes are labeled as ‘Blank’, ‘Standard’, ‘Test Serum’ and ‘Test Saliva’ respectively. About 1 mL of working reagent is added to each test tube. Then, 50 µL of the standard was added to the tube marked as ‘Standard’, followed by 50 µL of the test serum sample to the ‘Test Serum’ test tube and 50 µL of the test saliva sample to the ‘Test Saliva’ test tube. Mix the content well. The reagent “Blank” was aspirated in a colorimeter first, followed by standard solution and therefore the initial absorbance values (A1) were noted exactly after 30 seconds at 490-520 nm. Then, the test serum sample followed by the test saliva sample was aspirated and the initial absorbance values (A1) were noted exactly after 30 seconds.
The other absorbance values (A2) for the standard, test serum and test saliva were noted exactly after 120 seconds. Then, the change in absorbance (ΔA) for the standard, test serum and test saliva were calculated. Finally, the creatinine was estimated by using the formula.
Estimation of Urea
By using the Berthelot-Urease method, both serum and salivary urea levels were estimated. Four test tubes were taken. The test tubes are labeled as ‘Blank’, ‘Standard’, ‘Test Serum’ and ‘Test Saliva’ respectively. About 1 mL of working reagent is added to each test tube. Then, 10 µL of the standard was added to the tube marked as ‘Standard’, followed by 10 µL of the test serum sample to the ‘Test Serum’ test tube and 10 µL of the test saliva sample to the ‘Test Saliva’ test tube. After mixing well, the test tubes were kept incubated at 37oC for 5 minutes. Then about 1 mL of chromogen reagent is added in all the test tubes and after mixing well, it is incubated at 37o C for 5 minutes. The reagent “Blank” was aspirated in a colorimeter first, followed by standard solution and therefore the absorbance values (Abs.S) were noted at 600nm. Then, the test serum sample followed by the test saliva sample was aspirated and the absorbance values (Abs.T) were noted at 600nm. Finally, the urea was estimated by using the formula.
Results
In this study, total of 30 subjects were selected. Out of 30 subjects, 10 subjects were normal subjects, 10 subjects were diabetic, and 10 subjects were Diabetic nephropathy subjects. Out of 10 subjects in the control group, 6 subjects had serum glucose level below 100 mg/dL and 4 subjects had serum glucose level ranges between 100–140 mg/dL (Table No. 1). In diabetic subject, out of 10 subjects, 4 subjects had serum glucose level ranges between 130–200 mg/dL and 6 subjects had serum glucose level ranges between 200–250 mg/dL (Table No. 2). In the control group, the salivary glucose level ranges between 0.1-0.9 mg/dL (Table No. 1). In the diabetic subjects, the salivary glucose level ranges between 1.0-9.0 mg/dL (Table No. 2). However, the salivary glucose levels were highly inconsistent with respect to the serum glucose levels, i.e., the salivary glucose levels were not consistent with the severity of diabetes in serum in all groups (Figure No.1, Figure No. 4, Figure No. 7). The serum creatinine and salivary creatinine levels for control group ranges between 0.5-0.9 mg/dL and between 0.07-0.28 mg/dL respectively (Table No. 1). The serum urea and salivary urea levels for control group ranges between 5-14 mg/dL and between 12-26 mg/dL respectively (Table No. 1).
In the diabetic subjects, the serum urea and salivary urea levels ranges between 21-41 mg/dL and between 29-45 mg/dL respectively (Table No. 2). In the diabetic subjects, the serum creatinine and salivary creatinine levels ranges between 1.6-2.5 mg/dL and between 0.1-1.0 mg/dL respectively (Table No. 2). When salivary urea values were compared to serum urea values, we observed that serum urea values were substantially lower than salivary urea values in all groups (Figure No.3, Figure No. 6, Figure No. 9). Similarly, when salivary creatinine values were compared to serum creatinine values, we observed that serum creatinine values were substantially similar to salivary creatinine values in all groups (Figure No.2, Figure No. 5, Figure No. 8).
Table 1: Results for control group (Normal Subjects).
|
SUBJECT |
AGE |
SEX |
SERUM GLUCOSE (mg/dL) |
SALIVA GLUCOSE (mg/dL) |
SERUM CREATININE (mg/dL) |
SALIVA CREATININE (mg/dL) |
SERUM UREA (mg/dL) |
SALIVA UREA (mg/dL) |
|
1 |
21 |
FEMALE |
83 |
0.35 |
0.89 |
0.27 |
13.61 |
25.71 |
|
2 |
25 |
FEMALE |
107 |
0.5 |
0.83 |
0.20 |
12.59 |
18.15 |
|
3 |
27 |
MALE |
89 |
0.4 |
0.55 |
0.11 |
7.93 |
13.67 |
|
4 |
30 |
MALE |
102 |
0.47 |
0.75 |
0.18 |
12.36 |
18.11 |
|
5 |
33 |
FEMALE |
97 |
0.2 |
0.63 |
0.08 |
5.29 |
12.53 |
|
6 |
35 |
FEMALE |
104 |
0.75 |
0.81 |
0.20 |
12.55 |
18.15 |
|
7 |
45 |
FEMALE |
92 |
0.87 |
0.72 |
0.24 |
8.01 |
13.79 |
|
8 |
46 |
MALE |
96 |
0.23 |
0.61 |
0.08 |
5.27 |
12.51 |
|
9 |
50 |
MALE |
110 |
0.3 |
0.87 |
0.23 |
12.87 |
18.56 |
|
10 |
55 |
FEMALE |
99 |
0.61 |
0.70 |
0.12 |
8.20 |
15.67 |
Table 2: Results for Diabetic Subjects.
|
SUBJECT |
AGE |
SEX |
SERUM GLUCOSE (mg/dL) |
SALIVA GLUCOSE (mg/dL) |
SERUM CREATININE (mg/dL) |
SALIVA CREATININE (mg/dL) |
SERUM UREA (mg/dL) |
SALIVA UREA (mg/dL) |
|
1 |
44 |
FEMALE |
135 |
1.12 |
1.7 |
0.3 |
28 |
30 |
|
2 |
55 |
MALE |
198 |
2.9 |
1.9 |
0.6 |
30 |
35 |
|
3 |
45 |
FEMALE |
168 |
4.5 |
1.8 |
0.2 |
29 |
38 |
|
4 |
46 |
MALE |
175 |
1.7 |
1.9 |
0.4 |
34 |
32 |
|
5 |
49 |
FEMALE |
247 |
8.7 |
2.4 |
0.3 |
29 |
44 |
|
6 |
50 |
FEMALE |
243 |
4.3 |
2.3 |
0.9 |
22 |
43 |
|
7 |
53 |
MALE |
242 |
2.6 |
2.2 |
0.9 |
24 |
42 |
|
8 |
60 |
FEMALE |
230 |
1.5 |
2.1 |
0.8 |
40 |
41 |
|
9 |
62 |
MALE |
245 |
7.9 |
2.3 |
0.9 |
24 |
42 |
|
10 |
65 |
MALE |
220 |
3.6 |
2.0 |
0.7 |
39 |
40 |
Table 3: Results for Diabetic Nephropathy Subjects.
|
SUBJECT |
AGE |
SEX |
SERUM GLUCOSE (mg/dL) |
SALIVA GLUCOSE (mg/dL) |
SERUM CREATININE (mg/dL) |
SALIVA CREATININE (mg/dL) |
SERUM UREA (mg/dL) |
SALIVA UREA (mg/dL) |
|
1 |
55 |
FEMALE |
280 |
14.1 |
2.2 |
1.15 |
110 |
45.11 |
|
2 |
55 |
MALE |
310 |
18.5 |
3.1 |
1.40 |
121 |
50.33 |
|
3 |
59 |
FEMALE |
278 |
14.7 |
2.1 |
1.35 |
102 |
49.01 |
|
4 |
60 |
FEMALE |
410 |
19.6 |
5.1 |
1.65 |
121 |
64.32 |
|
5 |
63 |
MALE |
325 |
18.7 |
3.3 |
1.49 |
124 |
54.21 |
|
6 |
65 |
FEMALE |
290 |
15.2 |
2.5 |
1.21 |
117 |
51.89 |
|
7 |
69 |
FEMALE |
320 |
16.8 |
3.3 |
1.45 |
125 |
51.01 |
|
8 |
70 |
MALE |
350 |
17.1 |
3.8 |
1.52 |
125 |
59.33 |
|
9 |
73 |
FEMALE |
300 |
15.6 |
3.1 |
1.56 |
120 |
53.98 |
|
10 |
75 |
FEMALE |
299 |
14.9 |
2.7 |
1.32 |
111 |
49.53 |
As expected, the serum creatinine and urea were significantly higher in subjects with CKD. Among all group’s serum and salivary urea, glucose and creatinine levels were higher in CKD subjects followed by diabetic subjects and least in control group subjects. The increase in the serum urea, glucose, and creatinine level may be an implication of general diseases like renal insufficiency which can cause increased creatinine and uric acid level as a result of a reduction of blood flow to the kidneys. It was also observed that the increase of glucose, creatinine and urea levels in the diabetic subject might lead to a chronic kidney disease called diabetic nephropathy. At this stage, the subject will completely fail the kidney function. So, these subjects need frequent dialysis. In diabetic nephropathy subjects, it was noted that the value of serum glucose ranges between 270-415 mg/dL, the value of serum creatinine ranges between 2-6 mg/dL and the values of serum urea ranges between 100-126 mg/dL (Table No. 3). In diabetic nephropathy subjects, it was noted that the value of salivary glucose ranges between 14- 20 mg/dL, the value of salivary creatinine ranges between 1.0-1.7 mg/dL and the value of salivary urea ranges between 45-65 mg/dL (Table No. 3).
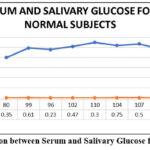 |
Figure 1: Comparison between Serum and Salivary Glucose for Normal Subjects |
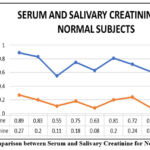 |
Figure 2: Comparison between Serum and Salivary Creatinine for Normal Subjects |
 |
Figure 3: Comparison between Serum and Salivary Urea for Normal Subjects |
 |
Figure 4: Comparison between Serum and Salivary Glucose for Diabetic Subjects |
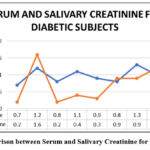 |
Figure 5: Comparison between Serum and Salivary Creatinine for Diabetic Subjects |
 |
Figure 6: Comparison between Serum and Salivary Urea for Diabetic Subjects |
 |
Figure 7: Comparison between Serum and Salivary Glucose for Diabetic Nephropathy Subjects. |
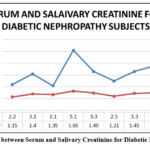 |
Figure 8: Comparison between Serum and Salivary Creatinine for Diabetic Nephropathy Subjects. |
 |
Figure 9: Comparison between Serum and Salivary Urea for Diabetic Nephropathy Subjects |
Discussion
Diabetes mellitus is a globally widespread disease that various diagnostic devices are now available. In the past three decades, there is significant increase in cases of End Stage Renal Disease (ESRD). The most attributed cause behind this progressive increase is incidence of diabetes and hypertension globally.
Saliva may be a useful biomarker of early disease detection that results in more practical diagnosis and treatment or monitor systemic illness, like diabetes, diabetic nephropathy etc., and this study suggests that saliva contributes a straightforward, quick, and affordable method for screening of diabetic autonomic nephropathy and diabetes mellitus. Unstimulated whole saliva has been employed in the bulk of diagnostic studies because generally there’s a dilution of saliva, and modulation in pH in stimulated saliva.
In this study, glucose concentration in unstimulated whole saliva was analyzed. There was a rise in salivary glucose level when there was an increase in serum glucose level. Hence, saliva may be used as a screening method in diagnosing DM and diabetic nephropathy.
Creatinine is unable to diffuse easily across the cells and the
tight intercellular junctions of the exocrine gland due to its physical
properties in an extremely healthy state under normal conditions. In the
diseased state, the salivary level of creatinine increases because of altered
membrane permeability of acinar cells and increased serum levels
which facilitate easy diffusion
from serum to saliva and there by resulting in increased salivary creatinine levels in CKD patients. Thus, serum creatinine is used to monitor disease progression, and salivary creatinine can be used to monitor and diagnose the disease. As a result, saliva is used as a screening method for diabetes and diabetic nephropathy diagnosis.
Similarly, as the serum urea levels increase there is a significant elevation of salivary urea levels as a result of impaired renal urea excretion mechanism. As a result of this, there is elevation of serum urea with simultaneous increase in salivary urea due to increased urea concentration gradient. The increased serum urea creates a higher concentration gradient, which increases urea diffusion from serum to saliva. Serum urea levels were substantially lower than salivary urea levels. Serum creatinine values were substantially same as salivary creatinine values. As a result, salivary creatinine and urea levels correlate well with serum creatinine and urea levels respectively. Hence, we are suggesting that saliva could be used as a non-invasive diagnostic tool for diabetic nephropathy.
Conclusion
To reduce complications, glucose levels must be monitored on a regular basis. More research with a larger sample size is required to determine the diagnostic evaluability of salivary glucose levels in the primary diagnosis of diabetic nephropathy. Our research indicates that salivary glucose, creatinine, and urea levels were elevated in late-stage CKD subjects, with statistical correlations to blood levels. According to the findings of this study, serum and salivary glucose, urea, and creatinine levels were substantially higher in CKD and diabetic nephropathy subjects than in diabetic or normal subjects. Only CKD, diabetic, and diabetic nephropathy subjects had higher levels of salivary glucose, urea, and creatinine, while controls had no difference. Thus, it is frequently recommended that salivary glucose, urea, and creatinine levels can be used for screening of renal status in CKD, diabetic, diabetic nephropathy and normal subjects. As a result, saliva could even be used as a steppingstone, potentially revolutionizing the diagnostic protocol for subjects with renal diseases.
Acknowledgement
The authors would like to thank all the staff and faculty members of the Department of Oral Pathology at Tagore Dental College and Hospital for their valuable guidance throughout the project.
Conflicts of Interests
There is no conflict of interest.
Funding Source
There are no funding sources
References
- Ragunathan H, Aswath N, Sarumathi T. Salivary glucose estimation: A noninvasive method. Indian J Dent Sci 2019;11:25-7
CrossRef - Lasisi, T.J., Raji, Y.R. & Salako, B.L. Salivary creatinine and urea analysis in patients with chronic kidney disease: a case control study. BMC Nephrol 17, 10 (2016).
CrossRef - Ladgotra A, Verma P, Raj SS. Estimation of Salivary and Serum Biomarkers in Diabetic and Non Diabetic Patients – A Comparative Study. J Clin Diagn Res. 2016 Jun;10(6):ZC56-61.
CrossRef - Pandya D, Nagrajappa AK, Ravi KS. Assessment and Correlation of Urea and Creatinine Levels in Saliva and Serum of Patients with Chronic Kidney Disease, Diabetes and Hypertension- A Research Study. J Clin Diagn Res. 2016 Oct;10(10):ZC58-ZC62.
CrossRef - Venkatapathy R, Govindarajan V, Oza N, Parameswaran S, Pennagaram Dhanasekaran B, Prashad KV. Salivary creatinine estimation as an alternative to serum creatinine in chronic kidney disease patients. Int J Nephrol. 2014;2014:742724.
CrossRef - R. Christeffi Mabel,Abhinaya. L. M, Noninvasive estimation of Salivary Glucose, Salivary Amylase, Salivary Protein and Salivary pH in Diabetic and Non-Diabetic subjects – A case control study, ejbps, 2018, 5, (5), 587-592.
CrossRef - S. Shrestha,P. Gyawali,R. Shrestha, Poudel, M. Sigdel, andP. Regmi,”Serum Urea and Creatinine in Diabetic and non-diabetic subjects,”Journal of Nepal Association for Medical Laboratory Sciences, vol. 9, no. 1pp. 11-12, 2008.
CrossRef - “Eating Right for Chronic Kidney Disease | NIDDK”. National Institute of Diabetes and Digestive and Kidney Diseases. Retrieved 2019.
CrossRef - “Global Report on Diabetes” (PDF). World Health Organization. 2016. Retrieved 2018.
CrossRef - “Chronic Kidney Disease Tests & Diagnosis”. National Institute of Diabetes and Digestive and Kidney Diseases. October 2016. Retrieved 2017.
CrossRef - de Boer IH (2017). “A New Chapter for Diabetic Kidney Disease”. The New England Journal of Medicine. 377 (9):885–887. doi:10.1056/nejme1708949. PMID 28854097.
CrossRef - Bamanikar, S., Bamanikar, A., & Arora, A.K. (2016). Study of Serum urea and Creatinine in Diabetic and non-diabetic patients in in a tertiary teaching hospital. The Journal of Medical Research..
- Campbell MJA. Glucose in the saliva of the non-diabetic and the diabetic patient. Arch Oral Biol 1965;10:197-205.
CrossRef - S. Malik, S. Gupta, R. Khadgawat and S. Anand, “A novel non-invasive blood glucose monitoring approach using saliva,” 2015 IEEE International Conference on Signal Processing, Informatics, Communication and Energy Systems (SPICES), Kozhikode, India, 2015, pp. 1-5, doi: 10.1109/SPICES.2015.7091562.
CrossRef - A. Soni and S. K. Jha, “Saliva based noninvasive optical urea biosensor,” 2017 IEEE SENSORS, Glasgow, UK, 2017, pp. 1-3, doi: 10.1109/ICSENS.2017.8234302.
CrossRef - Determination of creatinine-related molecules in saliva by reversed-phase liquid chromatography with tandem mass spectrometry and the evaluation of hemodialysis in chronic kidney disease subjects, Analytica Chimica Acta, Volume 911, 2016, Pages 92-99.
CrossRef - Tiongco REG, Arceo ES, Rivera NS, Flake CCD, Policarpio AR. Estimation of salivary glucose, amylase, calcium, and phosphorus among non-diabetics and diabetics: Potential identification of non-invasive diagnostic markers. Diabetes Metab Syndr. 2019 Jul- Aug;13(4):2601-2605.
CrossRef

