
Manuscript accepted on :04-09-2023
Published online on: 10-01-2024
Plagiarism Check: Yes
Reviewed by: Dr. A K Kapoor
Second Review by: Dr. Yosri Ahmed Fahim
Final Approval by: Dr Ayush Dogra
J Chandrudu and Gandhimathi R*
Department of Pharmaceutical Chemistry and Analysis, School of Pharmaceutical Sciences, Vels Institute of Science, Technology and Advanced Studies(VISTAS), Pallavaram, Chennai-600117, Tamil Nadu, India.
Corresponding Author E-mail: drgmathipharm2017@gmail.com
DOI : https://dx.doi.org/10.13005/bpj/2858
Abstract
A diarylquinoline anti-mycobacterial drug, bedaquiline (BDQ), treats mycobacterial infections. It inhibits the proton pump by inhibiting mycobacterial Adenosine Triphosphate (ATP) synthase. ATP enzyme that is energy production requires Mycobacterium tuberculosis. The present study aimed to develop three analytical methods, i.e., High-performance thin-layer chromatography (HPTLC), HPLC, and UV, as BDQ estimation in tablet forms. HPTLC is employed in the first method, which uses ethanol-chloroform-toluene as the mobile phase (6:3.5:0.5). UV spectroscopy at 240nm was used to analyse BDQ at 100-300 micrograms per milliliter. RP-HPLC method based on the separation using a C18 column, Buffer (sodium acetate): Methyl alcohol (70:30) as mobile phase flowing at a rate of 1ml per min. The retention time was determined to be 5.4 minutes. At 240 nm, it could quantify the concentrations of 5-25 g per ml at concentrations of 5-20 g per ml. The third method involves the "UV-VISIBLE” spectrophotometric method. A range of BDQ concentrations is determined of 8-40µg/ml, respectively. These methods were checked to ICH guidelines, and as a result, a commercially available pharmaceutical formulation, with the findings of statistical comparison, was conducted between all three methods.
Keywords
Bedaquiline; Estimation; HPTLC; RP-HPLC; Tablet; UV-VISIBLE Spectrophotometry
Download this article as:| Copy the following to cite this article: Chandrudu J, Gandhimathi R. Method Development and Validation for Estimation of Bedaquiline and in Tablet Dosage form by Hptlc and Rp-Hplc Study. Biomed Pharmacol J 2024;17(1). |
| Copy the following to cite this URL: Chandrudu J, Gandhimathi R. Method Development and Validation for Estimation of Bedaquiline and in Tablet Dosage form by Hptlc and Rp-Hplc Study. Biomed Pharmacol J 2024;17(1). Available from: https://bit.ly/3RQxS2d |
Introduction
BDQ Chemically known as (1R, 2S) 1(6Bromo-2methoxy-3quinolyl) 4-dimethylamino-2(1- naphthyl) 1-phenylbutan-2-ol. The structure of BDQ is shown in fig1. A novel bactericidal anti-mycobacterial drug called bedaquiline. Multidrug-resistant tuberculosis is treated with this diarylquinoline anti-mycobacterial medication by inhibiting mycobacterial ATP synthase, which generates energy for Mycobacterium tuberculosis; it inhibits the proton pump. Bedaquiline causes bacterial death. Its molecular formula is C32H31BrN2O2, and its molecular weight is 555.504 gm per mol1,2. A recent literature review reported that LC-MS and MS had been employed to analyze Bedaquiline and Rifabutin in human plasma3,4. A Liquid chromatography-Mass spectroscopy method has been reported to be useful in determining bedaquiline concentrations in human serum5-7. Bedaquiline was enantio-separated by polar stationary phases made of polysaccharides8. A pharmacokinetic study on bedaquiline9,10 and the physical and chemical sustainability of bedaquiline in hydrolytic systems at various pH levels were evaluated by isolating eight variation analog diastereomers by HPLC. They assessed the degradation kinetics of bedaquiline in the solution with UV spectrophotometric methods11,12. HPLC can simultaneously determine the levels of bedaquiline and endearing in plasma samples13. We have reported on the simultaneous enumeration and quantification by reversed Phase HPLC14 of bedaquiline (TMC-207), moxifloxacin, and pyrazinamide formulation. As a result of the literature review, we concluded that it is essential to develop analytical methods that are more sensitive, least expensive, take up less time, and use less drug quantity to estimate bedaquiline bulk and its tablet dosage form. As a result, the goal of this work is to provide a precise, accurate, and repeatable method for calculating the concentration of bedaquiline utilizing HPTLC, HPLC, and UV spectrophotometric techniques.
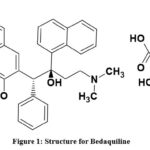 |
Figure 1: Structure for Bedaquiline. |
Experimental
Chemicals and reagents
Sirturo tablets labeled to contain Bedaquiline 100 mg. methanol (HPLC grade), glacial acetic acid, sodium acetate, ethanol, chloroform, and toluene were purchased from Loba chem (Mumbai, India). Throughout the project, calibrated glassware was used. All the reagents used in this study were AR Grades.
Instrumentation
In TLC, Silica gel 60 (F254) is coated on an aluminum sheet, and in HPTLC, a Sample applicator (Linomat-V) with a 100L Hamilton syringe. The plates were developed in a 20 cm x 10 cm CAMAG twin trough tank that had been soaked with the extraction solvent for 30 minutes prior to production. An RP-HPLC system with a serial dual plunger pump (micro-volume ten microliters on the primary side, five microliters on the secondary side) and a PDA detector with an injector were developed. As computation, Shimadzu lab solution software was used. A novel UV- spectrophotometry using an Ultra Violet visible double beam spectrophotometer has spectral widths of a nanometer and wavelengths accurate to 0.5 nanometer. 10 mm matched quartz cells in pairs were used. The digital scale Shimadzu AUX220 is utilized for weighing purpose15.
Preparation of stock solutions
Standard Solution
One hundred milligrams of BDQ were accurately weighed and transferred into One hundred milligram volumetric flasks. Methanol adds to dissolve. After ten minutes of sonicating, the volume of the solution was topped up with methanol to achieve 1000 mg per ml of BDQ concentration.
Sample solution
Weighing 10 tablets accurately and (Sirturo100 mg tablets), approximately the exact weight of the powdered tablet was identified. For dissolving the tablet powder, methanol was added to a flask containing one hundred milligrams of BDQ. Following this, the solution was sonicated for ten minutes. Methanol was used to makeup and then filter paper (Whatman -41) was used for filtering purposes. The finished solution contained 1000 μg per ml.
HPTLC Method
1, 1.5, 2.0, 2.5, and 3.0 ml of the 1000 µg/ml standard stock solution were pipetted into a 10 ml volumetric flask. The final concentration was 100, 150, 200, 250, and 300 micrograms per ml. Solutions were spotted on a pre-coated aluminum Plate 60 F254 using a CAMAG1000 µl sample applicator syringe. The plate for 20 mins placed in an oven at the temperature of 110oC before spotting the samples for activation. There was a constant flow rate of 0.1L per second, with a space between two bands of 10mm, and a constant application rate of 0.1L per second. Previously, ethanol: chloroform: toluene (6:3.5:0.05 v/v/v) was pre-saturated for 30 min in a twin trough chamber. To a distance of eight cm, it took 15 to 20 minutes to develop the plate. As a result of the development of the plate, it has been dried through passing air from the dryer. In order to scan the spots at 10 mm per second, they were slit at 5 mm by 0.45 mm as they developed at 240 nm16.
HPLC Method
Chromatographic conditions
The stationary phase C18 column was used in this method, and Buffer (Sodium acetate at pH-4.5) solvent phase. The samples flow at a speed of 1ml per min. Whattmann filter paper was used to filter the mobile phase. A detector (PDA) detects the compounds at 240nm. Under vacuum, Acetonitrile was mixed, degassed, and passed to 0.45 micron pore to filter.
Mobile Phase Preparation
About 700 ml of sodium acetate buffer (pH range 4.5) and 300 ml of methanol in an ultrasonic water bath were used to mix and degas the mixture for 5min. A 0.45 pore filter was used to separate the filtrate, which was transferred under vacuum into a volumetric flask containing 1 litre of filtrate.
Preparation of Calibration Curve solution
A 10 ml standard flask was filled with 0.5 ml of standard stock solution (1000 g/ml). Methanol (100g per ml) was then added to the solution, and from above said concentration (100 g per ml), 0.5, 1.0, 1.5, 2.0, and 2.5 ml pipetted out and transferred to the separate volumetric flask of 10ml capacity. Final concentrations ranged from 5 to 25 g per ml.
UV – Visible Spectrophotometric Method
Preparation of Stock solution for calibration
In a standard flask of 250 ml, 5.0 ml of the stock solution (1000 g per ml) was pipetted and transferred into the standard flask. The solution was made up to volume using methanol (20 g per ml). Using a pipette, 4, 8, 12, 16, and 20 ml solutions were pipetted from above the concentration (250g per ml) into 10 ml standard flasks. The resulting concentrations were 8 to 40 g per ml.
Validation
The method validation was conducted per International Conference on Harmonization Guidelines15-16.
Linearity and Range
HPTLC calibration curve of BDQ was prepared using methanol solutions containing 100, 150, 200, 250, and 300 mg per ml. To calculate the regression equations for the calibration curve, peak areas were plotted against BDQ concentrations. There were five determinations in each response. To calibrate BDQ with RP–HPLC, various concentration ranges, such as 5 to 25µg/ml, has been made by diluting the stock solution (standard). Under operating chromatographic conditions, an aliquot (10µl) of each solution was injected. UV-visible spectrophotometry was performed in methanol with BDQ solutions containing 8, 16, 24, 32, and 40 mg per ml of BDQ and measured at 240 nm. By plotting absorbance versus concentration, calibration curves are constructed.
LOQ and LOD
We calculated the detection and quantification limit, by SD and calibration curve. ICH guidelines estimated LOD and LOQ. LOD=3.3×σ/S and LOQ=10×σ/S, where σ is the standard deviation ‘S’ is the slope.
Content Estimation (Assay)
For content estimation, Sirturo100 mg tablets were used. The sample stock solutions were prepared for each HPTLC, HPLC, and UV method from the standard stock. Samples and standards were spotted for HPTLC. A chromatogram was recorded after injecting 20 liters of standard and sample solutions. Standard and sample absorbance were measured for the UV method. The purity percentage was calculated using peak area and absorbance.
Accuracy
BDQ recovery was calculated at three levels (50, 100, and 150%) to determine the method’s accuracy. We added known quantities of standard solutions of BDQ 100, 200, and 300g per ml to a pre-analyzed sample solution containing 15µg per ml BDQ before spotting 10µL of each solution on an activated silica plate. A known amount of standard BDQ 7.5, 15, 22.5µg per ml was mixed with pre-analyzed sample solution containing 15µg BDQ for performing reverse phase HPLC. To pre-analyze sample solutions containing 30µg per ml, known amounts of BDQ standard solution were added.
Precision
A procedure’s use circumstances will determine how much intermediate precision is required. For the HPTLC method, 200µg per ml was used for the triplicate determination. For the HPLC method, 15µg per ml concentration solution was used. The peak area was measured after the injection of 20µl of solution. The UV method found 24 µg per ml concentration solution absorbance at 240 nm.
Ruggedness
In this definition, reproducibility means that test results can be replicated no matter where they are performed, what analyzers are used, what instruments are used, and how long it takes to run the experiment.
Results
Precision, accuracy, and reproducibility were optimized for HPTLC, HPLC, and UV methods. Toluene: Acetonitrile, methanol: water, and methanol: chloroform ratios were used for HPTLC. Observe spreading and tailing spots. To overcome this problem, we used ethanol-chloroform-toluene (6:3.5:0.5). There was a sharp, symmetrical peak with Rf 0.63 (Fig 2). Different trials for HPLC were performed using different ratios of mobile phases (Water: Acetonitrile (55: 45) & Methanol: H2O 50: 50), Sodium acetate buffer (3.0): methanol 70%:30%), and it has flowed in range of 0.8, 1.0, 1.2ml per min. There was no tailing of peak and theoretical plate numbers within the limit (above 2000). In the end, sodium acetate buffer: & methanol (70:30%) was used. Chromatograms showed sharp peaks, and system suitability parameters were within limits. Fig 3 shows the optimized chromatogram. The solvent for the UV method was selected from the solubility study. A concentration solution of 10g per ml was prepared and scanned between 200-400nm. Fig 4 shows the UV spectrum at 240nm with maximum absorbance.
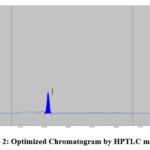 |
Figure 2: Optimized Chromatogram by HPTLC method |
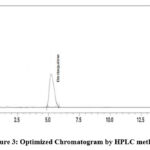 |
Figure 3: Optimized Chromatogram by HPLC method. |
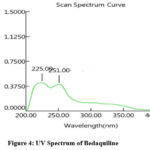 |
Figure 4: UV Spectrum of Bedaquiline |
Linearity
The range of analytes in a sample depends on the concentrations of analytes at their highest and lowest concentrations. In the case of HPTLC, a linear correlation was observed between peak areas and concentrations in the range (of 100 to 300g/ml) when the HPTLC method was used. The correlation coefficient came out to be r2=0.9992. A linear concentration value for the HPLC method was 0.9994 µg per ml, with a range from 5-25 µg per ml, and the r2 value was 0.9994 µg per ml. There was linearity in concentrations between 8 and 40 micrograms/ml of UV solution for the method, and a correlation coefficient value of 0.9997 was identified. Figures 5-7 show the calibration curves for HPTLC, HPLC, and UV methods. Table 1 shows linearity reports.
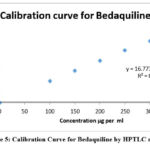 |
Figure 5: Calibration Curve for Bedaquiline by HPTLC method. |
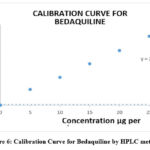 |
Figure 6: Calibration Curve for Bedaquiline by HPLC method. |
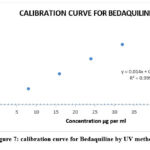 |
Figure 7: calibration curve for Bedaquiline by UV method |
Table 1: Reports for Linearity study.
|
Parameters |
HPTLC |
HPLC |
UV |
|
Range( µg/ml) y = mx + c r2 Slope (m) Intercept (c) LOD (µg/ml) LOQ(µg/ml) |
150-300µg/ml y = 16.773x + 60.979 0.9992 16.773 60.979 0.9081 0.1640 |
5-25 µg/ml y = 20387x + 5289.3 0.9994 20387 5289.3 0.0070 0.0212 |
8-40 µg/ml y = 0.014x + 0.0055 0.9997 0.014 0.0055 0.1791 0.5428 |
LOD and LOD
It was determined that the LOD and LOQ were 0.9081 µg per ml, 0.1640µg per ml, 0.0070µg per ml, 0.0212µg per ml and 0.1791µg per ml, 0.542µg per ml for HPTLC, HPLC and UV methods respectively. The report is shown in table 1.
Content Estimation
It was determined that BDQ is pure in tablet formulation by an assay (content estimation). An estimate of BDQ concentration from a calibration curve was selected and quantified. The tablet formulation Sirturo (100 mg tablets) was used for identification, and the purity of analytes present in the formulation was analyzed from 100.37 – 100.78% for the proposed methods. The % RSD values were 0.2048, 0.3678, and 1.4235 for the proposed methods. Table 2 shows the result.
Table 2: Content Estimation of Bedaquiline in marketed formulation by proposed methods.
|
Methods |
Standard peak area |
Sample peak area |
Mean (%) |
SD |
(%) RSD |
|
HPTLC |
|||||
|
1 |
3447.8 |
3453.3 |
|||
|
2 |
3475.3 |
3481.4 |
100.37 |
0.2056 |
0.2048 |
|
3 |
3463.2 |
3470.3 |
|||
|
Average |
3462.1 |
3475.3 |
|||
|
HPLC |
314092 |
315223 |
|||
|
1 |
315324 |
318401 |
|||
|
2 |
314962 |
318230 |
100.78 |
0.3707 |
0.3678 |
|
3 Average |
314792.6 |
317284.6 |
|
||
|
Absorbance of standard |
Absorbance of sample solution |
||||
|
UV 1 2 3 Average |
0.346 0.353 0.340 0.346 |
0.342 0.357 0.345 0.348 |
Precision
A study of intermediate precision confirmed the method’s precision. The analyses of standards were carried out. The % of RSD of the intermediate precision analysis of Bedaquiline was found to be 0.7657, 0.0871, and 1.585 % for HPTLC, RP-HPLC, and UV, respectively. The reports are shown in table -3
Table 3: Data for Intermediate Precision by proposed methods
|
S.No |
HPTLC |
HPLC |
UV |
|
1 2 3 4 5 6 Avg SD %RSD |
3447.8 3463.6 3476.5 3404.7 3423.8 3452.9 3444.8 26.38 0.7657 |
314268 314394 314942 314727 314904 314749 314664 274.15 0.0871 |
0.346 0.348 0.353 0.333 0.340 0.354 0.347 0.0055 1.585 |
Accuracy
The formulation solution previously analyzed was diluted with pure drugs to evaluate the method’s accuracy. To analyze the mixture, a method was proposed. A calculation was made to determine the amount of drug recovered. Our study found that the percentage recovery for HPTLC, RP-HPLC, and UV methods was 1000.13% to 100.63%. RSDs were found to be less than 2%. Table 4 shows the results.
Table 4: Data for Accuracy study for the proposed methods.
|
Various Methods
|
Concentration (%) |
Added Amount µg/ml |
Amount Found µg/ml |
Recovery Mean (%) |
SD |
RSD (%) |
|
HPTLC |
50 100 150 |
100.00 200.00 300.00 |
90.10 180.21 270.45 |
100.13 |
0.0307 |
0.0305 |
|
HPLC |
50 100 150 |
4.00 8.00 12.00 |
3.98 8.12 11.95 |
100.16 |
1.1547 |
1.1527 |
|
U0056 |
50 100 150 |
15.00 30.00 45.00 |
15.09 30.32 45.11 |
100.63 |
0.4110 |
0.4082 |
Ruggedness
A ruggedness validation was performed on the developed method. An independent lab is rugged if it can maintain high precision over multiple days while using multiple analysts, instruments, and reagents from different sources. The results are shown in Table 5. The % of RSD was 1.283, 0.643, and 0.994% for HPTLC, HPLC, and UV, respectively.
Table 5: Data for Ruggedness study.
|
Method |
Different conditions |
Average Percentage |
SD |
(%) RSD |
|
HPTLC |
Analyst-I Analyst-II |
101.10 99.28 |
1.286 |
1.283 |
|
HPLC |
Analyst-I Analyst-II |
98.42 99.32 |
0.636 |
0.643 |
|
UV |
Analyst-I Analyst-II |
99.43 98.04 |
0.982 |
0.994 |
Discussion
The quantitation and detection limits are shallow, indicating that the method is sensitive. Compared with the developed method, the reported Reverse Phase HPLC11 and Ultra Violet13 methods had higher LOD and LOQ values. Therefore, the developed method was more sensitive than the reported method (Table -6).
% RSD value below 1.3, considered acceptable, validated the robustness and repeatability of the method. (Acceptance criteria – not more than 2 %). Precision and repeatability were good for the developed method. For the developed RP-HPTLC, HPLC, and UV spectroscopic methods, the RSD values were less than 2%. RSD values were not affected by excipients used in formulations. As a result, it can be concluded that the method is accurate. This resulted in the methods being more accurate as a result of this. With the three methods, the estimation of drugs was accurate, precise, and rapid. HPLC was more sensitive than the other methods when comparing the sensitivity of the three methods since the LOD and LOQ values in HPTLC and UV methods were lower than those of HPLC and UV. Therefore, it is concluded that all three methods can be successfully applied for the routine analysis of the quality control of the BDQ in bulk and as tablets for dosage forms as part of the routine quality control process.
Table 6: Comparison between the reported method and advanced method.
|
HPLC and UV |
Reported method (11&13) |
Developed method |
|
Linearity LOD LOQ |
10-100 µg/ml 0.3272µg/ml 0.9525µg/ml |
5-25 µg/ml 0.0070 0.0212 |
|
Linearity LOD LOQ |
15-75 µg/ml 2.72 µg/ml 8.23 µg/ml |
8-40 µg/ml 0.1791 0.5428 |
Conclusion
A simple, accurate, and reproducible quantitative analysis of BDQ in tablet form was developed and validated by HPTLC, reversed-phase HPLC, and UV visible spectrophotometry. According to the analysis results, the concentration range was linear, and the value of the correlation coefficient was r2<0.999 for the three methods. Compared to the developed method, the reported RP-HPLC and UV methods had higher linearity ranges. Thus, by utilizing the developed method, it is possible to estimate BDQ when the least amount of drug needs to be administered.
Acknowledgment
We acknowledge the management of Vels Institute of Science, Technology and Advanced Studies (VISTAS), Pallavaram, Chennai-600 117, Tamil Nadu, India, for providing a research facility.
Conflict of Interest
We declared that there are no Conflicts of Interest.
Funding Support
There is no funding sources.
References
- Yadav S, Rawal G, Baxi M. Bedaquiline. A novel antitubercular agent for the treatment of multidrug-resistant tuberculosis. J Clin Diagn Res. 2016; 10:FM01–FM02.
CrossRef - Raviglione MC, Kochi A, Snider DE. Global epidemiology of tuberculosis: morbidity and mortality of a worldwide epidemic. JAMA. 1995; 273:220–226.
CrossRef - Lee SH. Tuberculosis infection and latent tuberculosis. Tuberc Respir Dis (Seoul). 2016;79:201–206.
CrossRef - Nazir T, Abraham S, Islam A. Emergence of potential superbug Mycobacterium tuberculosis, lessons from New Delhi mutant-1 bacterial strains. Int J Health Sci (Qassim). 2012; 6:87–94.
CrossRef - Gray WA, Waldorf B, Rao MG, et al. Development and validation of an LCMS/MS method for the simultaneous determination of Bedaquiline and Rifabutin in human plasma. J. Pharm. Biomed. Anal. 2019; 176:112775.
CrossRef - Alffenaar JWC, Bolhuis M, Van Hateren K, et al. Determination of bedaquiline in human serum using liquid chromatography-tandem mass spectrometry. AAC., 2018; 59:5675– 5680.
CrossRef - Hui Z, Zhong-Quan L, Li X, Shao-Chen G, et al. Determination of Bedaquiline plasma concentration by high-performance liquid chromatography-mass spectrometry/mass spectrometry. Chinese Journal of Antituberculosis. 2018; 40:1319.
- Dousa M, Reitmajer J, Lustig P, Stefko M. Effect of chromatographic conditions on Enantio-separation of Bedaquiline using polysaccharide-based chiral stationary phases in RP-HPLC. J. Chromatogr. Sci. 2016; 54:1501–1507.
CrossRef - Jiang S, Wu C, Yu J, Sun T, Guo X. Separating eight bedaquiline analog diastereomers by HPLC on an immobilized polysaccharide-based chiral stationary phase; Chirality. 2019; 31:72–78.
CrossRef - Gone V, Thakur S, Akoju Y, et al. Pharmacokinetic study of bedaquiline among Indian mdr-tb patients in a clinical setting. Author. 2021; 24:34-40.
CrossRef - Rajput SJ, Vanavi PJ. Evaluation of physicochemical stability and degradation kinetics of bedaquiline in hydrolytic solutions of different pH. Future J. Pharm. Sci. 2021; 88.
CrossRef - Kumar AKH, Sudha V, Vijaya Kumar A, Padmapriyadarsini C. Simultaneous method for estimating bedaquiline and delamanid in human plasma using high-performance liquid chromatography. Int. J. Pharm. Pharm. Sci. 2021; 13:36– 40.
CrossRef - Pooja BS, Shetty SS. Develop and validate UV spectrophotometric methods for estimating bedaquiline in bulk and pharmaceutical formulations. World. J. Pharm. Res. 2018; 7:1579–1586.
- Momin MA, Rangnekar B, Das SC. Development and validation of an RP-HPLC method for simultaneous quantification of bedaquiline (TMC 207), moxifloxacin, and pyrazinamide in a pharmaceutical powder formulation for inhalation; J. Liq. Chromatogr. Relat. Technol. 2018; 41:415–421.
CrossRef - ICH Harmonized Tripartite Guideline, ICH Q2 (R1) Text & Methodology; November 2007.
- ICH Harmonized Tripartite Guideline, ICH Q2 (R1)/Q14 EWG Analytical procedure development and Revision of Q2 (R1) Analytical; November

