
Manuscript accepted on :21-03-2023
Published online on: 06-02-2024
Plagiarism Check: Yes
Reviewed by: Dr. Rishit Jangde
Second Review by: Dr. Alvi Maroof
Final Approval by: Dr Ayush Dogra
Swaroopa H N* , Basavaraj N Jagadale, Omar Abdullah Murshed Farhan Alnaggar, Vijayalakshmi Hegde and Abhisheka T E
Department of PG studies and research in Electronics, Kuvempu University, Shankaraghatta, Shimoga, India
Corresponding Author E-mail: swaroopampl@gmail.com
DOI : https://dx.doi.org/10.13005/bpj/2872
Abstract
The most demanding aspect of digital image processing is segmenting an image efficiently. Cell segmentation or classifying cells in an image is essential while analyzing cell images in medical research, especially in spot diagnosis, cancer cell detection, and live-cell imaging segmentation forms a crucial component. This research examines existing segmentation algorithms and suggests a new segmentation technique that employs image filtering and thresholding. Thresholding is an essential part of image analysis and segmentation. Finally, the segmented image and the FCM (fuzzy C-means) based clustered image are merged. In terms of accuracy, sensitivity, dice-coefficient, and Jaccard-coefficient, the simulation coupled with ground truth data is proven to produce better segmentation outcomes.
Keywords
Antinuclear antibody (ANA); Gaussian filter; Human epithelial type2 (HEp-2) cell image; Image fusion; Immune fluorescent (IIF); Segmentation
Download this article as:| Copy the following to cite this article: Swaroopa H. N, Jagadale B. N, Alnaggar O. A. M. F, Hegde V, Abhisheka T. E. Human Epithelial Cell Image Analysis and Segmentation using Threshold Based Fusion Technique. Biomed Pharmacol J 2024;17(1). |
| Copy the following to cite this URL: Swaroopa H. N, Jagadale B. N, Alnaggar O. A. M. F, Hegde V, Abhisheka T. E. Human Epithelial Cell Image Analysis and Segmentation using Threshold Based Fusion Technique. Biomed Pharmacol J 2024;17(1). Available from: https://bit.ly/42BsdCb |
Introduction
The rapid development of new technologies in the field of image processing has helped in discovering human abnormalities at an early stage and is faster than manual methods. Image analysis and segmentation have an essential role in the medical field and help in the early detection of diseases in critical health conditions. Due to the structural complexity and type of the cell image, radiologists may face difficulties in extracting the necessary features of the image, 1 which are crucial in treating the patient. Therefore, correct and meaningful segmentation is a challenging task and is required for further process.
The most used substrate for finding the antinuclear antibody (ANA) is the human epithelial type2 (HEp-2) cell samples, which are a natural protein array with plenty of antigens. The discovery of ANA in human serum is a vital transmission instrument for connective tissue syndromes, and immune fluorescent (IIF) is the reference method for ANA testing. Indirect immune fluorescent (IIF-ANA) test is becoming increasingly crucial for analyzing the cell image because of its ease and inexpensiveness 1, 2. The attributes of epithelial type-2 (HEp-2) cells are an oval shape with merged properties of connected tissues, which help in microscopic observation and provide better result in detecting the number of antibodies with better resolution. Therefore, cell image segmentation is an essential task that examines the appropriate biological features such as cell type, shape, group, etc. The experimental studies are focused mainly on (HEp-2) cell image and aim to identify and segment the cells based on ground truth data.
Several computer vision methods have been developed for a variety of applications in image processing. The first phase of computer vision includes pre-processing and image segmentation.3 In this stage dissimilar objects are identified and separated from the background. The next part is feature extraction, where object are measured. The computing of image features to quantitatively evaluate some significant features of object. These clusters are combined to create a feature vector during feature mining. 4, 5 The next level is classification. At this point, the output is only a decision to conclude the class of each object. The structural study is an explanation of images to properly recognize and judge the vital details of images. 6 – 15
Thresholding
Thresholding is the fundamental way to do image segmentation. The grayscale image is taken as input data, and the output image will be in the form of binary. The simplest thresholding 3 method substitutes every pixel in an image with a dark pixel if the image intensity {\display style I {i, j}} Ii, j is less than definite static constant T (that is, Ii, j < T {\display style I {i, j} < T}), or a bright pixel if the image intensity is more than that constant.
Global threshold
The histogram is a graphical way of representing the image intensity. It reveals two points for an indication from the background and the foreground, respectively. Manual thresholding 3 involves intensity value (threshold) such that total pixels having an intensity value lesser than the threshold fit to one segment, and the rest of the part fits the other. Global thresholding provides better results only when the degree of intensity separation between the two points in the image. It is an unsophisticated segmentation selection 4.
 |
Figure 1: Graphical representation of histogram data. |
Otsu’s threshold
Image segmentation splits an image into its subareas and is a crucial task in mining image features, especially in medical image analysis and segmentation approaches. Due to its understanding of perception and ease, the thresholding technique is important and essential part of diagnosing medical images. 5, 6 Usually, the histogram-dependent threshold choice technique, and “the maximum between-class variance method proposed by the Japanese scholar Otsu used”. The selection of principle threshold criteria technique reflects the largest interclass difference between the object and background. Similarly, by varying the Otsu’s threshold level is either 0 or 1 to get an FCM threshold. Thus, in the analysis of general as well as medical images, this technique provides better results compared to some of the popular methods. 11, 12 The algorithm steps are given by
Initial estimation of T
Segmentation using of T
g1 pixel brighter than T
g2 pixel darker than T
[computation of average Intensities m1 and m2 of g1 and g2]
if [T-Tnew]>∆Tbacktostep 2, otherwise stop.
Adaptive threshold
In an adaptive threshold, the threshold value is calculated for a particular region, thus it varies from the threshold rate at every pixel position based on the adjacent pixel values. 6 To estimate the threshold T (x, y) i.e. the threshold value at pixel position (x, y) in the image.13-16

Multilevel threshold
Multilevel thresholding is the most applicable and popular image segmentation technique. 7 Here, thresholding is assigned to segment a gray-level image into some discrete areas. Here, more than one threshold criterion is chosen to analyze the given image. 10
Optimal threshold
Choosing a threshold in the valley between two overlapping peaks classifies the pixels inappropriate way. The selection of optimal threshold and the optimal regulation can be done inevitably by a similar learning process and is explicitly for the optimal selection of threshold used in predications. The directions from examples and counterexamples have been projected by reducing an entropy function. 8 The rules have the procedure of disjunctions of conjunctions of predicates. Thus, such a method can study commands from cases, and depends on an optimality principle. 9, 10
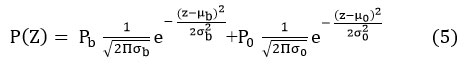
pb (z), p0 (z), prob. distributions of background, object pixels.
μb, μ0 : the means of the distributions.
σb, σ0 : the standard deviations of the distributions.
Pb, Po : the a-priori probabilities of background, object pixel. 17
 |
Figure 2: Optimal threshold selection in between the overlapping peaks. |
K-means clustering
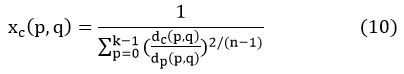
This algorithm is a simple and effective unsupervised technique, which can be used for various applications like abnormality detection, pattern analysis, image scene understanding, etc. It classifies a sample set Y (y1, y2, y3…. yn) into groups with the endeavor at minimizing an objective function J is given by, 18
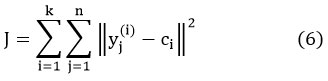
where, n represents the quantity of samples and ci is the cluster center, where, ‖yj(i) -ci ‖2 is the “Euclidean distance measure between a data point yj and the cluster center ci”. 19
Algorithm steps
Compare the distributed pixel intensity of the objects.
Initialize the centroids with K random intensities.
Recurrence the step till each cluster get labeled.
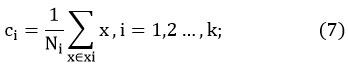
Here, N is the sample number of the ith cluster.
Cluster the points based on distance of their intensities from the centroid intensities.
Compute the new centroid for each of the clusters. 20
Fuzzy c-means clustering
FCM algorithm for detecting optimal partition of cluster points is one of the popular techniques for analysis of both cell and MRI images. It splits the data points into subareas named cluster groups. Here the clustering points are automatically assigned after the pre-processing stage, and the associate function is the curve that defines how each point in the input space is mapped to the degree of associated value between 0 and 1. During the iteration process, at each cycle, optimized cluster points are generated. 18, 21, 22
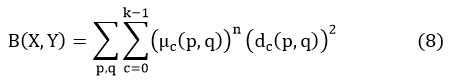
Where, A represents the image and A = {Z (A, B), 0 < A ≤ M, 0 < B ≤ N}, and M*N denotes the cluster points.
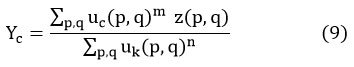
where, Y= {Y0, Y1, Y2,…. Yc-1} signifies the data points
X = [μc (p, q)] is the matrix,
‘n’ represents the constant.
μc (p, q) is the associated data points of Z (A, B) at the Cth cluster,
“dc (p, q) is the Euclidian distance of the data point Z (A, B) from the Cth cluster”. 21
Clusters number K (2 ≤ K < M*N) with original clustering matrix values are labeled.
The data points Yc, and fuzzy matrix Xc (p, q) are fixed by utilizing equations [9], [10], correspondingly.
The procedure is recurring till the quantities varying among two iterations and is not more than ε. 22, 23
The rest of this paper is structured as, proposed work in Section 2, the flowchart, and algorithm of the proposed method are presented in section 3, the result are given in section 4, and the conclusions in section 5.
Proposed method
Firstly, the input cell image is transformed to grey scale, and a Gaussian filter is employed to eliminate noise contamination in the cell image. 8 A denoised image is then thresholded by an automated higher threshold value in conjunction with binary smoother. However, the thresholded pixel values are fewer than the image’s mean frequency. The resulting image is processed with a “remove border” operation, and the thresholded image is equalized using an adaptive histogram. The picture is simultaneously denoised and segmented using an FCM (fuzzy C-means) based clustering approach. Finally, combining these two with the fusion procedure results in a new segmented image. The resultant image is more suitable to ground truth data, and is compared with existing thresholding algorithms. 12
Gaussian filter
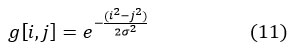
The Gaussian filter is a type of linear smoothing filter in which the weights are chosen according to the Gaussian function procedure for removing noise from a normal distribution. Two-dimensional discrete Gaussian zero mean-function is employed as a smoothing filter in image processing.
Higher Threshold
Bernsen’s locally adaptive binarization approach is utilized to extract the adhesive cell image feature from a grayscale picture. It is also tested for various neighborhood values and contrast limitations.
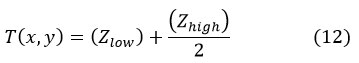
(Zlow) is the lowest and (Zhigh) is the highest gray level pixel value in a square r x r neighborhood centered at pixel (x, y),
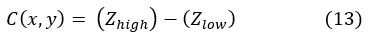
If the contrast measure C (x, y) < l, the neighborhood is made up of only one class, foreground or background. Furthermore, r and l values altered based on the image regions employed.
Binary smoother
Binary smoothing is a method for smoothing data or filtering noisy data. The data is first categorized, and the sorted values are distributed across many segments or cells. The technique conducts local smoothing since they refer to a neighborhood of data. Smoothing by binary means replaces each value in a binary with the binary mean value.
Adaptive histogram
The image is splits into discrete blocks, and a histogram is computed for each segment. Thus, adaptive histogram equalization computes many histograms, each of which corresponds to a different part of the picture. Consequently, it improves the local contrast and edge definitions in all segregated sections of the image.
Material and methods
Flow chart
 |
Figure 3: Schematic flowchart of the proposed method. |
Algorithm steps
Input: Cell image to be segmented
Output: Segmented image
A cell image is converted to a gray-scale image.
Image denoising is performed with the Gaussian filter to diminish the noise contamination in the cell image.
Higher_threshold value is used to extract the required features from a denoised image, with binary smoother.
Segmented image is processed by adaptive histogram, which is more accurate and noise-free.
The combination of FCM clustered image along with the segmented image is fused to obtain the final target image.
Results and Discussions
Performance matrices
The proposed algorithm is coded and executed in (MATLAB R2020a). The cell image (Hep-2) and the corresponding reference data is extractedfrom SNPHep-2 Dataset. The results are compared with existing methods and are found to be better.
Accuracy
It specifies the perfect class of the image pixels. The measure of accuracy 24 is given by
Pixels which are perfectly incorporated into the given class are represented by TP and TN represents the pixels which are not belonging to the specified class. FN is incorrectly projected pixels, which are not fitting to the specified class.
Sensitivity
Sensitivity is calculated through positive predicted and negative predicted values, which is the ratio of true outcome of all segmented results. 24
Dice co-efficient
Dice-coefficient examines the identical things in between the segmented data and the reference data, which is retrieved from manual segmentation. Dice-coefficient of segmented image 24, 25 is given by
where, |M|and |N|cardinalities of two sets.
Jaccard-coefficient
Jaccard-coefficient is as same as the dice-coefficient, which calculates the commonness in-between ground truth data with different segmentation methods employed in this paper and 24, 25 is given by
Experimental results
 |
Figure 4: a. Input cell raw image, b. Ground truth image, c. Enhanced image, d. Grayscale image |
 |
Figure 5: Segmented by: a. Global_ threshold, b. Otsu’s_threshold, c. Adaptive_threshold, d. Multilevel_threshold. |
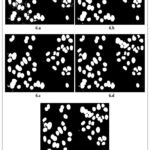 |
Figure 6: Segmented by: a. K-means_clustering, b. FCM_clustering, c. FCM_threshold, d. Higher_threshold, e. Proposed method. |
Table 1: Comparison of Hep-2 cell image segmentation result.
|
Cell image |
Global_T |
Otsu’s_T |
Adaptive_T |
Multi- Level_T |
Fcm-C |
K-means |
Fcm_T |
Higher_T |
Proposed method |
|
Accuracy in % |
97.39 |
95.67 |
86.65 |
95.67 |
95.67 |
94.89 |
97.34 |
97.41 |
97.66 |
|
Sensitivity in % |
92.01 |
85.82 |
85.82 |
85.82 |
85.70 |
91.14 |
91.42 |
90.60 |
95.68 |
|
Dice Coefficient in % |
93.96 |
89.20 |
89.20 |
89.20 |
89.17 |
88.07 |
93.46 |
93.98 |
94.44 |
|
Jaccard Coefficient in % |
88.67 |
80.50 |
80.50 |
80.50 |
80.45 |
78.68 |
87.20 |
87.93 |
89.47 |
 |
Figure 7: Performance evaluation of suggested study with existing techniques. |
Conclusion
A unique threshold-based image segmentation approach is suggested in this paper. The proposed model’s performance is compared to manual and current segmentation approaches, as well as the pre-processing procedure. However, instead of current segmentation strategies, the suggested method delivers superior segmentation by integrating the FCM-based clustering technique with image segmented by higher thresholding, which is one of the study’s important advantages. Furthermore, classic threshold-based segmentation approaches such as Otsu’s, multi-level, and FCM thresholding methods, suffer, loss of intrinsic information after segmenting the cells, whereas global and adaptive thresholding give superior segmentation, but the threshold criteria must be set manually. Although unsupervised clustering techniques such as K-means and FCM are popular, the findings of both approaches do not meet the acceptable level throughout the assessment, particularly for adhesive cell segmentation. As a result, the proposed method has an edge and is useful in segmenting the adhesive Hep-2 cell image without sacrificing essential information at the fusion level. While examining the biological aspects of the Hep-2 cell image, radiologists will find the entire research quite useful. The simulation output of the proposed study is more effective and efficient in terms of computing. It is discovered that performance metric’s sensitivity parameter improves by around 3%, and the segmented image’s effectiveness is assessed in terms of accuracy, sensitivity, dice-coefficient, and Jaccard-coefficient. The main contribution of this work is the improvement of performance measure, which is supported in all of these factors and is clear from the outcomes of the proposed algorithm.
Acknowledgement
Standard test image samples used in this work were extracted from SNPHEp-2 Dataset, (https://staff.itee.uq.edu.au/lovell/snphep2/).
Conflict of interest
There is no conflict of interest.
Funding Source
There are no funding sources
References
- Rintu Maria Thomas, Jisha John, A review on cell detection and segmentation in microscopic images, 2017 international conference on circuits, power and computing technologies [iccpct], IEEE xplore: 19 october 2017, doi: 10.1109/iccpct.2017.8074189.
CrossRef - Simone Tonti Santa Di Cataldo Andrea Bottino Elisa Ficarra, An automated approach to the segmentation of HEp-2 cells for the indirect immunofluorescence ANA test, Computerized Medical Imaging and Graphics, Volume 40, March 2015, Pages 62-69, https://doi.org/10.1016/j.compmedimag.2014.12.005.
CrossRef - S.Sudha, G.R.Suresh and R.Sukanesh, Speckle noise reduction in ultrasound images by wavelet thresholding based on weighted variance. doi:10.7763/ijcte.2009.v1.2.
CrossRef - Huiping Yang, Haoyun Kuang, Xu Qin, and Guanyu Cai, Global threshold prediction of multicarrier multipactor with time distribution and material coefficients he wen, member, IEEE, doi: 10.1109/temc.2017.2763955.
CrossRef - J. Gholampour, A.a. Pouyan, The segmentation of FMI image layers based on FCM clustering and otsu’s thresholding, international journal of scientific & engineering research volume 3, issue 3, march-2012, ISSN 2229-5518.
- Panelshijian Chenpengjianshang, An adaptive method for threshold of recurrence quantification analysis based on sax, doi.org/10.1016/j.cnsns.2019.105061.
- Amit Gurung, Sangyal Lama Tamang, Image segmentation using multi-threshold technique by histogram sampling, september 2019, project: digital image processing.
- Panelb.Wangab, l.Chenaj.Chengc, New result on maximum entropy threshold image segmentation based on P system. doi.org/10.1016/j.ijleo.2018.02.062.
- Chunyuan Wan; Mingquan Ye; Chuanwen Yao; Changrong Wu, Brain MR image segmentation based on gaussian filtering and improved FCM, 2017 10th international congress on image and signal processing, biomedical engineering and informatics (cisp-bmei), IEEE xplore: 27 february 2018, doi: 10.1109/cisp-bmei.2017.8301978.
CrossRef - Thresholding (Jain et al., Sections 3.2.1, 3.2.2, Petrou et al., Chapt 7).
- Xiaoqiang Ji, Yang Li, Jiezhang Cheng, Yuanhua Yu*, Meijiao Wang, Cell image segmentation based on an improved watershed algorithm, 2015 8th international congress on image and signal processing (cisp 2015), 978-1-4673-9098-9/15/$31.00 ©2015 IEEE.
- N.Valliammal, Dr.S.N.Geethalakshmi, Leaf image segmentation based on the combination of wavelet transform and k-means clustering. (ijarai) international journal of advanced research in artificial intelligence, vol. 1, no. 3, 201237 | page www.ijarai.thesai.org, Vol. 1, No. 3, 2012, doi:10.14569/ijarai.2012.010307.
CrossRef - M. Petrou and P. Bosdogianni, Image processing the fundamentals, wiley, uk, 2004.r. c. gonzalez and r.e. woods, digital image processing 2nd edition, prentice hall, new jersey, 2002.
CrossRef - Mantosh Biswas* and Hari Omindian, A new soft-thresholding image denoising method, 2nd international conference on communication, computing & security [icccs-2012] . school of mines, dhanbad-826004, jharkand, india. Procedia Technology 6 (2012) 10 – 15, doi: 10.1016/j.protcy.2012.10.002.
CrossRef - B. K. Shreyamsha Kumar, Image denoising based on non-local means filter and its method noise thresholding. doi 10.1007/s11760-012-0389-y.
- Grace Chang, bin yu, martin vetterli, Adaptive wavelet thresholding for image denoising and compression. February 2000, IEEE transactions on image processing 9(9):1532-46, doi:10.1109/83.862633.
CrossRef - H.D. Cheng, X.H. Jiang, Jingli, Color image segmentation based on homogram thresholding and region merging. Wang department of computer science, utah state university, logan, ut 84322-4205, usa received 31 january 2000; received in revised form 29 january 2001; accepted 29 january 2001.
- Youguo Li, Haiyan Wu, A clustering method based on k-means algorithm, 2012 international conference on solid state devices and materials science, elsevier physics procedia 25 (2012) 1104 – 1109. december 2012physics procedia 25:1104-1109, doi:10.1016/j.phpro.2012.03.206.
CrossRef - B. Padmapriya, M. S. Sangeetha, G. Ramya Priya Nandhini, T. T. Anusha Devi. Detection of malarial parasites using image processing techniques from blood smear slides, RJPT, volume – 11, issue – 10, year – 2018, doi: 10.5958/0974-360X.2018.008053.
CrossRef - Jianwei Liu1, a, Lei Guo1, b *, An improved k-means algorithm for brain MRI image segmentation, 3rd international conference on mechatronics, robotics and automation (ICMRA 2015). Available Online April 2015, https://doi.org/10.2991/icmra-15.2015.210.
CrossRef - Abhishek Bala, *, Minakshi Banerjeea, Amlan Chakrabartib, Punit Sharmac, MRI brain tumor segmentation and analysis using rough-fuzzy c-means and shape-based properties, journal of king saud university, computer and information sciences, 1319-1578, https://doi.org/10.1016/j.jksuci.2018.11.001.
CrossRef - Yogita K. Dubey and Milind M. Mushrif, FCM clustering algorithms for segmentation of brain MR images, hindawi publishing corporation advances in fuzzy systems, volume 2016, article id: 3406406, 14 pages, http://dx.doi.org/10.1155/2016/3406406.
CrossRef - Akila Victor, Muhammad Rukunuddin Ghalib, Detection of skin cancer cells –a review, RJPT, Volume – 10, Issue – 11, Year – 2017, DOI: 10.5958/0974-360X.2017.00742.9.
CrossRef - Karlijn, J. van, Stralen1 vianda, S. Stel1 johannes, B. Reitsma2 friedo, W. Dekker13 carminezoccali4 kitty, J.Jager1. Diagnostic methods i: sensitivity, specificity, and other measures of accuracy, under an Elsevier user license,https://doi.org/10.1038/ki.2009.92.
CrossRef - Jeroenbertels j.b. and T.E. Optimizing the dice score and jaccard index for medical image segmentation: theory & practice, have contributed equally to this work.11esat, center for processing speech and images, kuleuven, Belgium.

