
Manuscript accepted on :11-03-2024
Published online on: 24-03-2024
Plagiarism Check: Yes
Reviewed by: Dr. Rosaline Vimala J
Second Review by: Dr. Sherif Ramzy
Final Approval by: Dr. Prabhishek Singh
Ahmad M. Al Jaafreh*
Department of Medical Laboratory Sciences, Mutah University, Mutah, Jordan.
Corresponding Author E-mail:am_jaafreh@yahoo.com
DOI : https://dx.doi.org/10.13005/bpj/2860
Abstract
The evaluation of the antioxidant activity of different solvents of rosemary extract would involve testing the efficacy of various solvents in extracting antioxidants. This can be done by measuring the antioxidant capacity of the extracts using different assays. The solvent that results in the highest antioxidant activity can then be considered the most effective for extraction purposes. This study examined the effects of several solvents on the extract of rosemary leaves, including its total phenolic content, total flavonoid content, total tannin content, and antioxidant activity. Six different in-vitro methods DPPH, ABTS, FRAP, ferric reducing power, total antioxidant activity, and nitric oxide (NO) radical scavenging—were used for the antioxidant activity assessment. The TPC, TFC, TTC, and antioxidant capacity were all highly and considerably impacted by the extraction solvents. In general, the maximum TPC (72.34 GAE mg/g) and TFC (26.81 RE mg/g) were found in the ethanol extract. while aqueous extract had the highest TTA value (20.25 GAE mg/g). In the (NO) radical scavenging assay (86.68 RE mg/g) and DPPH (138.3 GAE mg/g) assays, methanol extract exhibited the best antioxidant activity, the aqueous extract had the highest activity in ABTS (125.33 TE mg/g), and ferric reducing power (144.5 AScE mg/g), in comparison, ethanol extract had the highest activity in FRAP (130.5 AScE mg/g) and total antioxidant activity (178.86 GAE mg/g) of rosemary leaves, also methanol extract shown the highest antibacterial activity. In addition, R2 (The coefficient of determination) values established a significant correlation between the phytochemical content and all antioxidant methods utilized. The highest R2 value was between FRAP assay and TPC and TFC, (0.8814), (0.9878) respectively, as DPPH with the TTC (0.923). R2 values also proved a strong correlation between antioxidant methods used, where the highest R2 was between frap and ferric reducing power (0.8985), and the lowest between DPPH and total antioxidant activity (0.5337).
Keywords
Antioxidant activity; Essential oil; Rosemary; Rosmarinus officinalis
Download this article as:| Copy the following to cite this article: Al-jaafreh A. M. Evaluation of Antioxidant Activities of Rosemary (Rosmarinus officinalis L.) Essential Oil and Different Types of Solvent Extractions. Biomed Pharmacol J 2024;17(1). |
| Copy the following to cite this URL: Al-jaafreh A. M. Evaluation of Antioxidant Activities of Rosemary (Rosmarinus officinalis L.) Essential Oil and Different Types of Solvent Extractions. Biomed Pharmacol J 2024;17(1). Available from: https://bit.ly/43uFuNk |
Introduction
Rosmarinusofficinalis L. a fragrant perennial shrub with needle-like leaves, belongs to the mint family (Lamiaceae) and is popularly known as rosemary. It is indigenous to the Mediterranean and certain parts of Asia, but because of its ornamental value, culinary applications, and usage in traditional medicine, it has lately spread to wide regions. Many studies have demonstrated the antioxidant qualities of rosemary extract, which is why it’s utilized in food as a natural antioxidant as well as an outstanding taste element1,2. Reports suggest that rosemary extract may help prevent oil from oxidizing2–6. Due to the widespread need for more natural antioxidants, there has been a lot of activity in the quest for novel natural substances to limit or replace synthetic compounds. Numerous scientific researchers have examined the chemical makeup and biological properties of rosemary for a variety of reasons. These include the plant’s historical usage in medicine and its abundance of biological secondary metabolites and phytochemicals. It helps to explain why rosemary is known as a traditional medicinal herb. research conducted on rosemary as the number of plants grew over time due to the development of more advanced analytical techniques. Nowadays, one of the most popular fragrant and medicinal herbs utilized worldwide is rosemary. The majority of the explanation for its relevance was the abundance of bioactive compounds it contained. Within rosemary leaves, the most significant antioxidant polyphenolic components are carnosic acid, rosmarinic acid, and related stable compounds such as romano, carnosol, epirosmanol, and 7-metylepirosmanol7–9.
The high concentration of hydroxyl groups that form a unique spatial arrangement in flavonoids, and that inhibit the oxidation of lipids and eliminate reactive substances like superoxide, hydroxyl, and alkoxy radicals, may be the cause of the antioxidant properties of polyphenol compounds and flavonoids, which act as scavengers for free radicals. They also play a critical role in avoiding atherosclerosis and thrombosis by reducing the permeability of capillaries and fragility and inhibiting platelet aggregation. Additionally, since they can assist certain carcinogens in exiting cells and activate enzymes that detoxify, phenolic compounds may have anticarcinogenic properties10. One of the herbs with the greatest antioxidant properties is the herb rosemary7, which is also a highly significant supply of polyphenols11. Rosemary has been employed in the culinary, cosmetics, traditional medicine, and chemical industries12,13.
Evaluating plant extracts’ antioxidant potential is crucial since they may include a variety of antioxidant components that depend on the characteristics of the solvent employed in the extraction process, Various components from the rosemary can be extracted by various solvents, which will have varying effects on the antioxidant activity. For instance, phenolic chemicals, which are primarily responsible for rosemary’s antioxidant properties, may be effectively extracted using methanol14. Conversely, extractions made with water are expected to tend to be less active as antioxidants than extractions made using organic solvents like methanol and ethanol. It is crucial to remember that the particular goals of the investigation and the intended result should guide the choice of solvent.
The assessment of the properties exhibited by extracts that utilize
varied plant components should be based on the findings acquired using the same
experimental circumstances.
Additionally, the variations in the chemical makeup and bioactive compounds
found in plants are mostly determined by the section of the plant that is
utilized, the region from where the plant originated, and the time of year the
plant was harvested15. Due to its ability to stop normal microbes such as staphylococcus
epidermidis, pseudomonas aeroginosa, and some yeast like candida albican from
oxidizing fatty acid cellular protein and lipoprotein, rosemary extract and
essential oil have been used in numerous trials for more than 20 years in food
and cosmetic products. The kind of
solvent utilized for extracting this plant dictates the quantity and quality of
phytochemicals that will be extracted; in other words, the solvent’s polarity
controls what phytochemicals will be extracted.
It is preferable to assess the antioxidant activity of many extracts using a variety of assays and techniques since this will reveal various features of an extract with varying antioxidant activities.
By using free radical scavenging assays, the DPPH, ABTS+, also, FRAP, ferric reducing power, and TAA, in addition to NO radical scavenging, this work aims to determine the effect of the type of solvent used to extract rosemary complex matrices on the antioxidant activities by using many techniques.
Materials and techniques
Plant extraction
In May 2023, fresh rosemary leaves were gathered from several plants from the Mutah University campus in Al-Karak, south Jordan. The used portions were taken out, dried in the shade for ten days, and ground, (Moulinex Miller, France). A total of 100 milliliters of various solvents were used to extract 20 grams of powdered powder. The mixtures were combined for sixteen hours at room temperature on a rotating shaking device, spinning at 150 rpm. After that, they were placed in an ultrasonic bath set at 37 °C for fifteen minutes. After passing through What Man number 4, the mixes were passed via a syringe microfilter (0.45 μm). Applying the Büchi, RE 121, rotary evaporator, for removing solvents under decreased pressure at 38 ºC, 120 rpm, crude extracts were produced. After the solvent evaporated, the dry solid residue, which will be utilized for further analysis was kept at 4 °C until.
Essential oil extraction
The experimental configuration for steam distillation of volatile oils of rosemary leaves Well-maintained fresh leaves were properly cleaned and allowed to air dry at room temperature16. The leaves were weighed after being cut into tiny pieces. Using Clevenger-type equipment, a 150 g sample was steam-distilled for a minimum of six hours in total at atmospheric pressure (101.325 kPa). Dichloromethane was used to extract the distillate, or aqueous phase. Using a rotary evaporator, the organic phase was dried over anhydrous sodium sulfate, filtered, and the solvent was separated from the oil. Before being employed, obtained essential oils were kept at 4 °C.
Phytochemical content determination:
Determination of total phenolic compounds (TPC)
The reagent of the Folin and Ciocalteu (FC) colorimetric technique from17 was used to calculate TPCs. Using a vortex, an aliquot (125 microliters) of the sample or the standard utilized was the gallic acid solution was thoroughly mixed with 0.5 milliliters of deionized water and 125 microliters of FC reagent. After six minutes of reaction, 1.25 mL of a 7% Na2CO3 solution had been added and thoroughly mixed. Deionized water was added to the final amount until it reached 3.0 mL. Using a HITACHI U-5100 UV-VIS spectrophotometer. After a 90-minute incubation time at the ambient temperature without light, the absorbance of the solution was measured at 760 nm. Gallic acid equivalents (GAE) in milligrams per gram of rosemary extract were used to express the results. Every determination was made three times.
Total Flavonoid Content Determination
Zhishen et al. (1999)18 reported that the total flavonoid quantity in RE was ascertained by mixing 0.5 ml of each RE solution made in 3.3.1 with 0.3 milliliters of 5 grams per liter sodium nitrite (Labchem, USA). After five minutes, one gram of chloride of aluminum (Labchem, USA) per liter, or 0.3 ml, was added. Two ml of 1M sodium hydroxide solution were added to the liquid after the six-minute mark. With distilled water, the entire volume was increased to 10 ml, and right away after preparation, the mixture was sonicated. HITACHI U-5100 UV-VIS spectrophotometer was used to measure the absorbance at 510 nm against a water blank. To create the calibration curve, rutin solution (0-200 μg/ml) was obtained from Sigma-Aldrich, USA. The concentrations were given in mg of rutin equivalent/g of dry extract.
Total Tannin Content Determination
Total tannin content was measured using the Folin and Ciocalteu method19, in which 0.5 ml of the Folin phenol reagent, 7.5 ml of distilled water, 1 ml of 35% (w/v) sodium carbonate solution, and 0.1 ml of each RE solution prepared in 3.3.1 were added. The mixture was then diluted to 10 ml with distilled water. After giving the mixture a thorough shake and letting it sit at the ambient temperature for half an hour, at 725 nm, the absorbance was measured using a HITACHI U-5100 UV-VIS spectrophotometer. Blank was prepared using water instead of the sample. The previously explained procedure was used to process several standard solutions of gallic acid, and its results were compared to a blank. The values of the tannins were expressed in milligrams of Gallic acid equivalent per gram of dry extract.
Determination of rosemary essential oil chemical content
The chemical content of essential oil of rosemary leaves was investigated using Gas Chromatography–Mass spectrometry (GCMS)16. This was performed using an instrument of Shimadzu qp2010 Plus, a DB5-SMS column (30m X 0.25 mm x 0.25 cm), and helium (He) as a mobile phase. The maximum temperature was programmed to reach 290°C within 15 min while the initial temperature was held at 50C for 5 min and it was operated to increase at a rate of 4°C per minute. Both the injector and transfer-line temperatures were set at 250°C. Electron ionization was the mode used in the MS with a 70-electron volt (eV) electron energy and a 250°C ion source temperature. The characterization of the eluted peaks was confirmed based on the retention time and the linear index of standard alkane compounds (C8-C20). Also, the MS spectra of the possible identified compounds were compared with their analogs in the NIST library and published data. Indeed, co-chromatography was performed for certain compounds under similar circumstances.
Determination of Antioxidant Activity of Rosemary Leaf Extract
DPPH radical scavenging activity
Using 1,1-diphenyl-2-picryl-hydrazyl (DPPH) (Sigma-Aldrich, USA), Al Tarawneh (2022) methodology20 was utilized to evaluate the DPPH scavenging actions of RE. 1.9 ml of 0.1 mM DPPH methanol solution was combined with 0.1 ml of different concentrations of RE. After giving the mixture a good shake and letting it at room temperature for thirty minutes, then at 517 nm, by utilizing the HITACHI U-5100 UV-VIS spectrophotometer, to get the absorbance against a blank. Positive controls included Gallic acid from Sigma-Aldrich in the USA. The following formula was utilized to compute the degree of DPPH radical scavenging activity:
ABTS radical scavenging activity
Re and
colleagues (1999)21 reported that 7 mM of ABTS was produced in water. (ABTS•) was produced
by reacting an ABTS solution with a potassium persulfate solution that had a
final concentration of 2.45 mM. The mixture was then let to stand at room
temperature in the dark for 16 hours before use. Following the addition of twenty
microliters of rosemary samples, and trolox (standard) at varying
concentrations, solvent (control), and two milliliters of dilute ABTS• solution
(Abs at 734 nm = 0.700 ± 0.020).
The absorbance measurement was obtained precisely half an hour later. At least
three attempts were made at each determination. the percentage that inhibits
absorbance at 734 nm was computed.
FRAP Assay
With a few modest modifications, the FRAP activity was calculated by Benzie and Strain22. The plant extract was mixed in a ratio of 1:10:1 (v/v/v) with ten mmol per liter TPTZ solution in Forty mmol/L HCl, three hundred mmol per litter acetate buffer solutions (pH 3.6), and 20 mmol/L solution of FeCl3 to create three milliliters of the FRAP reagent. Utilizing a HITACHI U-5100 UV-VIS spectrophotometer, After the reaction was allowed to continue for ten minutes at room temperature, the absorbance was determined at 593 nm.
Fe3+/Fe2+ reducing power assay
Pulido’s method23 was applied with a few minor adjustments to evaluate the ferric reduction capability of rosemary extracts. Ten milligrams per milliliter of Potassium ferricyanide and 0.2 M, pH 6.6 of phosphate buffer were combined with two milliliters (ml) of rosemary extracts. Following a 20-minute incubation period at 50°C, 2 milliliters of trichloroacetic acid (C2HCl3O2) (100 mg/l) had been added to the mixture. The mixture was then centrifuged for 10 minutes at 3000 rpm, and the top layer was carefully removed. Precisely two milliliters of each of the solution mixes previously disclosed were combined with two milliliters of distilled water and 0.4 milliliters of fresh ferric chloride at a concentration of 0.1% (w/v). Following a 10-minute reaction incubation period at room temperature as well, the absorbance at 700 nm was determined by a HITACHI U-5100 UV-VIS spectrophotometer. As a control, ascorbic acid was employed. A stronger reducing effectiveness of the reaction’s solution is shown by higher absorbance readings.
Phosphomolybdate Antioxidant assay
Using the phosphomolybdenum technique, the overall antioxidant capacity of rosemary extracts was determined as well24. A volume of one milliliter of the reagent solution (0.6 M sulphuric acid, 28 millimolar sodium phosphate as well as 4 millimolar ammonium molybdate) was mixed with about 0.1 ml of each of the plant extract samples. The mixture was placed in tubes, coated with silver foil, and incubated for ninety minutes at ninety-five Celsius degrees in a water bath. After that, the mixture was permitted to cool to room temperature. At 765 nm, the absorbance of the solutions was measured concerning a blank. using gallic acid as standard. Increased absorbance values suggested that the plant extracts had a greater potential for total antioxidants.
Nitric oxide (NO) radicals scavenging Assay
NO radical-scavenging activity assay The process was carried out using Parul’s (2013) methodology 25. Different amounts of dissolved rosemary extract in water were combined with ten millimolars of sodium nitroprusside in phosphate-buffered saline, and the mixture was incubated for 150 minutes at ambient temperature. Following the incubation period, the mixture was treated with 0.5 ml of Griess reagent, which included one percent of sulfanilamide, two percent of Phosphoric Acid, and 0.1 percent of N-(1-naphthyl) ethylenediamine dihydrochloride. At 546 nm, the absorbance chromophores were measured. As a positive and negative control, rutin and the identical reaction combination excluding rosemary extracts were used.
Antibacterial activity
Bacteria
A total of two gram-positive bacteria and seven gram-negative bacteria have been used in this test. Among these two standard bacteria are Escherichia coli (ATCC 25922) and Pseudomonas aeruginosa (ATCC 10145). The other species were clinically isolated and identified based on the morphological and biochemical standard method. These bacteria are Escherichia coli, Pseudomonas aeruginosa, Klebsiella pneumonia, Enterobacter aerogenes, Proteus mirabilis as gram negative bacteria, and Staphylococcus aureus, and Staphylococcus epidermidis as gram positive bacteria.The identification was confirmed to species level using the Biomérieux VITEK® 2 system.
Disc diffusion method
Using the disc diffusion technique, rosemary extracts’ antibacterial efficacy has been assessed16. Briefly, a Muller-Hinton agar plate was inoculated with 100 µL of 24h old bacterial culture (containing 1X10⁸ CFU/mL). Using the spreading culture technique, the bacteria were spread over the surface of the agar using a glass spreader. Then, a disc containing 10 mg of the extracts was transferred to the inoculated agar. The prepared plates were incubated for 24h at 37°C. Then, the millimeters of the formed inhibitory zones were measured.
Minimum Inhibitory Concentration (MIC)
The assay was determined using a 96-well plate16. The extracts were prepared in two-fold dilution using Muller-Hinton broth to produce concentrations of 5, 2.5, 1.25, 0.6, 0.3, 0.15, 0.08, 0.04, 0.02, and 0.01 mg/mL. Test wells containing broth media without extract were also prepared as a positive control. Then, 10 µL of 24 h-old bacterial culture (containing 1X10⁸ CFU/mL) was added to each test well. The prepared plates were incubated for 24h at 37°C. The minimum inhibitory concentration (MIC) of the extracts that stopped the bacteria’s observable growth was recorded.
Statistical analysis
For every test, the results from at least three replications were presented as means ± standard deviation (SD). Microsoft Excel 2016 was utilized for statistical analysis to calculate the R2 values to connect TPC, TFC, and TTC with different antioxidant activity methods and between antioxidant activity methods themselves.
Results and discussion
Phytochemical content
Phenolic compounds’ chemical structure and redox characteristics, which enable them to function as hydrogen donors and reducing agents for transitional metals, scavenging free radicals, and inhibiting lipoxygenase, are the primary mechanisms behind their antioxidant action. Total polyphenols in the samples were measured using the FC reagent26,27. The Folin-Ciocalteu reagent was included in this investigation to assess the quantity of phenolic substances. Gallic acid was used in the construction of the standard curve. The ethanol extraction displayed the highest total phenolic content value (72.34 ±4.9 GAE mg/g), followed by slightly less antioxidant activity, methanol (64.44 ±6.6 GAE mg/g), acetone (57.74 ±7.9 GAE mg/g), ethyl acetate (52.04 ±3.8 GAE mg/g), aqueous (48.94 ±5.5GAE mg/g), diethyl ether (37.34 ±6.9 GAE mg/g). Subsequently, Overall, the essential oil extraction had the lowest antioxidant activity (9.9±0.06 GAE mg/g). According to Table 1, they had the lowest total phenolic contents.
the capacity of flavonoids to eliminate and prevent the production of free radicals accounts for their antioxidant action. Numerous research has examined flavonoids’ ability to function as antioxidants in vitro in recent years, and significant structure-activity connections of their antioxidant properties have been identified28. Flavonoids have a broad range of actions, such as chelating metal, reducing the enzymes linked to the production of free radicals, and boosting the body’s antioxidant enzymes. The ethanol extraction displayed the highest flavonoid content value (26.81 ± 0.58 TE mg/g), followed by methanol (25.45 ±0.27 TE mg/g), aqueous (25.37 ±0.1 TE mg/g), ethyl acetate (24.39 ±0.59 TE mg/g), acetone (24.14 ±0.21 TE mg/g). and then diethyl ether (19.2 ±0.4 TE mg/g), On the other hand, the overall antioxidant activity (3.40 ±0.04 TE mg/g) of the essential oil extraction was the lowest. as indicated in Table 1 had the lowest flavonoid content.
Tannins are complex substances that typically appear as mixtures of polyphenols that may be extremely hard to separate due to they seldom crystallize. Antioxidant properties are because of the accumulation of the OH group on small-size nuclei, these agents have an antioxidant nature29. The methanol extraction displayed the highest tannins content value (20.25 ±2.35 GAE mg/g), followed by slightly less antioxidant activity, ethanol (19.55 ±0.05 GAE mg/g), acetone (17.45 ±0.15 GAE mg/g), aqueous (17.3 ±1.3 GAE mg/g), ethyl acetate (14.45 ±0.45GAE mg/g), and, diethyl ether (12.65 ±0.75 GAE mg/g). Also, the essential oil extraction had the lowest total tannin content (7.5 ± 0.5 GAE mg/g) in Table 1.
The phytochemical content of rosemaryessential oil has been analyzed using GCMS (Table 2). A total of 22 compounds were identified, representing 98.9% of the total oil. Interestingly, 90.7% of the compounds were identified as oxygenated monoterpenes. Also, the outcomes demonstrated that rosemary oil has a high level of verbenone (31.8%), camphor (21.7%), and 1,8-cineole (14.6%). Other components such as α-terpineol (5.2%), linalool (4.6%), geraniol (3.4%), bornyl acetate (3.4%), pinocamphone isomer (3.1%), and carvacrol (3.1%) were identified at lower concentrations.
Antioxidant activity:
DPPH radical scavenging activity
In the model system, the radical DPPH is frequently utilized to assess antioxidant activity quickly. The capacity of the phytochemicals to give hydrogen, that scavenges the DPPH radical, provides the basis for DPPH scavenging action. When a DPPH solution is combined with an element that may supply an electron or a hydrogen atom to DPPH, neutralizing its free radical properties, the resulting reduced form of DPPH (non-radical) loses its violet hue. As the fraction of free radical inhibition rises, so does the radical scavenging activity30. The stable radical DPPH’s absorbance decreased and its hue changed from purple to yellow at varying doses. According to the research findings, the extraction of methanol exhibited the greatest DPPH scavenging activity (81.75±0.23) % at a Gallic acid equivalent concentration equal to (138.3±12.7 mg/g GAE), while the lowest scavenging value was essential oil extraction (14.13±0.03) % at (28.9±2.26 mg/g GAE), as presented in figure 1. For other extractions, the scavenging activity was as follows diethyl ether (100.3±8.57 mg/g GAE), ethanol (106.64±6.44 mg/g GAE), acetone (92±6.42 mg/g GAE), and finally, ethyl acetate (78.14±7.24 mg/g GAE). The highest correlation was with total tannin content as phytochemical content, where (R2 = 0.923). also, the correlation with FRAP is the highest (R2 = 0.8672), in contrast to alternative techniques for measuring antioxidant activity, as indicated in Table 2.
ABTS radical scavenging activity
The reaction that occurs involving a natural antioxidant and the pre-generated ABTS•+ radicals cation forms the foundation of the ABTS test. A simple quantitative method for detecting ABTS•+ scavenging is the bleaching of typical peaks in the absorption spectrum. A day in advance, ABTS•+ is often prepared by combining potassium persulfate and ABTS and letting them stand for 12 to 16 hours. This allows the potassium persulfate to oxidize ABTS stoichiometrically, forming ABTS•+, which is easily distinguished by a color shift from almost colorless to a deep bluish-green. The extractions’ antioxidant activity matched those of Trolox, the industry-standard antioxidant. When compared to trolox, the polar extraction in our investigation exhibited the strongest antioxidant activity, while the non-polar extraction had the lowest scavenging activity. The results shown in Figure 2, were the aqueous extraction (125.33± TE mg/g) followed by acetone (119.33± TE mg/g), methanol (108.75± TE mg/g), ethanol (98.51± TE mg/g), ethyl acetate (93.25± TE mg/g), and diethyl ether (76.37± TE mg/g), the lowest scavenging activity was for essential oil (32.67± TE mg/g). table 2 shows that the highest correlation was with total flavonoid content as phytochemical content, where (R2 = 0.8345). also, the correlation with FTRP is the highest (R2 = 0.8856), in contrast to alternative techniques for measuring antioxidant activity, as indicated in Table 2. According to Hou (2016)31, flavonoids possessing certain structural and hydroxyl positions within their molecules can donate protons and exhibit radical scavenging properties.
Ferric reducing antioxidant power assay (FRAP)
The FRAP test is a good, quick, and low-cost method that calculates a sample’s total antioxidant levels by considering its oxidation-reduction potential. The FRAP technique gauges a plasma’s capacity to reduce ferric iron. It reacts to the ferric tripyridyltriazine complex by using the antioxidants’ reducing potential to create the intensely blue ferrous tripyridyltriazine complex32. If an antioxidant, or reductant, is present, the reaction circumstances will favor the complex’s reduction and the subsequent production of color. Among all the rosemary extractions, the ethanol extraction showed the highest FRAP value (130.5±6.93 AScE mg/g), while, further extractions in decreasing pattern (figure 3), i.e. aqueous extraction (127.56±8.9 AScE mg/g), methanol (126.3±11.21 AScE mg/g), acetone (116.25±8.68 AScE mg/g), ethyl acetate (112.63 ±6.29 AScE mg/g) and diethyl ether extraction(95.97±7.91 AScE mg/g) In our study, the ethanol extraction demonstrated the maximum ferric reduction capacity as determined by further antioxidant tests, while the essential oil exhibit the lowest ferric reducing potential as (35.21±4.51 AScE mg/g) (Table 3). In general, the highest correlation values were for FRAP with total phenolic content (R2 = 0.8814), and total flavonoid content (R2 = 0.9878), when correlated with phytochemical contents, while correlated with other antioxidant assays, also, table 2 shows that the highest correlation was with FTRP is the highest (R2 = 0.8985), in contrast to alternative techniques for antioxidant activity assays. Typically, Chemicals that have the ability to reduce are often associated with the transfer of a hydrogen atom, which breaks the chain of free radicals33. The FRAP test of rosemary extract was determined to be 1186.54 μm Fe (II) /g by Teruel (2015)34.
Ferric Reducing Power Assay (FRPA)
Based on the idea that substances with reduction potential combine with potassium ferricyanide (Fe3+) to make potassium ferrocyanide (Fe2+), which then interacts with ferric chloride to generate the ferric-ferrous complex, which has an absorption maximum at 700 nm, the test procedure is carried out35. Among all the rosemary extractions, the aqueous extraction (144.5±9.81 GAE mg/g) showed the highest reducing power value and other extractions in the decreasing order, figure 4, i.e., ethanol extraction (129.1±11.45 GAE mg/g), methanol (114.3±12.36 GAE mg/g), ethyl acetate extraction (92.26 ±6.49 GAE mg/g), acetone (111.57±8.68 GAE mg/g), and diethyl ether (78.43±9.91 GAE mg/g). According to results obtained in this study, antioxidant tests, the aqueous extraction in this study had the maximum ferric reducing potential, whereas the essential oil had the lowest ferric reducing potential (29.21±1.27 GAE mg/g). Table 2 shows that the highest correlation was with total flavonoid content as phytochemical content, where (R2 = 0.8383). also, the correlation with FRAP is the highest (R2 = 0.8985), in comparison with other methods for antioxidant activity assaying.
Total antioxidant activity
All extractions’ combined antioxidant activity was assessed spectrophotometrically using the phosphomolybdenum technique. The total antioxidant activity was determined using the phosphomolybdenum approach, which is based on the sample analyte’s reduction of Mo (VI) to Mo (V) and its resulting creation of green phosphate Mo (V) complex under acidic pH. This test involves electron transfer, which is dependent on the antioxidant’s structure36. In our investigation, when compared to Gallic acid, the polar extraction exhibited the strongest antioxidant activity, and the non-polar extraction was the lowest when it came to reducing Mo (VI) to Mo (V). The reference standard antioxidant, Gallic acid, was used to compare the antioxidant activity of the extractions. Figure 5 shows the highest total antioxidant activity value of 178.86 ±10.51 GAE mg/g, the ethanol extraction showed the greatest value, followed by the slightly fewer antioxidant methanol (163.25 ±8.72GAE mg/g), acetone (158.9±3.5 GAE mg/g), aqueous (157.8±7.52 GAE mg/g) ethyl acetate (156.7±10.51 GAE mg/g), and then Essential oil (94.65±8.55 GAE mg/g). while the diethyl ether extraction had the lowest total antioxidant activity (74.41±9.98 GAE mg/g) This shows that the more polar extraction has higher polar component content and higher antioxidant activity than diethyl ether and essential oils. In general, the lowest correlation values were for TAA with all phytochemical contents, and when correlated with other antioxidant assays, table 2 shows that the highest correlation was with total flavonoid content as phytochemical content, where (R2 = 0.6812). also, the correlation with FTRP is the highest (R2 = 0.5966), in comparison with other methods for antioxidant activity assay. These results were consistent with the study32, which indicated that the higher the solubility, the higher the activity.
Assay for scavenging radicals of nitric oxide (NO)
The Ebrahimzadeh37 methodology was utilized to ascertain the plant extracts’ capacity to scavenge nitric oxide radicals. The Greiss reaction was used to detect the nitrite ions that are produced when oxygen combines with NO produced by sodium nitroprusside, or Extracts act as a scavenger of nitric oxide competed with oxygen, they lessen the quantity of nitrite that is produced when sodium nitroprusside is combined with oxygen and nitric oxide. The antioxidant capacity of the extractions was equivalent to that of the standard antioxidant, rutin. The Ebrahimzadeh37 methodology was utilized to ascertain the plant extracts’ capacity to scavenge nitric oxide radicals. Sodium nitroprusside was used to produce nitric oxide, which was then quantified using the Greiss reaction. The plant extracts inhibit nitric oxide synthase induction. They lessen the quantity of nitrite that is produced when sodium nitroprusside is combined with oxygen and nitric oxide. The methanol extraction displayed the highest total antioxidant activity value (86.08 ±6.4 RE mg/g), followed by slightly less antioxidant activity, ethanol (85.17 ±4.79 RE mg/g), aqueous (83.08 ± 6.41 RE mg/g), ethyl acetate (81.1 ±4.63 RE mg/g), essential oil (80.85 ±3.66 RE mg/g). and then acetone (78.59±5.38 RE mg/g), while the diethyl ether extraction had the lowest total antioxidant activity (62.24±3.31 RE mg/g) as shown in Figure 6. Table 2 shows that the highest correlation was with total tannin content as phytochemical content, where (R2 = 0.8846). also, the correlation with FRAP is the highest (R2 = 0.8841), in comparison with other methods for antioxidant activity assaying.
Antibacterial activity
The antibacterial activity of ethanol, methanol, acetone, ethyl acetate, water, and the essential oil extracted fromrosemary extract has been determined based on the inhibition zones and MIC values. The results of inhibition zones (table 3) showed that all extracts exhibited antibacterial activity but to a variable degree. The inhibition zones observed for the methanol extract were higher than the inhibition zones of other extracts. The exception to this is the inhibition zones of ethanol and acetone extracts against P. mirabilis and S. aureus. The maximum inhibition zone observed was 21.8 mm for the methanol extract against E. coli, suggesting that the methanol extract possesses the maximum antibacterial activity. Ranked second is the ethanol extract, followed by acetone, water, ethyl acetate, and finally essential oil. However, the extracts demonstrated broad-spectrum antibacterial action against bacteria of both the gram-positive and gram-negative varieties. The most sensitive strains were E. coli, K. pneumoniae, E. coli ATCC 25922, and E. aerogenes, as indicated by the largest inhibition zones observed.
Quantity analysis to determine the antibacterial activity of the extracts has been determined using MIC. In general, the results of the inhibition zones were reflected in the values of MIC (Table 4). The extracts that exhibited the largest inhibition zones were those that exhibited the lowest MIC values. The lowest MIC value reported was 0.08 mg/mL for the methanol extract against E. coli. The MIC values of the methanol, ethanol, and acetone extracts at low concentrations ranging from 0.08 to 0.3 mg/mL indicate the effectiveness of these polar extracts as antibacterial agents.
In general, this study investigated how the antioxidant capacity was affected by the solvent used to extract the plant. We talked about many phytochemicals content like TPC, TFC, TTC, and several antioxidant activity assessment techniques for rosemary extracts. The antioxidant action of the plant may originate from the secondary metabolite present in the extract. Organic compounds known as secondary metabolites are mostly generated by plants and fungi. These are low-molecular-weight substances with a range of biological activities, including antioxidant and antibacterial qualities38,39. The plant extract’s phytochemical screening result showed the existence of many secondary metabolites, which are what define the antioxidant action. In comparison to other solvent extracts, the ethanol extract of rosemary demonstrated superiority as a solvent for the extraction of several secondary metabolites. This examination, which also confirmed the results of the previous study39, revealed abundant amounts of phenols as well as flavonoids, alkaloids, terpenoids, glycosides, and several other extra metabolites in rosemary extract. Comparably, the ethanol extract of rosemary demonstrated favorable results for tannin, glycoside, flavonoids, and phenol. It has been demonstrated that secondary metabolites, in particular phenolic and flavonoids, have strong radical scavenging action, the secondary metabolite’s bioactivity potential may be the cause of the plant extract’s antioxidant activity40,41. Rosemaryessential oil occurs in five different chemotypes: verbenone, myrcene, 1,8-cineole, α-pinene/1,8-cineole, and α-pinene/β-pinene chemotypes42. In this study, verbenone was the most dominant component, suggesting that this species is a verbenone chemotype. Hudaib (2015)43, showed that the essential oil of rosemarycollected from Amman, Jordan, is a 1,8-cineole chemotype. It is worth mentioning that the presence and concentrations of these components are variable based on the plant growth conditions, such as the weather and the geographical area44–46. Antioxidant action is exhibited by flavonoids, phenolic substances found in medicinal plants41. Alkaloids, flavonoids, and terpenes are examples of phytochemicals that are important for their antibacterial, analgesic, neuroprotective, and antioxidant properties39,40.They also function as antidiabetic and anticancer agents47. Since flavonoids, phenols, terpenoids, tannins, and saponins are some of the primary phytochemicals present in plant extracts, the results of the phytochemical screening procedure may generally provide prospective therapeutic applications40. Numerous parameters, such as the amount of sample, conditions of storage, weather, extraction process, availability of any interfering chemicals, and solvent, might affect the effective screening of compounds that are phenolic or flavonoid39,41. However, it hasn’t been demonstrated that any one solvent or combination of solvents may successfully extract phenolic chemicals from various solvent extracts. The hydroxyl groups in phenols are remarkably effective in scavenging free radicals. Conversely, flavonoids are physiologically significant substances that exhibit a wide range of biological properties, including anti-inflammatory, anti-cancer, anti-allergic, anti-angiogenic, and antioxidant properties40. Moreover, a maturation period, geographic location, extraction technique, or extraction solvent may all contribute to variations in the distinguished extract48. The primary mechanisms behind the antioxidant effect of phenolic compounds are their redox properties, which can help trap and eliminate free radicals, quench singlet and triplet oxygen, and dissolve peroxides40. In addition, there may be differences in the plant’s geographical distribution, the extraction technique, the solvent employed, the time of plant seed harvesting, and other environmental variables contributing to the dispute49. Plants that are major antioxidants or scavengers of free radicals correlate with phenolic chemicals50 [50]. According to the study’s findings, the plant extracts’ higher phenolic content and/or specific kind of phenolic content may have contributed to their potent radical scavenging action. The capacity of phenolic compounds to attract metals, suppress lipoxygenase, and scavenging free radicals may be linked to their bioactivity. The extraction process and solvent type may be the cause of discrepancies between various solvents41. Flavonoids, which are present in herbs, have been shown in several studies to have a substantial role in their antioxidant properties51. The majority of oxidizing substances, including single oxygen and other free radicals, may be effectively scavenged by flavonoids40,52. A broad class of physiologically active chemicals make up the primary secondary metabolites known as phenolic compounds. Phenolic compounds have redox characteristics that make them reducing and antioxidants. Using the tests for phosphor-molybdenum, DPPH, ABTS, FRAP, ferric reducing power, and NO radical scavenging, the antioxidant activity of the plant extract was assessed. There was a substantial correlation seen between the antioxidant capacity of rosemary extracts and the positive control. The existence of several phytochemicals, including phenolic substances and flavonoids, may be the cause of this52. It was shown that the total phenolic content of various extracts strongly correlated with their antioxidant activity40. As a result, rosemary leaves might be added to meals or used as a supplement to increase caloric intake or prevent oxidation in nutritional goods. In contrast to the positive control and each other, the various extracts’ percentage inhibition was lower. The phenomena that have been seen might be explained by the lower concentration or by the specific type of flavonoids and/or phenolic ingredients, which were shown to neutralize radicals such as hydroxyl and superoxide53. Flavonoids produced from plants have anti-inflammatory, antibacterial, antidiarrheal, and antioxidant qualities39. Flavonoids and polyphenolic chemicals react with the walls of bacterial cells to produce complexes that carry out biological activities54. Furthermore, the chemical makeup and polyphenol concentration of the extract are responsible for its antioxidant potential55. The plant extract’s ability to eliminate free radicals may be attributed to its secondary metabolites, which include tannin, phenol, flavonoids, alkaloids, and others, which in turn lower the molybdenum ion fraction55,56.
Previous reports showed that R. officinalis extracts possess broad-spectrum antibacterial activity against variable bacteria, including E. coli, P. aeruginosa, P. vulgaris, K. pneumoniae, Salmonella sp., S. aureus, Bacillus subtilis, and Listeria monocytogenes57–59. In this study, the antibacterial activity was polarity-dependent, and the activity of the polar extracts was superior. The antibacterial activity of the low-polar extracts and essential oils of rosemary is due to the presence of certain active ingredients such as 1,8-cineol, α-pinene, and camphor, but also to the synergistic effect between these ingredients and others. In contrast, the potency of the bacteriostatic action of rosemary extract is linked to non-volatile extracts that can be extracted using polar solvents such as methanol and ethanol. Nonvolatile compounds such as carnosol, rosmarinic acid, carnosic acid, rosmarinones A and B, miltionone I, atriplicone B, 3-epimaslinic acid, 2α-hydroxymicromeric acid, 2α, 3α-dihydroxyurs-12-en-28-oic, and corosolic acid acid have been identified in rosemary polar extracts with antibacterial activity60–62.
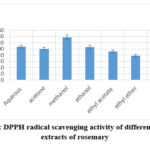 |
Figure 1: DPPH radical scavenging activity of different solvent extracts of rosemary |
 |
Figure 2: ABTS radical scavenging activity of different solvent extracts of rosemary |
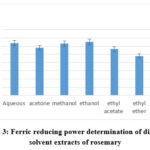 |
Figure 3: Ferric reducing power determination of different solvent extracts of rosemary |
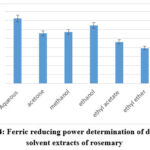 |
Figure 4: Ferric reducing power determination of different solvent extracts of rosemary |
 |
Figure 5: Total antioxidant activity of different solvent extracts of rosemary |
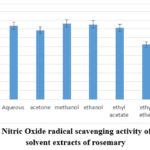 |
Figure 6: Nitric Oxide radical scavenging activity of different solvent extracts of rosemary |
Table 1: Phytochemical content in different solvent extractions, values are the mean of three replicates ± standard deviation (n=3).
|
TTC GAE mg/g |
TFC RE mg/g |
TPC GAE mg/g |
Extract |
|
17.3 ±1.3 |
25.37 ±0.1 |
48.94 ±5.5 |
Water |
|
17.45 ±0.15 |
24.14 ±0.21 |
57.74 ±7.9 |
Acetone |
|
20.25 ±2.35 |
25.45 ±0.27 |
64.41 ±6.8 |
Methanol |
|
19.55 ±0.05 |
26.81 ± 0.58 |
72.34 ±4.9 |
Ethanol |
|
14.45 ±0,45 |
24.39 ±0.59 |
52.04 ±3.8 |
Ethyl acetate |
|
12.65 ±0.75 |
19.2 ±0.4 |
37.34 ±6.9 |
Diethyl ether |
|
7.5 ± 0.5 |
3.40 ±0.04 |
9.9±0.06 |
Essential oil |
Table 2: The phytochemical content of rosemaryessential oil analysis via GC-MS
|
NO |
kical |
Kilet |
Compound |
% |
|
1. |
931 |
937 |
α-pinene |
1.7 |
|
2. |
1010 |
1027 |
γ-terpinene |
0.3 |
|
3. |
1030 |
1030 |
1,8-cineole |
14.6 |
|
4. |
1088 |
1083 |
terpinolene |
0.3 |
|
5. |
1106 |
1101 |
linalool |
4.6 |
|
6. |
1128 |
1121 |
chrysanthenone |
0.8 |
|
7. |
1147 |
1146 |
camphor |
21.7 |
|
8. |
1179 |
1176 |
pinocamphone isomer |
3.1 |
|
9. |
1199 |
1190 |
α-terpineol |
5.2 |
|
10. |
1216 |
1209 |
verbenone |
31.8 |
|
11. |
1269 |
1256 |
geraniol |
3.4 |
|
12. |
1278 |
1276 |
2,6-octadienal, 3,7-dimethyl- |
1.8 |
|
13. |
1287 |
1283 |
bornyl acetate |
3.4 |
|
14. |
1318 |
1309 |
carvacrol |
3.1 |
|
15. |
1346 |
1342 |
piperitenone |
0.6 |
|
16. |
1366 |
1362 |
chavibetol |
0.5 |
|
17. |
1418 |
1415 |
caryophyllene |
0.7 |
|
18. |
1458 |
1445 |
elemene |
0.3 |
|
19. |
1525 |
1530 |
delta Cadinene |
0.2 |
|
20. |
1586 |
1581 |
caryophyllene oxide |
0.3 |
|
21. |
1613 |
1608 |
humulene epoxide II |
0.3 |
|
22. |
1655 |
1652 |
methyl jasmonate |
0.2 |
|
|
|
|
Total |
98.9 |
|
|
|
|
Monoterpene hydrocarbons |
2.3 |
|
|
|
|
Sesquiterpene hydrocarbons |
90.7 |
|
|
|
|
Oxygenated monoterpenes |
1.2 |
|
|
|
|
Oxygenated sesquiterpenes |
0.5 |
|
|
|
|
Other |
4.2 |
Table 3. R2 (The coefficient of determination) values between the TPC, TFC, TTC, and antioxidant activity assay methods (DPPH, ABTS, FRAP, FRPA, TAA, and N.O.), and Also, between different antioxidant activity assay methods.
|
DPPH |
ABTS |
FRAP |
FRPA |
TAA |
N.O. |
TPC |
|
|
TPC |
0.8122 |
0.6579 |
0.8814 |
0.7238 |
0.6812 |
0.8682 |
1 |
|
TFC |
0.8297 |
0.8345 |
0.9878 |
0.8383 |
0.5435 |
0.8637 |
0.8781 |
|
TTC |
0.923 |
0.7673 |
0.8834 |
0.8241 |
0.6763 |
0.8846 |
0.922 |
|
DPPH |
1 |
0.7626 |
0.8672 |
0.7389 |
0.5337 |
0.8539 |
***** |
|
ABTS |
***** |
1 |
0.8603 |
0.8856 |
0.5416 |
0.7799 |
***** |
|
FRAP |
***** |
***** |
1 |
0.8985 |
0.5669 |
0.8841 |
***** |
|
FTRP |
***** |
***** |
***** |
1 |
0.5966 |
0.7238 |
***** |
|
TAA |
***** |
***** |
***** |
***** |
1 |
0.8335 |
***** |
|
N.O. |
***** |
***** |
***** |
***** |
***** |
1 |
***** |
Table 4: Inhibition zone of rosemary extracts
|
Bacteria |
Ethanol |
Methanol |
Acetone |
Ethyl acetate |
Water |
EO |
|
Escherichia coli |
19.8±1.0 |
21.8±1.3 |
17.2±0.3 |
11.8±0.8 |
10.8±0.8 |
9.8±1.0 |
|
Klebsiella pneumoniae |
17.5±0.5 |
21.5±0.5 |
16.7±0.8 |
13.3±0.3 |
12.3±0.3 |
14.8±0.8 |
|
Enterobacter aerogenes |
12.8±1.0 |
18.3±0.6 |
11.7±0.3 |
13.0±0.0 |
14.5±0.5 |
12.7±0.3 |
|
Pseudomonas aeruginosa |
12.7±1.4 |
15.8±1.0 |
8.3±0.6 |
8.5±0.5 |
8.0±0.5 |
10.3±1.2 |
|
Proteus mirabilis |
13.2±0.3 |
10.5±0.5 |
12.8±0.6 |
12.5±0.5 |
12.5±0.5 |
14.5±0.5 |
|
Staphylococcus aureus |
15.8±0.3 |
12.2± 1.0 |
15.0±0.5 |
11.3±1.3 |
11.3±1.3 |
18.2±0.3 |
|
Staphylococcus epidermidis |
14.2±0.8 |
15.7±1.5 |
11.8±1.0 |
10.5±0.9 |
11.5±0.9 |
16.2±0.3 |
|
E. coli ATCC 25922 |
16.0±0.5 |
18.3±0.3 |
15.7±1.2 |
9.5±0.9 |
10.0±1.0 |
9.7±0.6 |
|
P. aeruginosa ATCC 10145 |
13.0±1.0 |
15.7±1.5 |
10.3±0.3 |
10.0±0.0 |
10.0±0.0 |
11.2±0.3 |
Table 5: MIC values (mg/mL) of R. officinalis leaf extracts
|
Bacteria |
Ethanol |
Methanol |
Acetone |
Ethyl acetate |
Water |
EO |
|
Escherichia coli |
0.15 |
0.08 |
0.6 |
1.25 |
0.6 |
0.6 |
|
Klebsiella pneumoniae |
0.15 |
0.15 |
0.3 |
0.6 |
0.6 |
0.6 |
|
Enterobacter aerogenes |
1.25 |
0.3 |
1.25 |
0.6 |
0.6 |
1.25 |
|
Pseudomonas aeruginosa |
0.3 |
0.15 |
1.25 |
5 |
5 |
0.6 |
|
Proteus mirabilis |
1.25 |
2.5 |
2.5 |
2.5 |
2.5 |
1.25 |
|
Staphylococcus aureus |
0.3 |
0.6 |
0.3 |
1.25 |
1.25 |
0.3 |
|
Staphylococcus epidermidis |
2.5 |
2.5 |
2.5 |
5 |
˃5 |
˃5 |
|
E. coli ATCC 25922 |
0.6 |
0.3 |
0.3 |
2.5 |
2.5 |
1.25 |
|
P. aeruginosa ATCC 10145 |
0.6 |
0.6 |
0.6 |
1.25 |
0.6 |
0.6 |
Conclusion
The results of our investigation demonstrated that the kind of solvents had a significant impact on the extractability of bioactive ingredients. Overall, the intermediate polar solvent that was used (ethanol) produced the largest concentrations of phytochemicals (phenolic compounds, and flavonoids) as well as the strongest antioxidant activity. and the highest amounts of tannin were obtained with the intermediate polar solvent (methanol). The polar, as well as intermediate polar solvents, produced the strongest antioxidant activity and antibacterial activity; this may be related to the quantity, kind, and polarity of the extracted compounds—which are certainly phenolic acids. Notably, antioxidant activity (as measured by DPPH, ABTS, FRAP tests, ferric reducing power, total antioxidant activity, and nitric oxide radical scavenging) was extremely substantially linked with TPC, TFC, and TTC., this is because the majority of bioactive substances, such as flavonoids polyphenols, and tannins, occur in greater polar extractions. which makes these phytochemicals the major contributor to its antioxidant properties.
Acknowledgment
The author thanks Dr. Haitham N. Qaralleh, and Dr. Muhamad O. Al-Limoun for providing facilities to use the microbiology lab and helping with antibacterial assays.
Conflict of Interest
The author declares no conflict of interest.
Founding Source
No external funding for this study.
References
- Saini A, Pandey A, Sharma S, et al. Assessment of antioxidant activity of rosemary (Rosmarinus officinalis) leaves extract. J Pharmacogn Phytochem. 2020;9(3):14-17.
- Wang YZ, Fu SG, Wang SY, Yang DJ, Wu YHS, Chen YC. Effects of a natural antioxidant, polyphenol-rich rosemary (Rosmarinus officinalis L.) extract, on lipid stability of plant-derived omega-3 fatty-acid rich oil. LWT. 2018;89:210-216.
- Chammem N, Saoudi S, Sifaoui I, et al. Improvement of vegetable oil quality in frying conditions by adding rosemary extract. Ind Crops Prod. 2015;74:592-599.
- Guo Q, Gao S, Sun Y, Gao Y, Wang X, Zhang Z. Antioxidant efficacy of rosemary ethanol extract in palm oil during frying and accelerated storage. Ind Crops Prod. 2016;94:82-88.
- Moczkowska M, Karp S, Horbanczuk OK, Hanula M, Wyrwisz J, Kurek MA. Effect of rosemary extract addition on oxidative stability and quality of hemp seed oil. Food Bioprod Process. 2020;124:33-47.
- Yang Y, Song X, Sui X, et al. Rosemary extract can be used as a synthetic antioxidant to improve vegetable oil oxidative stability. Ind Crops Prod. 2016;80:141-147.
- Nieto G, Ros G, Castillo J. Antioxidant and antimicrobial properties of rosemary (Rosmarinus officinalis, L.): A review. Medicines. 2018;5(3):98.
- Almela L, Sánchez-Muñoz B, Fernández-López JA, Roca MJ, Rabe V. Liquid chromatograpic–mass spectrometric analysis of phenolics and free radical scavenging activity of rosemary extract from different raw material. J Chromatogr A. 2006;1120(1-2):221-229.
- Silva AM de O, Andrade-Wartha ERS de, Carvalho EBT de, Lima A de, Novoa AV, Mancini-Filho J. Effect of aqueous rosemary extract (Rosmarinus officinalis L.) on the oxidative stress of diabetic rats. Rev Nutr. 2011;24:121-130.
- Mileo AM, Miccadei S. Polyphenols as a modulator of oxidative stress in cancer disease: new therapeutic strategies. Oxid Med Cell Longev. 2016;2016.
- Rashid KI, Ibrahim KM, Hamza SJ. Effect of some biotic and abiotic elicitors on phenolic acids and diterpenes production from rosemary (Rosmarinus officinalis L.) leaf and callus analyzed by high performance liquid chromatography (HPLC). J Al-Nahrain Univ. 2011;14:104-109.
- Hussain AI, Anwar F, Chatha SAS, Jabbar A, Mahboob S, Nigam PS. Rosmarinus officinalis essential oil: antiproliferative, antioxidant and antibacterial activities. Brazilian J Microbiol. 2010;41:1070-1078.
- Yesil-Celiktas O, Sevimli C, Bedir E, Vardar-Sukan F. Inhibitory effects of rosemary extracts, carnosic acid and rosmarinic acid on the growth of various human cancer cell lines. Plant foods Hum Nutr. 2010;65:158-163.
- Lee CY, Kim KM, Son HS. Optimal extraction conditions to produce rosemary extracts with higher phenolic content and antioxidant activity. Korean J Food Sci Technol. 2013;45(4):501-507.
- Ray A, Gupta SD. A panoptic study of antioxidant potential of foliar gel at different harvesting regimens of Aloe vera L. Ind Crops Prod. 2013;51:130-137.
- Qaralleh HN, Abboud MM, Khleifat KM, Tarawneh KA, Althunibat OY. Antibacterial activity in vitro of Thymus capitatus from Jordan. Pak J Pharm Sci. 2009;22(3).
- Dewanto V, Wu X, Adom KK, Liu RH. Thermal processing enhances the nutritional value of tomatoes by increasing total antioxidant activity. J Agric Food Chem. 2002;50(10):3010-3014.
- Zhishen J, Mengcheng T, Jianming W. The determination of flavonoid contents in mulberry and their scavenging effects on superoxide radicals. Food Chem. 1999;64(4):555-559.
- Tamilselvi N, Krishnamoorthy P, Dhamotharan R, Arumugam P, Sagadevan E. Analysis of total phenols, total tannins and screening of phytocomponents in Indigofera aspalathoides (Shivanar Vembu) Vahl EX DC. J Chem Pharm Res. 2012;4(6):3259-3262.
- Altarawneh RM, Al‐Jaafreh AM, Qaralleh H, Al‐Qaralleh OS. Chemical profiling of Punica granatum peels from Jordan using LC–MS/MS and study on their biological activities. Int J Food Sci Technol. 2022;57(8):5256-5267.
- Re R, Pellegrini N, Proteggente A, Pannala A, Yang M, Rice-Evans C. Antioxidant activity applying an improved ABTS radical cation decolorization assay. Free Radic Biol Med. 1999;26(9-10):1231-1237.
- Benzie IFF, Strain JJ. The ferric reducing ability of plasma (FRAP) as a measure of “antioxidant power”: the FRAP assay. Anal Biochem. 1996;239(1):70-76.
- Pulido R, Bravo L, Saura-Calixto F. Antioxidant activity of dietary polyphenols as determined by a modified ferric reducing/antioxidant power assay. J Agric Food Chem. 2000;48(8):3396-3402.
- Baydar NG, Özkan G, Yaşar S. Evaluation of the antiradical and antioxidant potential of grape extracts. Food Control. 2007;18(9):1131-1136.
- Parul R, Kundu SK, Saha P. In vitro nitric oxide scavenging activity of methanol extracts of three Bangladeshi medicinal plants. pharma Innov. 2013;1(12, Part A):83.
- Kaviarasan S, Naik GH, Gangabhagirathi R, Anuradha C V, Priyadarsini KI. In vitro studies on antiradical and antioxidant activities of fenugreek (Trigonella foenum graecum) seeds. Food Chem. 2007;103(1):31-37.
- Pandey KB, Rizvi SI. Plant polyphenols as dietary antioxidants in human health and disease. Oxid Med Cell Longev. 2009;2:270-278.
- Liga S, Paul C, Péter F. Flavonoids: Overview of biosynthesis, biological activity, and current extraction techniques. Plants. 2023;12(14):2732.
- Guaita M, Motta S, Messina S, Casini F, Bosso A. Polyphenolic Profile and Antioxidant Activity of Green Extracts from Grape Pomace Skins and Seeds of Italian Cultivars. Foods. 2023;12(20):3880.
- Schreiner M, Beyene B, Krumbein A, Stutzel H. Ontogenetic changes of 2-propenyl and 3-indolylmethyl glucosinolates in Brassica carinata leaves as affected by water supply. J Agric Food Chem. 2009;57(16):7259-7263.
- Hou F, Su D, Xu J, et al. Enhanced extraction of phenolics and antioxidant capacity from sorghum (Sorghum bicolor L. Moench) shell using ultrasonic‐assisted ethanol–water binary solvent. J Food Process Preserv. 2016;40(6):1171-1179.
- Gülcin I. Antioxidant activity of food constituents: an overview. Arch Toxicol. 2012;86:345-391.
- Duh PD, Tu YY, Yen GC. Antioxidant activity of water extract of Harng Jyur (Chrysanthemum morifolium Ramat). LWT-Food Sci Technol. 1999;32(5):269-277.
- Teruel MR, Garrido MD, Espinosa MC, Linares MB. Effect of different format-solvent rosemary extracts (Rosmarinus officinalis) on frozen chicken nuggets quality. Food Chem. 2015;172:40-46.
- Kedir WM, Geletu AK, Weldegirum GS, Sima MF. Antioxidant activity of selected plants extract for palm oil stability via accelerated and deep frying study. Heliyon. 2023;9(7).
- Kammoun M, Miladi S, Ali Y Ben, Damak M, Gargouri Y, Bezzine S. In vitro study of the PLA2 inhibition and antioxidant activities of Aloe vera leaf skin extracts. Lipids Health Dis. 2011;10:1-7.
- Ebrahimzadeh MA, Pourmorad F, Hafezi S. Antioxidant activities of Iranian corn silk. Turkish J Biol. 2008;32(1):43-49.
- Karadağ AE, Demirci B, Çaşkurlu A, et al. In vitro antibacterial, antioxidant, anti-inflammatory and analgesic evaluation of Rosmarinus officinalis L. flower extract fractions. South African J Bot. 2019;125:214-220.
- Ibrahim N, Abbas H, El-Sayed NS, Gad HA. Rosmarinus officinalis L. hexane extract: phytochemical analysis, nanoencapsulation, and in silico, in vitro, and in vivo anti-photoaging potential evaluation. Sci Rep. 2022;12(1):13102.
- Chatoui K, Harhar H, El Kamli T, Tabyaoui M. Chemical composition and antioxidant capacity of Lepidium sativum seeds from four regions of Morocco. Evidence-based Complement Altern Med. 2020;2020.
- Tarchoune I, Sgherri C, Eddouzi J, Zinnai A, Quartacci MF, Zarrouk M. Olive leaf addition increases olive oil nutraceutical properties. Molecules. 2019;24(3):545.
- Satyal P, Jones TH, Lopez EM, et al. Chemotypic characterization and biological activity of Rosmarinus officinalis. Foods. 2017;6(3):20.
- Hudaib MM, Tawaha KA, Hudaib HS, Battah AH. Chemical composition of volatile oil from the aerial parts of Rosmarinus officinalis L. grown in Jordan. J Essent Oil Bear Plants. 2015;18(5):1282-1286.
- Mena P, Cirlini M, Tassotti M, Herrlinger KA, Dall’Asta C, Del Rio D. Phytochemical profiling of flavonoids, phenolic acids, terpenoids, and volatile fraction of a rosemary (Rosmarinus officinalis L.) extract. Molecules. 2016;21(11):1576.
- Celiktas OY, Kocabas EEH, Bedir E, Sukan FV, Ozek T, Baser KHC. Antimicrobial activities of methanol extracts and essential oils of Rosmarinus officinalis, depending on location and seasonal variations. Food Chem. 2007;100(2):553-559.
- Pintore G, Usai M, Bradesi P, et al. Chemical composition and antimicrobial activity of Rosmarinus officinalis L. oils from Sardinia and Corsica. flavour Fragr J. 2002;17(1):15-19.
- Mwamatope B, Chikowe I, Tembo DT, Kamanula JF, Masumbu FFF, Kumwenda FD. Phytochemical composition and antioxidant activity of edible wild fruits from Malawi. Biomed Res Int. 2023;2023.
- Karazhiyan H, Razavi SMA, Phillips GO, et al. Rheological properties of Lepidium sativum seed extract as a function of concentration, temperature and time. Food Hydrocoll. 2009;23(8):2062-2068.
- Meka Kedir W, Dukassa Dubiwak A, Tofik Ahmed E. Nephroprotective effect of asparagus africanus lam. root extract against gentamicin-induced nephrotoxicity in swiss albino mice. J Toxicol. 2022;2022.
- Saeed N, Khan MR, Shabbir M. Antioxidant activity, total phenolic and total flavonoid contents of whole plant extracts Torilis leptophylla L. BMC Complement Altern Med. 2012;12:1-12.
- Bitis L, Sen A, Ozsoy N, Birteksoz-Tan S, Kultur S, Melikoglu G. Flavonoids and biological activities of various extracts from Rosa sempervirens leaves. Biotechnol Biotechnol Equip. 2017;31(2):299-303.
- Rao USM, Abdurrazak M, Mohd KS. Penyaringan fitokimia, jumlah asai kandungan flavonoid dan fenolik pelbagai ekstrak pelarut tepal Musa paradisiaca. Malaysian J Anal Sci. 2016;20(5):1181-1190.
- Gangwar M, Gautam MK, Sharma AK, Tripathi YB, Goel RK, Nath G. Antioxidant capacity and radical scavenging effect of polyphenol rich Mallotus philippenensis fruit extract on human erythrocytes: an in vitro study. Sci World J. 2014;2014.
- Mo Y nan, Cheng F, Yang Z, et al. Antioxidant activity and the potential mechanism of the fruit from Ailanthus altissima swingle. Front Vet Sci. 2021;8:784898.
- Rahman MM, Islam MB, Biswas M, Khurshid Alam AHM. In vitro antioxidant and free radical scavenging activity of different parts of Tabebuia pallida growing in Bangladesh. BMC Res Notes. 2015;8(1):1-9.
- Malar J, Chairman K, Singh ARJ, Vanmathi JS, Balasubramanian A, Vasanthi K. Antioxidative activity of different parts of the plant Lepidium sativum Linn. Biotechnol Reports. 2014;3:95-98.
- Boughendjioua H, Boughendjioua Z. Investigation of antibacterial and antioxidant activities of rosemary essential oil from Algeria. Res J Pharm Biol Chem Sci. 2017;8(3):1425-1434.
- Santomauro F, Sacco C, Donato R, Bellumori M, Innocenti M, Mulinacci N. The antimicrobial effects of three phenolic extracts from Rosmarinus officinalis L., Vitis vinifera L. and Polygonum cuspidatum L. on food pathogens. Nat Prod Res. 2018;32(22):2639-2645.
- Moreno S, Scheyer T, Romano CS, Vojnov AA. Antioxidant and antimicrobial activities of rosemary extracts linked to their polyphenol composition. Free Radic Res. 2006;40(2):223-231.
- Zhong X, Wang X, Zhou N, et al. Chemical characterization of the polar antibacterial fraction of the ethanol extract from Rosmarinus officinalis. Food Chem. 2021;344:128674.
- Mushtaq W, Naim A, Naeem S. In vitro anti-bacterial activity of rosmarinus officinalis L. and murraya koenigii L. against multi-drug resistant staphylococcus species. Int J Biol Biotechnol. 2019;16(4):1005-1010.
- Bernardes WA, Lucarini R, Tozatti MG, et al. Antimicrobial activity of Rosmarinus officinalis against oral pathogens: relevance of carnosic acid and carnosol. Chem Biodivers. 2010;7(7):1835-1840.

