
Manuscript accepted on :28-02-2024
Published online on: 14-03-2024
Plagiarism Check: Yes
Reviewed by: Dr. Pravinkumar Darji
Second Review by: Dr. Neeta Rai
Final Approval by: Dr. Anton R Kiselev
Amr Farhan1,3* , Azeddine Mouhsen1, Badreddine Labakoum1 , Mourad Rattal1,2 and Aissam Lyazidi1,2
1Hassan First University of Settat, Radiation-Matter Instrumentation Laboratory (RMI), Settat, Morocco.
2Hassan First University of Settat, Higher Institute of Health Sciences (ISSS), Laboratory of Health Sciences and Technologies, Settat, Morocco.
3Authority of Al-Thawra Hospital Taiz, Yemen
Corresponding Author E-mail: amrfarhan70@gmail.com
DOI : https://dx.doi.org/10.13005/bpj/2873
Abstract
The measure of cardiac variability (HRV) is considered an accurate diagnostic method to identify autonomic dysfunction. The heart rate influences the pulse. Therefore, pulse rate variability (PRV), like HRV, precisely indicates autonomic nervous system tone. The research investigates the correlation between HRV for the ECG signal and PRV in a cardiac patient. Method and Materials: 53 electrocardiogram (ECG) and photoplethysmogram (PPG) signals for 8 minutes from the PhysioNet BIDMC PPG and Respiration Dataset were used. Afterward, the PRV from PPG and the R-R interval calculated independently using Acqknowledge software were used to estimate the ECG and get HRV characteristics. Results: According to the results, there was a strong correlation between the R-R interval for PRV (694.49 ± 112.98ms) and HRV (695.60 ± 112.97ms) (r=0.99). For all linear parameters for both domains, frequency and time of HRV and PRV, there was a significant positive correlation: HFnu (r =0.99), HF Power (r =1), LFnu (r = 0.99), LF Power (r = 1), RMSSD (r = 0.99), SDNN (r = 0.99), NN50 (r = 0.99), and pNN50 (r =0.99). The Bland & Altman plot demonstrated a high level of agreement among approaches for all parameters. Conclusion: According to the finding, which showed a high level of agreement because it provides values similar to PRV and HRV for all parameters, the idea of PRV rather than HRV can be used to assess sympathovagal regulation in a broad community-based investigation alongside HRV under various clinical circumstances.
Keywords
Electrocardiogram; Heart rate variability; Heart rate; Photoplethysmography; Pulse rate variability
Download this article as:| Copy the following to cite this article: Farhan A, Mouhsen A, Labakoum B, Rattal M, Lyazidi A. Assessing Heart Rate Variability and Pulse Rate Variability Patterns in Cardiac Patients: Exploring the Utility of Photoplethysmography and Electrocardiography. Biomed Pharmacol J 2024;17(1). |
| Copy the following to cite this URL: Farhan A, Mouhsen A, Labakoum B, Rattal M, Lyazidi A. Assessing Heart Rate Variability and Pulse Rate Variability Patterns in Cardiac Patients: Exploring the Utility of Photoplethysmography and Electrocardiography. Biomed Pharmacol J 2024;17(1). Available from: https://bit.ly/4ccFFAV |
Introduction
Over twenty years ago, a working committee of the European Society of Cardiology and the North American Society of Pacing and Electrophysiology established heart rate variability as the period between two successive heartbeats1. HRV has been used to establish a specific cardiac vagal tone index for the parasympathetic nervous system2,3. Heart rate variability (HRV) has emerged as a noninvasive marker of autonomic nervous system (ANS) activity, reflecting the dynamic balance between sympathetic and parasympathetic influences on the heart. HRV analysis is fascinating in human performance and health monitoring, where it has been linked to various physiological and psychological states, including stress, fatigue, and recovery4. Many factors influence measures of heart rate variability, such as age, obesity, and postural changes, resulting in altered autonomic nervous system tone and stress index measures5.
Additionally, HRV is a straightforward, affordable, and noninvasive assessment that appeals to many cardiology and psychophysiology researchers. The interbeat interval (IBI), photoplethysmography, and electrocardiogram (ECG) are methods of measuring heart rate variability (HRV)6. While ECG recordings have higher accuracy and are more helpful in detecting ORS or R peaks and adjusting for electrode errors, traditional devices use them to estimate heart rate variables7 8. The time between heartbeats is estimated utilizing polar heart rate or chest belt records equipment because contemporary technologies use IBI to assess HRV9. These models’ major problems are inaccurate IBI detection and artifacts brought on by skin motion, as well as the fact that they only use IBI and not accurate ECG signal, R-wave, or QRS detection10.
Regarding a method of measuring pulse rate variability (PRV), photoplethysmography (PPG) digitizes observations of absorbed light, which changes with periodic circulation in the arteries11. In a few earlier studies, an association between HRV and PRV has been shown12 13. According to several studies, a smartphone or inexpensive equipment might also be used by anyone to measure PRV rapidly 14 15. PPG has experienced a revival in recent decades thanks to developments in optoelectronics and digital signal processing, and it is now likely the most widely utilized technique in clinical monitoring. PPG technology has the advantages of being non-intrusive, affordable, and simple to use 6.
An oximeter for pulse (PO) is available by default in medical centers, and the analysis of HRV in the surveillance process without necessitating an electrocardiogram (ECG) has a significant benefit. Other than for MRI (magnetic resonance imaging), it is prohibited to use ECG electrodes or other metal-containing sensors because they can interfere with powerful electromagnetic fields. Compared to an ECG, which typically requires at least three leads and electrodes, the PPG signal can often be detected by just placing a single sensor on a finger or earlobe. These electrocardiogram electrodes frequently need to be put in the chest, necessitating patients to undress and presenting a problem for patients16.
Therefore, the aim is to investigate the correlation between HRV for the ECG signal and PRV in a cardiac patient.
Material and method
Data
The data in this investigation included the physiological signals of 53 patients (21 men and 32 women) aged between 19-96 from the PhysioNet Dataset. The Electrocardiogram (ECG) and Photoplethysmogram (PPG) signals records are about 8 minutes, and the sampling rate is 125 hertz (Hz). Data and patient notations were collected from critically ill patients during their hospitalization at Beth Israel Deaconess Medical Centre (Boston, MA, USA) 17 18.
Analysis method
After obtaining the data containing many signals, such as the ECG with three leads (II, V1, V5), PPG, and respiratory impedance signal, two signals were chosen: lead II, because it gives a higher peak than the other leads for the ECG signal, and the PPG signal to use in the HRV analysis. Then, using the Acqknowledge 5.0 software, which was attached to the BioPac system (MP160, USA), HRV parameters were produced together with estimates of the PRV from the PPG signal, and the R-R interval was calculated independently for the ECG signal. For HRV analysis, the linear mode was used with the time and frequency domains. The standard deviation of (RR, PP) interval (SDNN), root mean square of (RR, PP) interval adjacent (RMSSD), number of (RR, PP) upper 50ms (NN50 COUNT), proportion of NN50 (PNN50%), power spectral of low frequency (LF in ms), high frequency (HF in ms), normalized unite for LFnu, HFnu. The proportion of LF/HF for the time and frequency domains was calculated, respectively.
Statical analyzing
The data was statistically analyzed using SPSS software version 26. For continuous variables, the mean and standard deviation are provided. The variances in measurements were compared using a paired-sample t-test. The Bland-Altman approach and standard linear regression were used to test the agreement method, and the coefficient of correlation (CC) was calculated using the Spearman rank correlation method. It was decided to use a correlation coefficient to denote a suitable level of relationship 19 20. A p-value was chosen (p< 0.05).
Result
According to the results obtained, such as shown in Table 1 and figures, firstly, from the calculation of RR and PP intervals, we find that both signals provide close values for all parameters of HRV.
Table 1: The linear parameter of the Heart Rate Variability for the two signals ECG, PPG
|
Variable |
Electrocardiogram Signals |
Photoplethysmogram Signals |
Correlation coefficient(r) |
p.value |
CI 95% |
|
Time domain |
|||||
|
Mean PP, RR (ms) |
695.6 ± 112.9 |
694.4 ± 112.9 |
0.998 |
0.163 |
-0.46 to 2.66 |
|
Mean HR (Beats) |
89.2 ± 13.5 |
89.5 ± 13.8 |
0.992 |
0.267 |
-0.72 to 0.20 |
|
RMSSD (ms) |
76.1 ± 99.4 |
74.9 ± 92.2 |
0.995 |
0.894 |
-0.66 to 0.58 |
|
SDNN (ms) |
54.3 ± 61.8 |
54.5 ± 62.1 |
0.999 |
0.321 |
-0.58 to 0.19 |
|
NN50 |
84 ± 144.6 |
89.4 ± 140.1 |
0.999 |
0.11 |
-0.8 to 0.08 |
|
pNN50 (%) |
14.9 ± 24.8 |
12.8 ± 22.6 |
0.995 |
0.465 |
-0.13 to 0.27 |
|
Frequency Domain |
|||||
|
LF Power (ms2) |
1328.7 ± 3619.9 |
1350.3 ± 3590.50 |
1 |
0.056 |
-1.19 to 0.016 |
|
HF Power (ms2) |
2687.6 ± 6851.4 |
2610.9 ± 6852 |
1 |
0.452 |
-1.27 to 0.58 |
|
LF nu |
36.4 ± 22.1 |
33.6 ± 24 |
0.999 |
0.084 |
-0.46 to 0.030 |
|
HF nu |
63.2 ± 21.9 |
69.1 ± 21.8 |
0.998 |
0.633 |
-0.25 to 0.40 |
|
LF/HF |
1.7± 5.3 |
1.6 ± 4.6 |
0.997 |
0.355 |
-1.17 to 0.32 |
Every variable has a p-value greater than 0.05. for all parameters delivered from the ECG and PPG signals. All parameters either in the frequency domain or in the time domain for both signals showed a strong correlation (LFnu, HFnu, and proportion of LF/HF), (RR intervals, SDNN, NN50, RMSSD, and pNN50), (r ≥ 0.99, p>0.05). Every feature for each patient generated from the ECG and PPG exhibits good agreement for every parameter in the Bland-Altman analysis (see Figures 1 and 2).
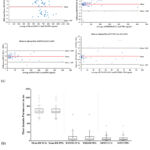 |
Figure 1: (a) B&A Plot of the average values of the time-domain indices versus their differences, (b) Boxplot of time-domain indices. |
 |
Figure 2: (a) B&A Plot of the average of the Frequency-domain indices versus their differences, (b) Boxplot of Frequency-domain indices. |
Discussion
Two commonly used methods for measuring HRV are electrocardiogram (ECG) and photoplethysmography (PPG), which provide distinct measures of cardiac activity.
In this study, we compared HRV analysis using electrocardiogram (ECG) and photoplethysmogram (PPG) signals in a sample of patients. We examined the agreement and correlation between various HRV parameters derived from ECG and PPG signals, including frequency-domain and time-domain measures. Our findings suggest that both ECG and PPG signals can be used for HRV analysis.
According to the findings of the current investigation, the pulse interval variability (PIV) and heart rate variability provided by the electrocardiogram (ECG) and photoplethysmogram (PPG) signals show strong agreement for critically ill patients.
As shown in this investigation, the earlier results presented by C. Kiran Kumar, JA Heathers et al., Gil E et al, and Hayano et al., for healthy participants showed a significant link between pulse rate variability (PRV) and Heart rate variability (HRV). So, it established PRV as an accurate replacement for HRV, which has been utilized to get beyond the confounding effect of breathing of evaluation in HRV parameters15 21 22 23. Moreover, it may be impacted by exercise, stress, changes in hemodynamics, or adjustments in metabolism. In addition, HRV has additional issues with wire density, complicated morphology, drift, and adhesive electrode patches. While little research, including Constant I, 1999, has disputed the preceding consensus 24.
Clinically significant factors, including heart and respiratory rate and respiration-induced intensity fluctuations, can be measured using the PPG signal. The usage of PPG has risen in clinical monitoring in both research and practice due to recent developments and improvements in digital signal processing. Modern PPG sensors use inexpensive optoelectronic modules that operate in the red or infrared spectrum. Additionally, it is utilized to calculate cardiac output, endothelial and venous function, peripheral arterial occlusion, and pulse wave velocity. To highlight the most important results of the Bland-Altman technique, we collected the standard deviation and Bland-Altman plot for the major HRV indices corresponding to the ECG-PPG comparisons. The indices of both approaches showed significant agreement with one another. According to a study released by Wong Jih-Sen et al., all Heart rate variability (HRV) parameters and the corresponding Pulse rate variability (PRV) measures of both hands in each patient showed a significant agreement 25. Therefore, we utilized the left side to provide a more accurate and reliable assessment and observed that the PRV and HRV had an acceptable level of agreement.
In contrast, several researchers discovered little concordance between PRV and HRV 24. In various situations, various factors may affect how HRV and PRV differ. Due to physical differences, mechanical waves created in vessels for PRV and electrical waves originating from the heart 26.
A primary or secondary autonomic failure can be assessed using HRV and RVP, which are early indications of ANS dysfunction. They also aid in lowering the mortality and morbidity linked to cardiovascular diseases27. They are convenient, noninvasive techniques for diagnosing neurological conditions and for use in exercise interventional investigations and sports evaluation 28.
The current study has limits, as it was conducted on a group with a disease to be sure of the result. So, we would like to apply the same study to a large sample of people to predict their health status as part of a prospective study of various diseases, including hemodynamic diseases such as hypotension and real-time hospitalized patients, by using PVR parameters.
Conclusion
The study’s findings suggest that PRV derived from PPG-Signal can be as effective as HRV in assessing the autonomic tone of the heart and predicting the health status of patients based on the comparison of calculated PRV parameters with HRV parameters in a group of patients with a known medical history.
Acknowledgment
No Acknowledgment
Conflict of Interest
There is no conflict of interests in association with the material presented in this paper.
Funding Source
This study did not receive any funding.
References
- Malik M. Heart rate variability: Standards of measurement, physiological interpretation, and clinical use. Circulation. 1996;93:1043-1065.
CrossRef - Li Z, Snieder H, Su S, A longitudinal study in youth of heart rate variability at rest and in response to stress. Int J Psychophysiol. 2009;73(3):212-217. doi:10.1016/j.ijpsycho.2009.03.002
CrossRef - Laborde S, Mosley E, Thayer JF. Heart Rate Variability and Cardiac Vagal Tone in Psychophysiological Research – Recommendations for Experiment Planning, Data Analysis, and Data Reporting. Frontiers in Psychology. 2017;8:213. doi:10.3389/fpsyg.2017.00213
CrossRef - Farhan A, Lyazidi A, Labakoum B, Rattal M, Mouhsen A. Impact of Heart Rate Variability on Physiological Stress: Systematic Review. Biomed Pharmacol J. 2023;16(2):997-1010. doi:10.13005/bpj/2681
CrossRef - Farhan A, Lyazidi A, Elkettani S, Labakoum B, Rattal M, Mouhsen A. Linear Analysis of ECG Data Variability to Assess The Autonomic Nervous System in Two Different Body Positions. The Egyptian Journal of Hospital Medicine. 2023;90(1):459-464. doi:10.21608/ejhm.2023.279661
CrossRef - Schäfer A, Vagedes J. How accurate is pulse rate variability as an estimate of heart rate variability? International Journal of Cardiology. 2013;166(1):15-29. doi:10.1016/j.ijcard.2012.03.119
CrossRef - Kleiger RE, Stein PK, Bigger Jr. JT. Heart Rate Variability: Measurement and Clinical Utility. Annals of Noninvasive Electrocardiology. 2005;10(1):88-101. doi:10.1111/j.1542-474X.2005.10101.x
CrossRef - Munoz ML, Roon A van, Riese H, Validity of (Ultra-)Short Recordings for Heart Rate Variability Measurements. PLOS ONE. 2015;10(9):e0138921. doi:10.1371/journal.pone.0138921
CrossRef - Farhan A, Rattal M, Labakoum B, Essoukaki E, Mouhsen A, Lyazidi A. Comparison of automatic and manual methods for analyzing heart rate variability parameters. In: 1ST INTERNATIONAL CONFERENCE ON CHEMICAL AND BIOLOGICAL SCIENCES (ICCBS’22). Sciendo; 2023:39-44. doi:10.2478/9788367405256-006
CrossRef - Jarrin DC, McGrath JJ, Giovanniello S, Poirier P, Lambert M. Measurement fidelity of heart rate variability signal processing: The devil is in the details. Int J Psychophysiol. 2012;86(1):88-97. doi:10.1016/j.ijpsycho.2012.07.004
CrossRef - Leikan G, Rossi E, Sanz Mc, Evaluation of agreement between temporal series obtained from electrocardiogram and pulse wave. J Phys: Conf Ser. 2016;705:012038. doi:10.1088/1742-6596/705/1/012038
CrossRef - Georgieva-Tsaneva GN, Gospodinova E. Comparative Heart Rate Variability Analysis of ECG, Holter and PPG Signals. IJACSA. 2021;12(12). doi:10.14569/IJACSA.2021.0121261
CrossRef - Peng R chao, Zhou X, Lin WH, Zhang YT. Extraction of Heart Rate Variability from Smartphone Photoplethysmograms. Computational and Mathematical Methods in Medicine. 2015;2015:1-11. doi:10.1155/2015/516826
CrossRef - Cho Y, Julier SJ, Bianchi-Berthouze N. Instant Stress: Detection of Perceived Mental Stress Through Smartphone Photoplethysmography and Thermal Imaging. JMIR Ment Health. 2019;6(4):e10140. doi:10.2196/10140
CrossRef - Heathers JAJ. Smartphone-enabled pulse rate variability: An alternative methodology for the collection of heart rate variability in psychophysiological research. International Journal of Psychophysiology. 2013;89(3):297-304. doi:10.1016/j.ijpsycho.2013.05.017
CrossRef - Bánhalmi A, Borbás J, Fidrich M, Bilicki V, Gingl Z, Rudas L. Analysis of a Pulse Rate Variability Measurement Using a Smartphone Camera. Journal of Healthcare Engineering. 2018;2018:1-15. doi:10.1155/2018/4038034
CrossRef - Pimentel MAF, Johnson AEW, Charlton PH, Toward a Robust Estimation of Respiratory Rate From Pulse Oximeters. IEEE Transactions on Biomedical Engineering. 2017;64(8):1914-1923. doi:10.1109/TBME.2016.2613124
CrossRef - Goldberger AL, Amaral LAN, Glass L, PhysioBank, PhysioToolkit, and PhysioNet: Components of a New Research Resource for Complex Physiologic Signals. Circulation. 2000;101(23). doi:10.1161/01.CIR.101.23.e215
CrossRef - Errotta ANSP, Eklin ANTJ, Ives BENAH, Eanwell LEAHEM, Arburton DAERW. VALIDITY OF THE ELITE HRV SMARTPHONE APPLICATION FOR EXAMINING HEART RATE VARIABILITY IN A FIELD-BASED SETTING. Published online 2017:2296-2302.
CrossRef - Bunce C. Correlation, Agreement, and Bland-Altman Analysis: Statistical Analysis of Method Comparison Studies. American Journal of Ophthalmology. 2009;148(1):4-6. doi:10.1016/j.ajo.2008.09.032
CrossRef - Hayano J, Barros AK, Kamiya A, Ohte N, Yasuma F. Assessment of pulse rate variability by the method of pulse frequency demodulation. BioMed Eng OnLine. 2005;4(1):62. doi:10.1186/1475-925X-4-62
CrossRef - Gil E, Orini M, Bailón R, Vergara JM, Mainardi L, Laguna P. Photoplethysmography pulse rate variability as a surrogate measurement of heart rate variability during non-stationary conditions. Physiol Meas. 2010;31(9):1271-1290. doi:10.1088/0967-3334/31/9/015
CrossRef - Kiran kumar C, Manaswini M, Maruthy KN, Siva Kumar AV, Mahesh kumar K. Association of Heart rate variability measured by RR interval from ECG and pulse to pulse interval from Photoplethysmography. Clinical Epidemiology and Global Health. 2021;10(December 2020):100698. doi:10.1016/j.cegh.2021.100698
CrossRef - Constant I, Laude D, MURAT I, ELGHOZI JL. Pulse rate variability is not a surrogate for heart rate variability. Clinical science (London, England : 1979). 1999;97:391-397. doi:10.1042/CS19990062
CrossRef - Wong JS, Lu WA, Wu KT, Liu M, Chen GY, Kuo CD. A comparative study of pulse rate variability and heart rate variability in healthy subjects. J Clin Monit Comput. 2012;26(2):107-114. doi:10.1007/s10877-012-9340-6
CrossRef - Mejía-Mejía E, Budidha K, Ysehak Abay T, May J. Heart Rate Variability (HRV) and Pulse Rate Variability (PRV) for the Assessment of Autonomic Responses. Frontiers in Physiology. 2020;11:779.
CrossRef - Li X, Hu C, Meng A, Guo Y, Chen Y, Dang R. Heart rate variability and heart rate monitoring of nurses using PPG and ECG signals during working condition: A pilot study. Health Science Reports. 2022;5(1). doi:10.1002/hsr2.477
CrossRef - Maheshkumar K, Sivakumar AV, Maruthy KN, Padmavathi R. Hot arm and foot bath on heart rate variability and blood pressure in healthy volunteers – needs to be verified with standard device? Journal of Complementary and Integrative Medicine. 2020;9(0):1. doi:10.1515/jcim-2019-0318
CrossRef

