
Manuscript accepted on :30-12-2022
Published online on: 18-10-2023
Plagiarism Check: Yes
Reviewed by: Dr. Hanna Wilczura-Wachnik
Second Review by: Dr. Ankit Chowdhury
Final Approval by: Dr. Ian James Martin
Monika Sharma1 , Diksha Gulati1, Anjoo Kamboj1 and Saahil Arora2*
1Chandigarh University Gharuan, Chandigarh College of Pharmacy, CGC Campus, Landran, Mohali, Punjab, India.
2University Institute of Pharma Sciences, Chandigarh University, Chandigarh Ludhiana Highway, Mohali, Punjab India.
Corresponding Author E-mail: saahil70@gmail.com
DOI : https://dx.doi.org/10.13005/bpj/2804
Abstract
A simultaneous study is very important analytical parameter which helps to assess compatibility of mixture of drugs. UV spectrophotometer is one of the simplest and efficient methods to assess simultaneous parameters. Due to its economical approach, we have used UV spectrophotometer. Curcumin and Gentamicin sulphate have zero crossing points of 420 nm and 244 nm, respectively, in first-order derivative spectroscopy. The solvent for the spectrophotometric process was 0.1 N NaOH. Curcumin and Gentamicin sulphate linearity was established over range of concentrations of 2–12 g/ml, with correlation coefficients of 0.995 and 0.993. The mean percent recoveries Curcumin and Gentamicin sulphate were found to be in the range of 98.88 percent and 98.54 percent, respectively. The approach has been found to be repeatable in both inter day and intraday testing. The approach was proven to be both precise and reliable. According to the recovery investigation, the approach was effectively applied to pharmaceutical formulation with no interference from excipients. The results of the analysis were statistically evaluated, as well as by recovery trials. The LOD and LOQ for Gentamicin sulphate in phosphate buffer were found to be 0.024µg/ml and 0.045µg/ml, respectively and values for Curcumin were 0.024µg/ml and 0.037 µg/ml, respectively which indicates adequate sensitivity of method
Keywords
Curcumin; Burn Wound Infections; Gentamicin sulphate; Simultaneous equation method; Validation
Download this article as:| Copy the following to cite this article: Sharma M, Gulati D, Kamboj A, Arora S. Simultaneous Estimation of Curcumin and Gentamicin by UV-VIS Spectrometric Methods or Derivative Spectroscopic Techniques. Biomed Pharmacol J 2023;16(4). |
| Copy the following to cite this URL: Sharma M, Gulati D, Kamboj A, Arora S. Simultaneous Estimation of Curcumin and Gentamicin by UV-VIS Spectrometric Methods or Derivative Spectroscopic Techniques. Biomed Pharmacol J 2023;16(4). Available from: https://bit.ly/3Q1YGf3 |
Introduction
Unlike other types of wound injuries, burn wound injuries results into remarkable mortality rate due to which millions of people get affected and seek medical attention. A number of antibiotics are utilized with an aim to drop down the threat of microbial infection in burn wound patient prior to be 0 encounters. 1 Few of them routed through dermal layers and others through oral or injectable route. There are a number of antibiotic therapies available for treatment of burn wound infections but these treatments face a number of challenges like antibiotic resistance, delayed release, delivery of optimum concentration of drug at site of action.2 Gentamicin (GEN) and Curcumin (CUR) is the potent antibiotic against bacterial infections produced by Gram positive and gram-negative bacteria respectively. As per the literature, In burn injury, a combination of Curcumin and Gentamicin revealed synergism against P. aeruginosa. So here we have selected combination of these two drugs to make an effective formulation.3 the Curcumin is the natural compound (Phenolic), extracted from turmeric, one of the popular Indian spices from plant of Curcuma Longa Linn. This compound has antioxidant, anti-inflammatory as well as antimicrobial actions.4
It’s already been suggested by a number of studies that Curcumin have poor absorption through gut and it also conquers Cytochrome P450 isoenzyme and metabolized by glucuronidation. 5
Gentamicin sulfate is basically isolated from the Micro mono spore’s purpurea that is an actinimycete. The Derived antibiotics is a water soluble antibiotic belongs to a group of aminoglycosides6, 7.
Various Curcumin and Gentamicin sulphate formulations include nanoparticles, liposomes phytosomes, improves bioavailability solubility, dissolution rate.The binary mixture must be more effective in controlling diseases. Analytical techniques tend to provide information of the constituents of particular formulation mentioned in the label.8 For separation and estimation of multi-components of a formulation, various techniques, like chromatographic and Spectrophotometric, have been reported 9,10 .Chromatographic techniques like HPLC being quite more complicated , time-consuming, and require high consumption of organic solvents 11 while in HPTLC, plate length is limited so separation can take place up to certain length. Earlier methods reported for simultaneous estimation of Curcumin and Gentamicin sulphate in nanoformulations. UV Visible Spectrophotometer has advantages than other analytical techniques as it is one of simple, rapid, method for quantitative determination. UV Spectrophotometric method are reported in numerous mixture of drugs such as Cefixime and Ofloxacin12,Cefixime and Lisinopril13,Rosuvastatin Calcium and Glimepride14,Nimesulide and Diclofenac Sodium15,Metformine Hydrochloride and Pioglitazine16,Tizanidine and Aceclofenac17 , Levosulpride and Esomeprazole 18,Diazepam and Propranolol 19in bulk and Tablet dosage form and alone,Triamcealone20,Ziprasidone21 in tablet dosage form. Present work emphasizes onvalidating of UV Visible Spectrophotometric analytical method for Curcumin and Gentamicin sulphate, in combination.
Materials and Methods
Chemicals and Reagents
Curcumin was procured from Lobachemie, Mumbai while Gentamicin sulphate from Himedia Ltd., Mumbai, India and analytical grade of Methanol was used from M/s Merck Ltd., Mumbai, India.
Instrumentation
The projected effort was carried on Shimadzu UV-1800; UV spectrophotometer which have double beam double detector pattern with a1 cm quartz coordinated cell. Calibrated analytical balance was opted for weighing of contents.
Selection of Solvents
On the basis of solubility study methanol was selected as the solvent for dissolving Curcumin and Gentamicin sulphate.
Preparation of binary mixture
The binary mixtures Curcumin and Gentamicin sulphate in a 1:1 proportion by weight were prepared and mechanically homogenized with a mortar and pestle
Preparation of standard stock solution of Gentamicin sulphate and Curcumin:
Curcumin Stock Solution
Curcumin (10 mg) was properly weighed and dissolved in methanol (20 ml) using ultrasonication for approximately 10 minutes in a 100 ml volumetric flask. Curcumin standard stock solution (100/ml) was then prepared up to the required volume using methanol.
Curcumin Working Standard Solution
Curcumin Standard Solution for Work Standard stock solution of Curcumin To make a working standard solution, 5 ml of methanol was diluted to 50 ml a concentration of ten grammes per milliliter
Gentamicin sulphate Stock Solution
Stock Solution of Gentamicin sulphate In a 100 ml volumetric flask, a properly weighed quantity of Gentamicin sulphate (10 mg) was dissolved in water (20 ml) using ultrasonication for around 10 minutes. The Gentamicin sulphate standard stock solution (100/ml) was then brought up to the required volume using water.
Gentamicin sulphate working Standard Solution
Working Standard Solution of Gentamicin sulphate Standard stock solution of Gentamicin sulphate to make a working standard solution, 5 ml of phosphate buffer pH 6.8 was diluted to 50 ml. 100 g per ml.
Determination of λ Max of Individual Component
For Curcumin and Gentamicin sulphate 2 g/ml dilution, an adequate aliquot fraction of Gentamicin sulphate and Curcumin (2 ml) was transferred to two separate 10 ml volumetric flasks, and the volume was brought up to the mark using methanol and water. Between 200 nm and 800 nm, drug solutions were scanned sequentially. Gentamicin sulphate has a maximum at 244 nm, while Curcumin has a peak at 420 nm. Before analysis, the solutions were filtered employing Wattmann filter paper
 |
Graph 1: UV Spectra of Gentamicin Sulphate
|
 |
Graph 2: UV Spectra of Curcumin
|
Linearity Study for Curcumin
Six separate 10 ml volumetric flasks were loaded with an accurately specified quantity of Curcumin working standard solution. To get concentrations (2-12g/ml), the volume was brought up to the mark with methanol. These solutions’ absorbance was measured at 420 nm the absorbance Vs concentration calibration curve was constructed as illustrated in (fig. 1).
Linearity Study for Gentamicin sulphate
Six separate 10 ml volumetric flasks were filled with accurately measured aliquot amounts of Gentamicin sulphate working standard solution. To acquire concentrations (2-12g/ml), the volume was brought up to the mark using distilled water. These solutions’ absorbance was measured at 244nm. The absorbance Vs concentration calibration curve was plotted as depicted in (Fig. 2).
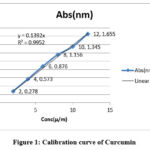 |
Figure 1: Calibration curve of Curcumin
|
 |
Figure 2: Calibration curve of and Gentamicin sulphate
|
Overlay Spectra of Gentamicin Sulphate and Curcumin
The overlain spectrum of both drugs (2 µg/ml) was recorded (Fig.5) and two wavelengths 420.0 nm (λ max of Curcumin) and 244 nm (λ max of Gentamicin sulphate) were selected for further study.
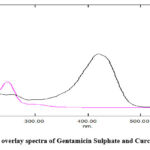 |
Graph 3: overlay spectra of Gentamicin Sulphate and Curcumin |
Linear regression analysis
Linear regression analysis of the data attained 2-12 µg/ml which depicts highly linear relationship as the correlation coefficient (R2) value were around 0.995for Curcumin and 0.993 for Gentamicin sulphate. Calibration Curve equation, Y= 0.0015x ±001 for Gentamicin sulphate and Y=0 .139x±002 for Curcumin at λmax244nm for Gentamicin sulphate and 420 for Curcumin
Simultaneous Equation method
Curcumin and Gentamicin sulphate mixtures were weighed appropriately at 25mg each. The Gentamicin sulphate is first dissolved in water (5 ml), then transferred to a volumetric flask with a capacity of 50 ml, where the Curcumin is dissolved in a small amount of methanol (20 ml) using ultrasonication for about 10 minutes. The two solutions were then combined in a 50 ml volumetric flask, and the volume was increased to the desired level with methanol to create a mixed standard stock solution (100 mg/ml). To obtain a working standard solution of 100 g / ml, 5 ml of standard stock solution was diluted to 50 ml in methanol. In 10 ml volumetric flasks, an adequate amount of Gentamicin sulfate and Curcumin (2 ml) were transferred, and the volume was made up to the mark using the simultaneous equation approach (Vierodt’s method), the concentrations of each component were calculated.
A1 = ax1bcx + ay1 bcy——— (at λ1–244nm)
A2 =ax2bcy + ay2bcy ———- (at λ2–420 nm)
Amount of each drug was estimated using following equations,

A1= absorbance value(244nm)
A2= absorbance value (420nm)
ax1= Absorptivity of Gentamicin sulphate at 244nm
ay1= Absorptivity of Curcumin at 420nm
ax2= Absorptivity of Gentamicin sulphate at 420nmn
ay2= Absorptivity of Curcumin at 244nm
C1= concentration of Gentamicin sulphate in μg/ml
C2= concentration of Curcumin in μg/ml
The Absorptivity values for simultaneous equation are enclosed in Table 2
Table 1: Absorptivity Values for Simultaneous Estimation of Gentamicin sulphate and Curcumin
|
S. No |
Drug |
Parameters |
Absorptivity |
||
|
1 |
Gentamicin sulphate |
ax1 |
ax2 |
0 |
0.012 |
|
2 |
Curcumin |
ay1 |
ay2 |
0.2485 |
0.061 |
|
3 |
Mixture |
A1 |
A2 |
0.497 |
0.146 |
|
Each value is an average of three determinants. C1 and C2 were found to be 2 μg/ml in mixture |
|||||
Validation of Proposed Method
The Proposed method was validated as per the ICH guidelines
Accuracy
The closeness of agreement between the value regarded as a conventional true value and the value found is expressed by the accuracy of an analytical technique. It’s a match between the value discovered and a previously agreed-upon reference value. 21 The method’s accuracy was tested by making a 1 g/ml stock solution, then diluting it to 100 g/ml, then preparing 80 percent, 100 percent, and 120 percent dilutions and analyzing them at these varied levels. With a percent relative standard deviation (percent RSD) of less than 2.00 percent, it has outstanding reproducibility. Within the range stated in table no. 2, the accuracy was established.22
Table 2: Accuracy Study
|
Accuracy Parameters |
Curcumin |
Gentamicin sulphate |
||||
|
Initial amount(µg/ml) |
3 µg/ml |
3 µg/ml |
3 µg/ml |
2µg/ml |
2µg/ml |
2 µg/ml
|
|
Added amount (µg/ml) |
2.4 µg/ml |
3 µg/ml |
3.6 µg/ml |
1.6 µg/ml |
2 µg/ml |
2.4 µg/ml |
|
%Recovery |
98.1% |
96% |
98.4% |
96.1% |
98.3% |
95.4% |
|
%RSD |
0.15% |
0.14% |
0.19% |
0.23% |
0.19% |
0.21% |
Precision
It is defined as the method’s degree of repeatability under normal operating conditions. Three distinct concentrations of diluted solution (25 percent, 50 percent, and 75 percent) were evaluated at different time-points on the same day, and the study was repeated the next day. To validate the precision of the devised approach, SD and percent RSD values were computed. 24 Intermediate (inter-day) and repeatability (intra-day) investigations calculated it for three concentration levels (2, 4,6g/ml), encompassing the complete linearity range, and it was expressed as percent RSD. The results show that the procedure is extremely accurate. In Table No. 3, the precision values are tabulated.
Table 3: Curcumin and Gentamicin Sulphate Precision Study
|
Curcumin Precision Study |
||||
|
Conc. taken |
Conc. Observed± SD |
RSD |
||
|
3 µg/ml |
3.18±0.017 |
0.53% |
||
|
6 µg/ml |
6.13±0.029 |
0.47 % |
||
|
9 µg/ml |
9.04±0.012 |
0.132 % |
||
|
Intermediate Precision Evening (Day1) |
||||
|
Conc. taken |
Conc. Observed± SD |
RSD |
||
|
3 µg/ml |
3.06±0.026 |
0.84% |
||
|
6 µg/ml |
6.08± 0. 015 |
0.24% |
||
|
9 µg/ml |
9.19±0.019 |
0.20% |
||
|
Intermediate Precision Morning Inter day (Day 11) |
||||
|
Conc. taken |
Conc. Observed± SD |
RSD |
||
|
3 µg/ml |
3.13± 0.027 |
0.86% |
||
|
6 µg/ml |
6.26±0.012 |
0.19% |
||
|
9 µg/ml |
9.28±0.016 |
0.17% |
||
|
Gentamicin Sulfate Precision Study |
||||
|
Conc. taken |
Conc. Observed± SD |
RSD |
||
|
3 µg/ml |
3.07± 0.014 |
0.45% |
||
|
6 µg/ml |
6.29± 0.019 |
0.30 % |
||
|
9 µg/ml |
9.17± 0.011 |
0.11% |
||
|
Intermediate Precision Evening (Day1) |
||||
|
Conc. taken |
Conc. Observed± SD |
RSD |
||
|
3 µg/ml |
3.24± 0.015 |
0.46% |
||
|
6 µg/ml |
6.19± 0.012 |
0.19 |
||
|
9 µg/ml |
9.37±0.017 |
0.18
|
||
|
Intermediate Precision Morning Inter day (Day 11) |
||||
|
Conc. taken |
Conc. Observed± SD |
RSD |
||
|
3 µg/ml |
3.30± 0.028 |
0.84% |
||
|
6 µg/ml |
6.24±0.019 |
0.30 |
||
|
9 µg/ml |
9.24±0.014 |
0.15% |
||
Robustness
It is used as a parameter characterizing the stability of the method with respect to variations of the internal factors of the method.25It was examined by analyzing a drug concentration of 100µg/ml with minute changes in λmax of both the drugs. It has ability to remain unaffected by changes in λmax in analytical parameters. Conc. taken is 3µg/ml which was observed 3.01 in Gentamicin Sulphate and 3.09 in Curcumin by changing λmax.
Ruggedness
Spectrophotometric analysis of different concentrations equivalent to 25 %, 50 % and 75 % diluted solution was performed by two analysts assesses the ruggedness of the developed method. All analytical parameters are remaining unaffected even by performed by another analyst. As Conc. taken is 3µg/ml by both analyst and observed is 3.04 and 3.08
Sensitivity
LOD: The lowest concentration of analyte that can be recognized but not measured in a test sample. The lowest concentration of the standard curve that can be computed with reasonable accuracy and precision is referred to as the LOQ. For LOQ22, the noise to signal ratio should be 1:10. Equation 1 has been used to calculate the values of LOD and LOQ.
LOD=3.3σ/S; LOQ=10σ/S σ is standard deviation S is slope
The LOD and LOQ for Gentamicin sulphate in phosphate buffer were found to be 0.024µg/ml and 0.045µg/ml, respectively and values for Curcumin were 0.024µg/ml and 0.037 µg/ml, respectively which indicates adequate sensitivity of method
Conclusion
In first-order derivative spectroscopy, Curcumin and Gentamicin Sulphate have zero crossing points of 420 nm and 244 nm, respectively. The spectrophotometric technique used methanol and distilled water as the solvent. The linearity of Curcumin and Gentamicin sulphate was established throughout a concentration range of 2–12 g/ml, with correlation values of 0.995 and 0.996, respectively. Curcumin and Gentamicin Sulphate were reported to have mean percent recoveries of 98.88 percent and 98.54 percent, respectively. In both inter day and intraday testing, the method was proven to be repeatable. The method has been demonstrated to be accurate and dependable. The approach was successfully applied to pharmaceutical formulation with no influence from excipients, according to the recovery investigation. Recovery trials were used to examine the outcomes of the analysis, which were statistically evaluated. Gentamicin Sulphate LOD and LOQ in phosphate buffer were determined to be 0.024g/ml and 0.045g/ml, respectively, and Curcumin LOD and LOQ were 0.024g/ml and 0.037 g/ml, respectively, indicating appropriate sensitivity of the method.
Conflict of Interest
There are no conflict of interest
Funding Sources
There is no funding sources.
References
- Hussain Z., Thu H.E., Rawas-Qalaji M., Naseem M., Khan S. and Sohail M., Recent developments and advanced strategies for promoting burn wound healing. J Drug Deliv Sci Technol. 2020 :103092.
CrossRef - Singh R., Roopmani P., Chauhan M., Basu S.M., Deeksha W., Kazem M.D., Hazra S., Rajakumara E. and Giri J., Silver sulfadiazine loaded core-shell airbrushed nanofibers for burn wound healing application. Int. J. Pharm, 2021; 613:121358.
CrossRef - Tran Q.H. and Doan T.T., A novel study on curcumin metal complexes: Solubility improvement, bioactivity, and trial burn wound treatment in rats. New J. Chem 2020; 44(30):13036-13045.
CrossRef - Commandeur J. N. M, Vermeulen N.P.E. Cytotoxicity and cytoprotective activities of natural compounds. The case of curcumin.Molecular and Computational toxicology ,Medicinal Chemistry,1996; 26(7) : 667-680. doi.org/10.3109/00498259609046741.
CrossRef - Patel R, Singh S.K , Singh S, Development and Characterization of Curcumin Loaded Transfersome for Transdermal Delivery. J. Pharm. Sci..2009; 1 (4): 71-80.
- Holder G. M,. Plummer J. L, Ryan A.J.The metabolism and excretion of curcumin (1,7-bis-(4-hydroxy-3-methoxyphenyl)-1,6-heptadiene-3,5-dione) in the rat Xenobiotics .1978;8 (12): 761-8.doi.org/10.3109/00498257809069589.
CrossRef - Kelly G.S, Quercetin Monograph .Alternative Medicine Review.2011; 16(2):172-94.
- Rao J. Kadam S, Mahadik .k. Methods of estimation of multi-component formulations: a review, Indian Drugs.2002; 39(7):378-381.
- Delhiraj .N, Anbazhagan .S, Validated chromatographical methods for the simultaneous estimation of antihypertensive drugs in multicomponent formulations. Der Pharma Chemica.2012; 4(6): 2416-2421.
- Chandratrey. A, Sharma. R , Simultaneous spectrophotometric estimation and validation of three component tablet formulation containing paracetamol, nimesulide and tizanidine. Indian Journal of Chemical Technology.2010;17(3):229-232
- Younis. S.E., El-Nahass. S.A., Soliman S.A, Simultaneous Micro-determination of Eplerenone and Torsemide in their Combined Tablets using HPTLC-Dual Wavelength Spectrodensitometric and Spectrophotometric Methods, Microchem. J. 2020;156: 104861doi.org/10.1016/j.microc.2020.104861
CrossRef - Santhi. N, Rajendran. S.S, Kumar Nallasivan .P .Simultaneous Estimation of Cefixime and Ofloxacin in Bulk and Tablet Dosage Form. Asian J. Pharm. Anal…2011;1(3):50-52
- AboulKher .A, SalehHanaa .Spectrophotometric estimation of Lisinopril and Cefiximein bulk and dosage forms., Asian J. Pharm. Anal….2012;2(3) : 90-97
- Asma Afroz1, Tasnuva Haque2et al Spectrophotometric Estimation of Rosuvastatin Calcium and Glimepiride in Tablet Dosage Form. Asian J. Pharm. Anal….2011;1(4):74-78.
- Rawat. S, Gupta. A, Spectrophotometric Estimation of Nimesulide and Diclofenac Sodium in Pharmaceutical Dosage Form. Asian J. Pharm. Anal… 2011; 1(4):85-87.
- Rathod sonali.D, Patil.P.M , Jadhav .S. B. UV Spectrophotometric Simultaneous determination of Metformine Hydrochloride and Pioglitazine in combined dosage forms. Asian J. Pharm. Anal…..2012;2(1):5-9.
- Umle R. S.*, Mundhey A.S.,Wate S.P. UV- Spectrophotometric Method Development and Validation for Estimation of Tizanidine and Aceclofenac in Tablet Formulation. Asian J. Pharm. Anal…2012; 2(4): 101-103.
- Jain .M, Yogesh. A. UV Spectrophotometric Methods for Simultaneous Estimation of Levosulpiride and Esomeprazole in Capsule Dosage Form. Asian J. Pharm. Anal…2012; 2(4): 106-109
- Daharwal S. J. Development and validation of.,UV Spectrophotometric Methods for Simultaneous Estimation of Diazepam and Propranolol in Bulk drug and its formulation. Asian J. Pharm. Anal…2013; 3(1) : 20-23
- Gupta S. K , KumarBabita, Sharma P K. Development and validation of a Spectrophometric method for estimation of Triamcinolone in solid dosage form. Asian J. Pharm. Anal…..2013;3(2):42-43
- Santhi. N, Deepthi C.H,. Rajendran S. S. Spectrophotometric Estimation of Ziprasidone in Bulk and In Pharmaceutical Formulations . Asian J. Pharm. Anal….2011;1(1):8-9
- Savale S.A.G.A.R., . Simultaneous determination of Curcumin and Gefitinib in pure form by using UV spectrophotometric method. Hygeia: journal for drugs and medicines,2017 9(1): pp.1-8.
CrossRef - https://www.fws.gov/aah/PDF/QI
- Goto T, Yoshida Y, Kiso M. Simultaneous analysis of individual catechins and caffeine in green tea. J. Chromatogr. A.1996;749(1-2): 295-299.doi.org/10.1016/0021-9673(96)00456-6
CrossRef - https://sisu.ut.ee/lcms_method_validation/10-ruggedness-robustness
- Rao T. N. Validation of Analytical Methods. Calibration and Validation of Analytical Methods – A Sampling of Current Approaches. .2018.doi.org/ 10.5772/intechopen.72087
CrossRef - J. Chem. Technol. Metal.2010;17(3):229-232 .
CrossRef - Asian J. Pharm. Anal…2013;3(2):42-43

