
Manuscript accepted on :15-06-2023
Published online on: 03-11-2023
Plagiarism Check: Yes
Reviewed by: Dr. Anjaneyulu Vinukonda and Dr. Ankur Kumar Arya
Second Review by: Dr. Nicolas Padilla
Final Approval by: Dr. Patorn Piromchai
Pavan Udavant1* , Gayatri Kanade1, Shubham Khairnar1, Rahul Sable1, Neelam Dashputre1, Anjali Tajanpure1, Dinesh Rishipathak2, Santosh Chhajed2, Musab Tanzeel1, Simona D’Souza1 and Naveed Ahmad1
1Department of Pharmacology, MET’s Institute of Pharmacy, Bhujbal Knowledge, City, Adgaon, Nashik Maharashtra, India.
2Department of Pharmaceutical Chemistry, MET’s Institute of Pharmacy, Bhujbal Knowledge City, Adgaon, Nashik Maharashtra, India.
Corresponding Author E-mail: pavanudavant@gmail.com
DOI : https://dx.doi.org/10.13005/bpj/2784
Abstract
Background: Due to the potential negative effects of artificial food additives on health and the recent surge in consumer awareness of the issue, natural goods are becoming more and more popular in diets. Objective: The main objective of the current study is the evaluation of the protective effect and antioxidant role of Nerolidol against alloxan-induced oxidative stress, hepatotoxicity, and nephrotoxicity. Method: The present experiment was designed as Group I (control), Group II (Alloxan monohydrate, 120 mg/kg i.p), Group III (Ascorbic acid 250 mg/kg p.o), Group IV (Nerolidol 100 mg/kg p.o), Group V (Nerolidol 200 mg/kg p.o), Group VI (Nerolidol 300 mg/kg p.o). Alloxan was given to all groups excluding control group in order to induce hepatorenal toxicity. The groups III, IV, V and VI received the Standard Ascorbic acid and Nerolidol after 72 hrs. of alloxan administration for consecutive 14 days. The protective roles and antioxidant activity of Nerolidol against Alloxan induced oxidative stress and hepatorenal toxicity were evaluated by histopathological changes, measuring hepatic and renal damage biomarkers, antioxidant enzyme levels and malondialdehyde (MDA) parameters in the liver and kidney tissues of rats. Result and Conclusion: The biochemical analysis showed a decrease in serum AST, ALT, ALP, and LDH enzymes, total protein, creatinine, bilirubin, and urea in group III and test groups compared to that of group II. Nerolidol also restored the Alloxan-induced MDA and antioxidant enzyme level to control. Hepatorenal protection of Nerolidol was confirmed by almost normal histological findings in test groups.
Keywords
Antioxidant; Biomarkers; Hepatotoxicity; Nephrotoxicity; Oxidative Stress
Download this article as:| Copy the following to cite this article: Udavant P, Kanade G, Khairnar S, Sable R, Dashputre N, Tajanpure A, Rishipathak D, Chhajed S, Tanzeel M, D’Souza S, Ahmad N. Preclinical Evaluation of Nerolidol’s Hepatoprotective and Nephroprotective Potential. Biomed Pharmacol J 2023;16(4). |
| Copy the following to cite this URL: Udavant P, Kanade G, Khairnar S, Sable R, Dashputre N, Tajanpure A, Rishipathak D, Chhajed S, Tanzeel M, D’Souza S, Ahmad N. Preclinical Evaluation of Nerolidol’s Hepatoprotective and Nephroprotective Potential. Biomed Pharmacol J 2023;16(4). Available from: https://bit.ly/462rbiC |
Introduction
Chronic diseases currently account for a greater portion of global mortality and morbidity than infectious diseases as the global disease profile is changing. In the 20th century, infectious diseases were the leading cause of death and disability. On the other hand, non-communicable, non-infectious chronic illnesses including hepatotoxicity and nephrotoxicity have emerged as the primary causes of mortality and morbidity in this century.1 The number of drugs available to trigger liver regeneration is limited due to the rapid advancements in modern nutrition and medicine. One option for treating hepatorenal toxicity brought on by drugs or pollutants is the availability of safe pharmacological treatments. Consumption of alloxan is connected to the generation of ROS (i.e., elevated malondialdehyde levels and decreased glutathione levels) 2. Neutralizing reactive oxygen species may therefore be a promising therapeutic approach for diabetic kidney damage. More tests to check the levels of GSH and GSSH (oxidized glutathione) are required to infer an oxidative stress condition brought on by alloxan 3.
Oxidative stress can harm the kidneys in several ways. Lipid peroxidation contributes to inflammation and endothelial damage. Many different health and nutritional advantages for humans have been discovered in long-used herbs and fruits.4. Recent studies have found that these natural wonders contain unique phytochemicals that provide them with therapeutic and nutritional qualities. A rising number of studies have shown that essential oils made from medicinal plants have a variety of biological effects.5. Plant-based antioxidants are being studied for use in the treatment of several diseases, such as cancer, cardiovascular disease, and neurological problems. NRL is present in Canarium schweinfurthi, Ferula fukanensis, Baccharis dracunculifolia, and Amaranthus retroflexus, among other plant species. NRL also referred to as ‘3,7,11-trimethyl- 1,6,10-dodecatrien-3-ol,’ is an antioxidant aliphatic xylene alcohol produced by a variety of plant species. It has been proven that NRL has anti-inflammatory, antioxidant, and radical-scavenging capabilities. 6,8. Owing to the fact that sesquiterpene chemical constituents are well known for their antioxidant capabilities, antioxidant activity from nerolidol should be expected 7.
Materials and Methods
Chemicals
Alloxan, Nerolidol, Ascorbic acid, Sodium nitroprusside, Dimethyl sulphoxide (DMSO), n-Butanol, DPPH reagent, and Griess reagent are some examples of related chemicals. Both ascorbic acid and nerolidol, an investigational drug, were purchased from Modern Industries and Sigma Aldrich, Co., respectively.
Experimental Design
Wistar albino rats of both sexes (6-8 weeks), had been split up into 6 groups having 6 rats each. The experimental plan was given the go-ahead from the Institution Animal Ethics Committee (IAEC) of the MET’s BKC Institute of Pharmacy, Nashik. [Approval no. MET-IOP-IAEC/2021- 22/01]
Group no. I: Control, Rats administered with DW p.o. for 14 days straight.
Group no. II: Negative control, Rats administered with Alloxan (120 mg/kg i.p.)
Group no. III: Standard group, Rats administered with Alloxan (120 mg/kg i.p.) on Day 1 and after 72 hrs treated with Vitamin C (250mg/kg p.o.) for 14 days straight.
Group no. IV: Test Group I, Rats administered with Alloxan (120 mg/kg i.p.) on Day 1 and after 72 hrs treated with Nerolidol (100 mg/kg p.o.) for 14 days straight.
Group no. V: Test Group B, Rats administered with Alloxan (120 mg/kg i.p.) on Day 1 and after 72 hrs treated with Nerolidol (200 mg/kg p.o.) for 14 days straight.
Group no. VI: Test Group C, Rats administered with Alloxan (120 mg/kg i.p.) on Day 1 and after 72 hrs treated with Nerolidol (300 mg/kg p.o.) for 14 days straight.
Thirty-six Wistar albino rats had been randomly split into six groups; Group no. one as control, Group no. two as Negative control administered with Alloxan (120 mg/kg i.p.) injections, Group no. three as diabetic group administered with Ascorbic acid (250 mg/kg p.o.) for 14 days straight, and Group no. four, five, and six as diabetics treated with Nerolidol (100 mg/kg, 200 mg/kg, 300 mg/kg p.o.) for 14 consecutive days. After the final treatment, 14 days later, animals were sacrificed. Retro orbital sinus puncture was used to draw blood, and serum was extracted by the process of centrifugation for ten minutes at 3000 rpm at four degree Celsius to measure various biochemical characteristics. Under the influence of ether anesthesia, the rats were euthanized, and the kidney and liver were removed, cleaned in saline solution, weighed, and fixed in 10% formalin solution for histological analysis.
In -Vitro Antioxidant Status Determination
DPPH (2,2-diphenylpicrylhydrazyl) Scavenging activity
The DPPH radical scavenging activity was measured using the procedure given by [9]
Reaction setup
Blank: Distilled Water
Control: Distilled Water + DPPH (Purple colored) Standard: Ascorbic acid + DPPH
Sample: Nerolidol + DPPH
2 ml of sample solutions of Nerolidol (using methanol as a solvent) at various concentrations (20µg/ml, 40 µg/ml, 60 µg/ml, 80 µg/ml, 100 µg/ml) were taken and 0.5mM of DPPH solution was included. After shaking vigorously, the solution was let to stand for thirty minutes in a darkened environment at ambient temperature. Subsequently, the absorption maxima of all the samples were measured using a UV- Visible spectrometer at 517nm. The antioxidant status of the sample was checked in comparison with a known standard Ascorbic acid solution. All samples were analyzed three times. The following formula was used to determine how many DPPH radicals were scavenged:
% Radicals scavenged = (Control OD –Sample OD / Control OD) X 100
Nitric Oxide Radical Scavenging Activity Assay
The strategy is focused on the discovery that sodium nitroprusside (SNP) creates nitric oxide spontaneously in an aqueous environment at physiological pH. The Griess reagent can be used to quantify the number of nitrite ions generated by the subsequent reaction of nitric oxide with oxygen. Competition between nitric oxide scavengers and oxygen reduces the production of nitrite ions 9.
Reaction setup
Blank: Distilled Water + 10mM SNP + PBS (pH 7.4)
Control: Distilled Water + 10mM SNP + PBS (pH 7.4) + Griess reagent
Standard: 10mM SNP + PBS (pH 7.4) + Ascorbic acid + Griess reagent
Sample: 10mM SNP + PBS (pH 7.4) + Nerolidol + Griess reagent
For the investigation, 100 µl of a
sample solution of various extracts was combined with SNP (10 mM) in
phosphate-buffered saline (0.2 M, pH 7.4) and left at ambient temperature for
about 150 minutes. The control was
the same mixture but without containing the sample. 0.5 ml of Griess reagent
(1% sulfanilamide, 2% H3PO4, and 0.1% N-(1- naphthyl) ethylenediamine
dihydrochloride) was added following the
incubation period. At 546 nm, the chromophore’s absorbance was measured. The
standard antioxidant ascorbic acid and nerolidol’s inhibition of nitrite
production were measured in comparison to that of the control group. The
standard antioxidant and nerolidol concentrations were changed, and the percent
of inhibition was linearized against them. Nerolidol’s
inhibitory concentration (IC50), which lowers 50% of nitric oxide generation,
was established. % Inhibition of NO radical
= Control OD – Sample
OD / Control OD) × 100
Biochemical Parameter Estimation
Using Prism diagnostics, Thane, India, reagent kits which are commercially available for measuring cholesterol, bilirubin, creatinine, and urea concentrations as well as ALT, AST, and ALP levels were assessed. With the help of a commercial glucometer developed by Accu-chek, fasting blood glucose was measured.
Assay for Antioxidant Activity
Separately chopped into small pieces, the kidney, and liver were then made into 10% homogenates using an ice-cold 0.05 M potassium phosphate buffer having pH of 7.4. At 4 °C, 15 minutes at 6000 rpm were spent centrifuging the homogenates. Lipid Peroxidation (LPO), reduced glutathione (GSH), and catalase (CAT) estimation assays used the supernatant. The method given by Mohebbati R, 2016 10 was used to measure lipid peroxidation (LPO) level and expressed as n moles of MDA formed/gm protein. Using the technique outlined by Saima Ali et al 2022 was used to measure reduced glutathione (GSH) and the catalase (CAT) level was determined using Mondal, 2017 11; Yavar Mahmoodzadeh, 2017 12 methodology and given as U/mg protein.
Histopathological Examination
A part of the kidney and liver from each experimental group was preserved in a 10% solution of formaldehyde which was dehydrated in varying degrees of alcohol, washed with the help of xylene, and later stored in paraffin. After being divided into miniature portions (5 µm thick), each kidney and liver sample was stained with the hematoxylin-eosin (H&E) pigment. In the sections, the pathological signs were looked into.
Statistical Evaluation
Graph pad InStat was employed to analyze the data. The figures display means and their standard deviations. To determine whether there were any differences in the means, variance analysis in one way (one-way ANOVA) was utilized, followed by Dunnett’s test. P values < 0.05 and 0.01 were used to determine whether statistics were significant.
Results
Evaluation of the potential for in vitro antioxidants
2,2-diphenylpicrylhydrazyl (DPPH) Radical Scavenging Activity
To evaluate the test materials’ ability to scavenge free radicals and act as antioxidants, the deviation in the optical density of DPPH radicals is evaluated.
Table 1: % DPPH radical scavenging activity
|
Concentration of solution (µg/ml) |
DPPH radical scavenging activity (%) (Mean ± SD) |
|
|
Ascorbic acid |
Nerolidol |
|
|
100 |
96.97±1.00 |
39.93±2.21 |
|
200 |
97.03±1.59 |
43.41±1.83 |
|
300 |
97.18±2.01 |
45.99±1.35 |
|
400 |
97.32±1.80 |
48.59±1.01 |
 |
Figure 1: Antioxidant activity of Nerolidol on DPPH |
Due to nerolidol’s scavenging ability, which was discovered to be concentration-dependent, Table 1 and Figure 1 show a significant spike in DPPH radical concentration inhibition. Ascorbic acid showed a stronger scavenging effect (97.32±1.803 %) than Nerolidol (48.59 ±1.016 %). By reducing the concentration of DPPH, the results demonstrated that the ability of ascorbic acid to scavenge free radicals from DPPH was greater than that of Nerolidol.
Nitric Oxide Radical Scavenging Activity
Figure 15 depicts Nerolidol’s and standard ascorbic acid’s impact on nitric oxide scavenging. Standard ascorbic acid inhibited nitric oxide production by 88.95± 1.60% at 400 µg/ml, while Nerolidol inhibited it by 43.56± 1.52% at 400 µg/ml.
Table 2: Nitric oxide radical scavenging activity.
|
Concentration (µg/ml) |
Nitric oxide scavenging activity (%) (Mean ± SD) |
|
|
|
Ascorbiv acid |
Nerolidol |
|
100 |
64.71±3.28 |
24.03±0.94 |
|
200 |
70.88±1.20 |
26.84±1.14 |
|
300 |
88.63±1.94 |
35.71±1.26 |
|
400 |
88.95±1.60 |
43.56±1.52 |
 |
Figure 2: Antioxidant activity of Nerolidol on Nitric oxide scavenging activity. |
Nerolidol has been found to be a powerful inhibitor of nitrite production. This could be due to antioxidant principles found in Nerolidol’s essential oil components, which compete with oxygen for the ability to react with NO radical, preventing the formation of nitrite ions. In both in vitro experiments, the results of the current study demonstrate dose-dependent antioxidant activity, and the effect seen might be attributed to the free radicals being squelched by contributing hydrogen ions or electrons.
Appraisal of Hepatoprotective and Nephroprotective Potential of Nerolidol
Weight of Body, Liver, and Kidney
The body, liver, and kidney weight changes were recorded in normal and experimental rats.
Table 3: The weight of the body, liver, and kidney changes in normal and laboratory rats.
|
Groups |
Body Weight (g) |
Change in Body Weight (g) |
Isolated liver weight (g) |
Isolated kidney weight (g) |
|
|
Initial reading |
Final reading |
||||
|
Normal Control |
167.5 ± 6.89 |
212.66 ± 21.59 |
45.16 |
9.5 ± 0.61 |
1.07 ± 0.14 |
|
Negative Control (Alloxan) |
162 ± 42.5 |
141.16 ± 17.94 |
20.84 |
7.71 ± 0.56 |
0.988 ± 0.13 |
|
Standard (Vit. C) |
175.88 ± 24.4 |
204 ± 37.31** |
28.12 |
9.29 ± 0.28 |
1.098 ± 0.13 |
|
Nerolidol-I (100 mg/kg) |
173.8 ± 37.75 |
206.4 ± 20.14** |
32.6 |
7.88 ± 0.38 ** |
0.983 ± 0.13 |
|
Nerolidol-II (200 mg/kg) |
120.8 ± 25.9 |
134 ± 28.5 |
13.2 |
7.98 ± 0.57 ** |
1.021 ± 0.071 |
|
Nerolidol- III (300 mg/kg) |
156.6± 11.25 |
162.25 ± 45.1 |
5.65 |
9.09 ± 0.37 |
1.045 ± 0.13 |
Each number represents the mean ± SD for 6 rats with a p-value of (**p< 0.01, *p< 0.05), which is notable when compared with the Negative control (Alloxan-treated group).
Biochemical Parameters
Liver Functional Assessments
After necrosis, essential cellular enzymes of hepatocytes such as ALT, AST, ALP, Lactate dehydrogenase, and Cholesterol, Triglycerides are released into the bloodstream, so the cornerstone of hepatic damage, which shows an increase in the number of marker enzymes such as ALT, AST present in the blood is caused by inflammation and necrotic changes in the liver. In comparison to the normal control group, Alloxan administration resulted in a substantial rise (*p<0.05, **p<0.01) in the quantity of ALT, AST, ALP, Total Bilirubin, and Triglycerides.
Table 4: Effect of administration of Nerolidolon basic liver assessments
|
Parameters |
Normal Control |
Negative Control |
Standard (Ascorbic acid) |
Nerolidol-I (100 mg/kg) |
Nerolidol-II (200 mg/kg) |
Nerolidol-III (300 mg/kg) |
|
SGOT/AST (U/L) |
67.37 ± 8.88 |
109.9 ± 12.83 |
68.8 ± 18.06** |
76.1 ± 7.18** |
69.66 ± 11.3** |
66.3 ± 21.9** |
|
SGPT/ALT (U/L) |
78.3 ± 9.6 |
92.7 ± 4.9 |
84.3 ± 3.8 |
83.06 ± 5.03* |
81.32 ± 6.35** |
80.24 ± 3.3** |
|
ALP |
468.5 ± 67.7 |
779 ± 170 |
518.6 ± 174.7** |
680.1 ± 48.6 |
557.83 ± 49.3** |
299.4 ± 81.6** |
|
LDH |
1174.76 ± 544.59 |
1786.3 ± 439.5 |
1319.5 ± 124.2* |
1333.5 ± 145.2 |
1308 ± 95.1** |
1261 ± 132.97** |
|
Cholesterol |
78.34 ± 14.59 |
115.2 ± 9.26 |
95.98 ± 10.6** |
105.82 ± 7.07 |
91.05 ± 5.2** |
89.81 ± 4.09** |
|
Triglycerides |
115.7 ± 34.4 |
194.3 ± 39.9 |
135.3 ± 26.9** |
120.09 ± 10.9** |
117.5 ± 11.46** |
106.54 ± 22.5** |
Results values are the mean and standard deviation for a batch of six readings, asterisks signify statistically significant differences (*p<0.05, **p<0.01)
Group no. I: Normal control; Group no. II Alloxan (120mg/kg i.p); Group no. III: Vitamin C (250 mg/kg p.o.); Group no. IV: Nerolidol (100 mg/kg p.o.); Group no. V: Nerolidol (200 mg/kg p.o.); Group no.VI: Nerolidol (300 mg/kg p.o.)
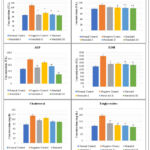 |
Figure 3: Effects of Nerolidol on serum AST, ALT, ALP, LDH, Cholesterol, and Triglycerides levels. |
Results values are the mean and standard deviation for a batch of six readings, asterisks signify differences that are statistically significant (*p˂0.05, **p˂0.01)
Group no. I: Normal control; Group no. II: Alloxan (120 mg/kg i.p); Group no. III: Vitamin C (250mg/kg/p.o.); Group no. IV: Nerolidol (100mg /kg p.o.); Group no. V: Nerolidol (200mg/kg by p.o.); Group no. VI: Nerolidol (300mg/kg).
Kidney Functional Assessments
Comparatively to the normal control group, Alloxan administration led to a notable rise (p 0.01) in Creatinine, Urea, Triglycerides, Cholesterol, and a decrease in total protein levels. At the treatment doses of Nerolidol (100, 200, and 300mg/kg/d), there was a dose-dependent and considerable (p 0.001) decrease in renal biomarkers. ANOVA was used to analyze the data, followed by Dunnett’s test. These results suggested that nerolidol considerably decreased kidney toxicity.
Table 5: Effect of administration of Nerolidol on basic kidney assessments
|
Parameters |
Normal Control |
Negative Control |
Standard |
Nerolidol- I (100 mg/kg) |
Nerolidol- II (200 mg/kg) |
Nerolidol- III (300 mg/kg) |
|
Urea |
37.7 ± |
51.34 ± |
43.58 ± |
40.9 ± |
39.09 ± |
33.91 ± |
|
3.37 |
3.81 |
6.69* |
5.1** |
1.75** |
5.66** |
|
|
Total |
6.68 ± |
7.15 ± |
6.58 ± |
5.92 ± |
5.34 ± |
4.707 ± |
|
Protein |
0.88 |
0.75 |
0.401 |
0.68* |
0.79** |
0.65** |
|
Creatinine |
0.55 ± |
1.35 ± |
0.768 ± |
0.521 ± |
0.4815 ± |
0.438 ± |
|
0.037 |
0.804 |
0.355* |
0.039** |
0.071** |
0.069** |
Results values are the mean and standard deviation for a batch of six readings, asterisks signify statistically significant differences (*p˂0.05, **p˂0.01)
Group no. I: Normal control; Group no. II: Alloxan (120 mg/kg i.p); Group no. III: Vitamin C (250mg/kg/p.o.); Group no. IV: Nerolidol (100mg /kg p.o.); Group no. V: Nerolidol (200mg/kg by p.o.); Group no. VI: Nerolidol (300mg/kg).
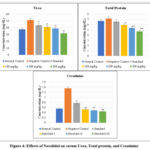 |
Figure 4: Effects of Nerolidol on serum Urea, Total protein, and Creatinine |
Oxidative Stress Markers and Non-Enzymatic Oxidants
Lipid Peroxidation (LPO)
In lipid peroxidation, oxygen-derived free radicals (hydroxyl and hydroperoxyl) cause oxidative damage to cell membrane lipids (mostly phospholipids) (Catalá and Daz, 2016). As The LPO value was determined to be 3.990.17 in the liver and 3.34 0.21 in the kidney in the control group. (Tables 4.29 and 4.30). Using a dose of 300 mg/kg, Nerolidol considerably lowered LPO levels in liver and kidney tissue (4.14±0.04 and 4.64±0.42) respectively, up to a dosage of 200 mg/kg, Nerolidol noticeably lowered LPO levels in liver and kidney (4.22±0.02 and 4.32±0.15) respectively. The levels of LPO in the liver (4.44± 0.24) and kidney (5.02±0.62) improved slightly after treatment with 100 mg/kg Nerolidol when compared to the group treated with Alloxan (13.35±1.28 and 12.93±1.80, liver and kidney respectively).
Table 6: Effect of administration of Nerolidol on the antioxidant status in the liver
|
Parameters |
Normal |
Negative control |
Standard (Ascorbic acid) |
Nerolidol-I (100 mg/kg) |
Nerolidol-II (200 mg/kg |
Nerolidol-III (300 |
|
Lipid peroxidation (MDA) (n moles/gm tissue) |
3.99±0.17 |
13.35±1.28 |
3.47±0.29** |
4.44±0.24** |
4.22±0.04** |
4.14±0.04** |
|
Reduced glutathione (U/mg protein) |
3.08±0.16 |
2.83±0.60 |
3.96±0.68** |
3.21±0.06** |
3.35±0.04** |
3.70±0.20** |
|
Catalase (U/mg protein) |
32.72±2.78 |
13.78±2.38 |
33.45±4.04** |
25.79±4.43** |
30.89±1.84** |
31.43±4.99** |
Values are given as Mean ± S.D. (n=6) (*p<0.05, **p<0.01), which is noticeably different from the negative control group.
Table 7: Effect of administration of Nerolidol on antioxidant status in the kidney.
|
Parameters |
Normal |
Negative control |
Standard (Ascorbic acid) |
Nerolidol-I (100 mg/kg) |
Nerolidol-II (200 mg/kg |
Nerolidol-III (300 |
|
Lipid peroxidation (MDA) (n moles/gm |
3.34±0.21 |
12.93±1.80 |
3.65±0.30** |
5.02±0.62** |
4.32±0.15** |
4.64±0.42** |
|
Reduced glutathione (U/mg protein) |
12.26±0.25 |
9.16±0.76 |
14.52±0.56** |
13.04±0.47** |
12.57±0.34** |
13.01±0.16** |
|
Catalase (U/mg protein) |
31.30±3.29 |
14.36±1.15 |
32.83±4.11** |
27.03±4.77** |
29.41±4.74** |
31.22±2.89** |
Values are given as Mean ± S.D. (n=6) (*p˂0.05 **p<0.01), noticeably different from the negative control group.
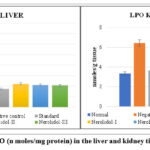 |
Figure 5: Levels of LPO (n moles/mg protein) in the liver and kidney tissue of various groups. |
Values are given as Mean ± S.D. (n=6) (*p˂0.05 **p<0.01), noticeably different from the negative control group.
(ONE-WAY ANOVA followed by Dunnett’s test).
Group no. I: Normal control; Group no. II: Alloxan (120 mg/kg i.p); Group no. III: Vitamin C (250mg/kg/p.o.); Group no. IV: Nerolidol (100mg /kg p.o.); Group no. V: Nerolidol (200mg/kg by p.o.); Group no. VI: Nerolidol (300mg/kg).
Reduced Glutathione (GSH)
GSH is a non-enzymatic antioxidant that removes hydrogen peroxide from the cell. It can function as a free radical scavenger by continually oxidizing and reducing.
As Alloxan was administered to rats, the levels of reduced glutathione in the toxicant group reduced significantly (*p˂0.05, **p ˂ 0.01), as opposed to that of the control group. In the control group, the liver’s GSH value was identified to be 3.080.16 and the kidney’s to be 12.260.25. (Tables 4.29 and 4.30).
At a dose of 300 mg/kg, Nerolidol had considerably higher GSH levels in liver and kidney tissue (3.70±0.20** and 13.01±0.16**) respectively, whereas, at a dosage of 200 mg/kg, Nerolidol noticeably raised GSH levels in liver and kidney (3.35±0.04** and 12.57±0.34**) respectively. The levels of GSH in the liver (3.21±0.06**) and kidney (13.04±0.47**) improved slightly after treatment with 100 mg/kg Nerolidol as opposed to that of the group treated with Alloxan (2.83±0.60 and 9.16±0.76, liver and kidney respectively).
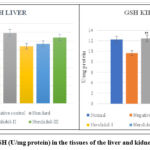 |
Figure 6: Levels of GSH (U/mg protein) in the tissues of the liver and kidney of different groups. |
Catalase activity
Catalases are found in the cell’s peroxisomes and mitochondria. a membrane-bound and soluble form A considerable number of peroxisomes are present within these hepatic cells, Kupffer cells are responsible for a high level of catalase activity. As Alloxan was administered to rats, the levels of reduced catalase in the toxicant group decreased noticeably (*p˂0.05, **p ˂ 0.01), in contrast to that of the control group. In the control group, the catalase value was identified to be 32.72±2.78 in the liver and 31.30±3.29 in the kidney (Tables 4.29 and 4.30). At a dosage of 300 mg/kg, Nerolidol considerably higher catalase levels in liver and kidney tissue (31.43±4.99** and 31.22±2.89**) respectively, whereas at a dosage of 200 mg/kg, Nerolidol noticeably raised catalase levels in liver and kidney (30.89±1.84** and 29.41±4.74**) respectively. The levels of catalase in the liver (25.79±4.43**) and kidney (27.03±4.77**) improved slightly after treatment with 100 mg/kg Nerolidol when compared to the group treated with Alloxan (13.78±2.38 and 14.36±1.15, liver and kidney respectively).
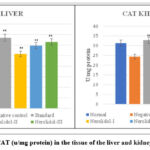 |
Figure 7: Levels of CAT (u/mg protein) in the tissue of the liver and kidney of different groups. |
Effects of Salicin on the Liver and Kidney Histopathology
Histopathology of Liver
 |
Figure 8: Haematoxylin and Eosin-stained photomicrographs of rat liver sections. |
Histopathological analysis of liver sections (H&E); Magnification X400
Animals in the group I normal control group displayed regular hepatocytes with normal cellular architecture and appropriate central vein structure, as well as no signs of degeneration or other histological abnormalities. the liver fragments from the diseased control group. In the alloxan-toxic rat, there was a loss of structural integrity as well as substantial damage to the central vein, hepatocytes, and neutrophil infiltration. Indicated with an arrow in the figure. However, Group III (standard) and Group VI show modest infiltration of inflammatory cells there is an absence of vacuoles and hepatocyte degeneration, and normal architecture is evident. Group IV and Group V exhibit moderate damage with mild infiltration and vacuolation. Nerolidol restored detrimental liver changes in a dose-dependent manner, much like conventional Vitamin C.
Histopathology of Kidney
 |
Figure 9: Haematoxylin and Eosin-stained photomicrographs of rat kidney sections. |
Kidney tissue sections underwent histopathological examination (H&E); 400x magnification. Group I (Normal control) showed normal histological architecture and absence of histological alteration; Group II (negative control; nephrotoxic effect of Alloxan showing marked degeneration in the lining of epithelium of all the tubules & also showing infiltration of inflammatory cells in between tubules; Indicated in the figure by an arrow. However, Group III (Standard) and Group VI (Nerolidol-III) showed mild infiltration and the absence of severe degeneration of nephrocytes or tubules.
Discussion
Hepatorenal insufficiency, a non-communicable condition, is the primary cause of mortality and morbidity on a global scale. As a result, researchers are very interested in herbal medicines that have hepatoprotective and nephroprotective properties. In recent years, scientists have employed medicinal herbs in animal studies to investigate their hepatoprotective properties. In order to determine the hepatoprotective and nephroprotective effects of Nerolidol on liver and kidney damage, we evaluated blood levels of AST and ALT activity, ALP, and LDH, which are enzyme indicators of hepatocellular injury, as well as urea, creatinine, and total protein levels. It is well known that prolonged exposure to Alloxan causes liver damage, which raises blood levels of functioning liver enzymes such as gamma-glutamyl transferase, aspartate transaminase, alanine transaminases, and alkaline phosphatases considerably (*p0.05, **p0.01). As a result, the most important method to identify liver dysfunction is testing these enzymes in the blood. In the current study, rats treated with Alloxan had greater blood levels of liver function enzymes than rats treated with a vehicle, suggesting that the hepatic cell membrane is altered as seen by the loss of enzymes from the cell across the membrane. Therefore, this research demonstrated that Alloxan damages liver cells, which allows functional characteristics to escape into extracellular fluids. In contrast, rats given Alloxan also had lower levels of these liver functioning enzymes, cholesterol, and triglycerides after receiving nerolidol therapy.
Additionally, a rise in serum urea and a decline in urine urea levels are linked to a rise in protein catabolism. It is well known that Alloxan prevents amino acids from being incorporated into proteins, raising serum urea levels. A multitude of factors, including dietary protein, catabolic state, and muscle mass, affect creatinine levels. The considerably (p 0.05) increased serum and decreased urine levels of creatinine are signs of decreased glomerular filtration brought on by the administration of Alloxan. Alloxan induces progressive tubular damage because its administration is particularly sensitive to the proximal tubules’ considerable reabsorptive activity, which leads to abnormalities. However, nerolidol medication stops renal deterioration and brings back-to-normal levels of serum urea, total protein, and creatinine. The effects listed above demonstrate Nerolidol’s nephroprotective properties.
Alloxan inhibits the activity of superoxide dismutase, possibly as a result of its reactive metabolites binding to the enzyme’s active site. The lower catalase activity in Alloxan-treated mice may be attributed to the increased generation of superoxide free radicals and the decreased accumulation of iron, an enzyme cofactor.
The significant (**p0.01, *p 0.05) decline in glutathione peroxidase activity in the group of rats receiving Alloxan alone may be due to insufficient elimination of peroxides, which led to outcomes that demonstrated an increase in lipid peroxidation. Reduced amounts of sulfhydryl groups in the rats from the negative control group demonstrate the establishment of the Alloxan-SH complex. As a result, glutathione reductase exhibits decreased enzyme activity. Rats given nerolidol did exhibit a notable (*p0.05, **p0.01) decrease in lipid peroxidation. Nerolidol, however, significantly increased the activities of many cellular antioxidants in the rats in the negative control group, which may be related to the drug’s capacity to scavenge free radicals. Rats given Alloxan experienced hepatocellular degeneration, sinusoidal dilatation, necrosis, inflammatory cell infiltration, and congestion, according to a histological examination. We observed focal necrotic areas with damaged hepatocytes and sinusoidal dilatation in rats given Alloxan. The use of nerolidol almost eliminated these pathological signs. Antioxidant nerolidol may help to preserve enzymes by trapping reactive oxygen species (ROS) and products of peroxidation. This idea is supported by the just-discovered antioxidant and antiradical properties of nerolidol in vitro. An investigational medicine called nerolidol may interact with the ROS that Alloxan produces and result in extremely harmful oxidants. Since nerolidol significantly protects against Alloxan, our findings suggest that it may be a useful source of cellular defense agents in liver tissues. Previous research supports our findings.
Conclusion
Owing to the paucity of particular clinical signs and biochemical and pathological alterations, drug-induced liver and kidney damage is frequently overlooked. Leading to a shortage of availability and several side effects associated with the use of synthetic drugs, such as hyperkalemia, gynecomastia, neurocognitive, fatigue, nausea, and others, researchers are working to formulate newer natural-source drugs that can safeguard disrupted function and even promote better kidney and liver architecture. Due to a scarcity of knowledge on a low-cost preventive measure for hepatorenal impairment, this study contends the mitigative impact of Nerolidol using biochemical and histological parameters as bases. As a consequence of hepatic xenobiotic metabolism, the administration of Alloxan resulted in an excessive quantity of ROS. These reactive forms then triggered lipid peroxidation of cellular and subcellular compartment membranal lipids, altering their integrity and ultimately affecting functionality. As a consequence of the toxicant group’s exposure to Alloxan, a significant increase in lipid peroxidation was seen in hepato-renal tissue. In the toxicant group, an imbalance in oxidant-antioxidant levels was identified, and this was thought to be a crucial cascade in Alloxan-induced hepato-renal damage. The medication Alloxan, when given intraperitoneally, can cause a significant imbalance in the oxidant-antioxidant ratio. As a result, the level of nonenzymatic antioxidant GSH has decreased. Alloxan exposure disrupted not only GSH, but also enzymatic antioxidants such as CAT, SOD, and LDH. Furthermore, the negative effects of Alloxan on hepato-renal tissues were corroborated by looking at hepatic and renal-specific markers in serum. An increased level of tissue-specific indicators in the current study shows tissue deprivation of functional ability, which could be caused by membrane permeability or damage-mediated leaking of these marker enzymes into the blood. The liver and kidney sections of Alloxan-treated rats uncovered considerable hepatic cellular damage and major tubular epithelial layer damage, respectively, in histological investigations. Moreover, Nerolidol administration restored the cellular histoarchitecture of the hepatic and renal tissues, which was consistent with biochemical analyses in the study animals.
Nerolidol treatment significantly reduced the severity of the histological alterations, enzymatic antioxidant status, renal and hepatic functional evaluations, and Alloxan-induced mice’s renal and hepatic dysfunction. Alloxan produces ROS in a cyclic redox process with the aid of intracellular thiols, primarily glutathione, and its reduction product, dialuric acid. In the final, iron-catalyzed chemical stage, dialuric acid passes through an autoxidation reaction that produces superoxide, hydrogen peroxide, and hydroxyl radicals. These hydroxyl radicals eventually lead to the death of beta cells. The strongest bioactive sesquiterpene alcohol, nerolidol, has been shown in prior studies to have antioxidant effects. The study was conducted as a result of the evidence, and it found that Nerolidol’s antioxidant capacity can be linked to its ameliorative effects in Alloxan-induced hepatotoxicity and nephrotoxicity. This study lays the framework for a more thorough assessment of Nerolidol’s hepato- and nephroprotective effectiveness through molecular analysis and research into the processes involved.
Acknowledgement
The authors are sincerely thankful to our respected principal Mr. Sanjay Kshirsagar Sir (MET’s BKC Institute of Pharmacy, Nashik) for his keen support and belief.
Conflict of Interest
The authors declare no conflict of interest.
Funding Sources
There is no funding in this article.
References
- Dagnaw, W. W. Assessment of priority non-communicable diseases and injuries (NCDI) interventions and human resourcing at selected health facilities in four regions of Ethiopia (Doctoral dissertation, Harvard Medical School), 2021.
- Shodehinde, S. A., & Oboh, G. Antioxidant properties of aqueous extracts of unripe Musa paradisiaca on sodium nitroprusside induced lipid peroxidation in rat pancreas in vitro. Asian pacific journal of tropical biomedicine, 2013; 3: 449-457.
CrossRef - Abdel Aziz, M. A., Badary, D. M., & Hussein, M. R. A. Renal damage following alloxan‐induced diabetes is associated with generation of reactive oxygen species, alterations of p53, TGF‐β1, and extracellular matrix metalloproteinases in rats. Cell Biology International, 2017; 41: 525-533.
CrossRef - Petrovska, B. B. Historical review of medicinal plants’ usage. Pharmacognosy reviews, 2012; 6: 1.
CrossRef - Bakkali, F., Averbeck, S., Averbeck, D., & Idaomar, M. Biological effects of essential oils–a review. Food and chemical toxicology, 2008; 46: 446-475.
CrossRef - Chan, W. K., Tan, L. T. H., Chan, K. G., Lee, L. H., & Goh, B. H. Nerolidol: a sesquiterpene alcohol with multi-faceted pharmacological and biological activities. Molecules, 2016; 21: 529.
CrossRef - Bartikova, H., Hanusova, V., Skalova, L., Ambroz, M., & Bousova, I. Antioxidant, pro-oxidant and other biological activities of sesquiterpenes. Current topics in medicinal chemistry, 2014; 14: 2478-2494.
CrossRef - Nogueira Neto, J. D., de Almeida, A. A. C., da Silva Oliveira, J., Dos Santos, P. S., de Sousa, D. P., & de Freitas, R. M. Antioxidant effects of nerolidol in mice hippocampus after open field test. Neurochemical Research, 2013; 38: 1861-1870.
CrossRef - Alam, M. N., Bristi, N. J., & Rafiquzzaman, M. Review on in vivo and in vitro methods evaluation of antioxidant activity. Saudi pharmaceutical journal, 2013; 21: 143-152.
CrossRef - Mohebbati, R., Shafei, M. N., Soukhtanloo, M., Roshan, N. M., Rad, A. K., Anaeigoudari, A., … & Beheshti, F. Adriamycin-induced oxidative stress is prevented by mixed hydro-alcoholic extract of Nigella sativa and Curcuma longa in rat kidney. Avicenna journal of phytomedicine, 2016; 6: 86.
- Mondal, S., Ghosh, D., Ganapaty, S., Chekuboyina, S. V. G., & Samal, M. Hepatoprotective activity of Macrothelypteris torresiana (Gaudich.) aerial parts against CCl4-induced hepatotoxicity in rodents and analysis of polyphenolic compounds by HPTLC. Journal of pharmaceutical analysis, 2017; 7: 181-189.
CrossRef - Mahmoodzadeh, Y., Mazani, M., & Rezagholizadeh, L. Hepatoprotective effect of methanolic Tanacetum parthenium extract on CCl4-induced liver damage in rats. Toxicology reports, 2017; 4: 455-462.
CrossRef
Abbreviations
ROS: Reactive Oxygen Species; GSH: Glutathione; GSSH: Oxidized Glutathione; NRL: Nerolidol; p.o.: Per Oral; i.p.: Intraperitoneal; DMSO: Dimethyl Sulfoxide; DPPH: 2,2-diphenylpicrylhydrazyl; SNP: Sodium Nitroprusside; PBS: Phosphate Buffer Solution; NO: Nitric Oxide; ALT: Alanine transaminase; AST: Aspartate aminotransferase; ALP: Alkaline phosphatase; LPO: Lipid Peroxidation; CAT: Catalase; MDA: Malonaldehyde; H&E: Haemtoxylin-eosin; SD: Standard Deviation; SGOT: Serum Glutamic-Oxaloacetic Transaminase; SGPT: Serum Glutamate Pyruvate Transaminase; ALP: Alkaline Phosphatase; LDH: Lactate Dehydrogenase; ANOVA: Analysis of Variance

