
Manuscript accepted on :10-08-2023
Published online on: 08-11-2023
Plagiarism Check: Yes
Reviewed by: Dr. Raja Azman Raja Awang
Second Review by: Dr. Abhishek Mukherjee and Dr. Nagham Aljamali
Final Approval by: Dr. Ayush Dogra
Vanshika Shrivastava1 , Naveen Sharma2*, Vikas Shrivastava1 and Kuldeep Dwivedi3
1Amity Institute of Biotechnology, Amity University Gwalior, Madhya Pradesh, India.
2Amity Institute of Pharmacy, Amity University Gwalior, Madhya Pradesh, India.
3Department of Environmental Science, Amity University, Gwalior, Madhya Pradesh, India.
Corresponding Author E-mail: naveenpcol@gmail.com
DOI : https://dx.doi.org/10.13005/bpj/2785
Abstract
This investigation aimed to evaluate in vitro antioxidant and antimicrobial activity from the methanolic extracts of tissue-cultured and field-grown parts of Nothopodytes nimmoniana. Antioxidant activity of the plant parts was measured by Di-phenyl-picryl-hydrazyl (DPPH) radical, reducing power, and hydrogen peroxide assays. Antimicrobial activity of plant extracts was evaluated by the well diffusion method and the MIC values determined against different pathogens such as Escherichia coli, Staphylococcus aureus, Klebsiella pneumonia, Pseudomonas aeruginosa, and Candida albicans. The DPPH assay showed overall strong antioxidant activities from the suspension culture and fruit callus culture with an IC50 value. Antimicrobial activity against 4 bacteria and 1 fungus was evaluated through the well-diffusion method and by determining the minimum inhibitory concentration (MIC). The suspension culture and fruit callus showed better antimicrobial activity than other plant parts. The zone of inhibition showed maximum values in suspension culture and fruit callus extract against Candida albicans. The study implies that suspension culture and fruit callus culture of plants showed the greatest values because of the enhancement of the alkaloid compound camptothecin and other compounds like phenolics and flavonoids.
Keywords
Antioxidant activity; Antimicrobial activity; Camptothecin; Nothapodytes nimmoniana
Download this article as:| Copy the following to cite this article: Shrivastava V, Sharma N, Shrivastava V, Dwivedi K. In-Vitro Assessment of Antioxidant and Antimicrobial Activity of Field Grown and Tissue Cultured Fruit Callus of Nothapodytes nimmoniana. Biomed Pharmacol J 2023;16(4). |
| Copy the following to cite this URL: Shrivastava V, Sharma N, Shrivastava V, Dwivedi K. In-Vitro Assessment of Antioxidant and Antimicrobial Activity of Field Grown and Tissue Cultured Fruit Callus of Nothapodytes nimmoniana. Biomed Pharmacol J 2023;16(4). Available from: https://bit.ly/3Sxe9qm |
Introduction
Plant parts and plant-derived drugs have been used in the health care system since ancient human civilization.1 Natural antioxidants are mostly found in plants, which also create a variety of secondary metabolites with antioxidant properties and potential medicinal applications. Several complicated illnesses are prevented and treated with medication formulations based on antioxidants.2 Due to oxidative stress, free radicals are produced, and vital vitamins and enzymes are depleted, leading to oxidative illnesses. Examples of free radicals include the hydroxyl radical, the nitric oxide radical, singlet oxygen, hydrogen peroxide, the superoxide anion radical, the hypochlorite radical, and other lipid peroxides. All these free radicals have the potential to interact with small molecules such as biological membranes, nucleic acids, proteins, enzymes, and other small molecules to cause cellular damage. Also, these free radicals play a role in a variety of medical conditions, including diabetes, cancer, neurological illnesses, and inflammatory diseases.3
Antioxidants protect the human system by cooperatively and synergistically scavenging free radicals. Vitamins, alkaloids, phenolic acids, flavonoids, terpenoids, tannins, lignins, stilbenes, coumarins, quinones, betalains, amines, and other metabolites with high antioxidant activity are only a few of the free radical-scavenging compounds found in plants.4 Therefore, intensive research is being carried out on natural antioxidants.
Natural products are still one of the main sources of new medication compounds today. They are derived from a wide range of animal species, plants, eukaryotic microbes, prokaryotic bacteria, and plants. The majority of antibacterial compounds that have been found so far come from microbial and plant sources. Because of this, finding new antibiotics is a particularly crucial goal.5 In vitro testing of extracts and pure medicines as possible antimicrobial agents has been done for antibacterial activity.
One of the most effective cancer treatments of the twenty-first century is camptothecin (CPT), a monoterpene indole alkaloid.6 DNA topoisomerase I is the biological target of camptothecin, and various analogues have been produced as possible therapeutics. The complete cure of lung, breast, uterine, and cervical cancers has been demonstrated to be possible with CPT.7 Currently, topotecan and irinotecan, two water-soluble camptothecin compounds, have been used to treat ovarian and colorectal cancer, respectively.8 Camptotheca acuminata, a Chinese deciduous tree, is where CPT was initially found. Nothapodytes nimmoniana (N. nimmoniana) was discovered to have the highest concentration of CPT (0.3% w/w).9
A little tree known as N. nimmoniana (J. Graham) Mabberly (Family Icacinaceae), formerly known as Nothapodytes foetida Sleumer and Mappia foetida Miers, is found in numerous areas of the Western Ghats of India, certain areas of Assam, the Himalayan foothills, Ceylon, Burma, and Thailand.10 When synthetic sources are not present, the exploitation of naturally occurring populations of N. nimmoniana from the Western Ghats, India, supplies the world’s demand for CPT (US$4045 million in 2002). As a consequence, the species population in the Western Ghats has decreased by almost 20% just in the past ten years.11, 12
Therefore, in the present study, we have prepared extracts from different plant parts like leaves, stem, stem bark, roots, and fruit, as well as in vitro parts like callus culture and suspension culture extracts of N. nimmoniana and evaluated them as antioxidants and antimicrobials.
Material and methods
Drugs and Chemicals
The chemicals used in the experiments were of analytical grade. Ascorbic acid, potassium ferricyanide, and ferric chloride were procured from Sigma Chemicals, Mumbai, India. DPPH was purchased from Hi Media Chemicals Ltd., Mumbai, India. Nutrient Agar Media, Nutrient Agar Broth, SDA and DMSO.
Collection of plant material
Plant material of Nothapodytes nimmoniana was collected from Mahabaleshwar, Pune (Maharashtra), in the month of February. Different plant parts like fruits, leaves, stems, roots, and stem bark were collected for this study. The plant parts (leaves and fruits) were identified by the National Institute of Science Communication and Information Resources, New Delhi, India. NISCAIR/RHMD/Consult/2021/3823-24-2.
Extraction of natural and in-vitro grown plant material:
The Nothopodytes nimmoniana plant material was collected, cleaned well, divided into distinct components (roots, leaves, stems, and fruits), and dried at 55ºC in an air dryer for 48 hours. Separate dried plant pieces were ground into powder using a mortar and pestle until they could pass through a 20-mesh filter and then packaged in plastic bags. In a conical flask, 2 g of the powdered substance were combined with 50 ml of methanol and kept in a probe sonicator (Labman Pro-250) for the extraction of biomarker compounds. The sonication process was maintained at three variable conditions: 40-50⁰C, 05:05 pulse for 15 min; 40-50⁰C, 02:02 pulse for 20 min; and 40- 50⁰C, 07:07 pulse for 10 min. Vacuum-dried extract was then diluted in methanol to create a variety of dilutions.
Quantitative assessment of phytoconstituents
Determination of total phenolic content
Total phenolic levels were determined using the colorimetric method13 and Tannic acid as standard, with a slight modification of the tannic acid concentration diluted into several concentrations of 10-100μg/ml. 1 mL of extract or each standard solution was added 1.5 ml of Folin-Ciocalteu reagent, and after 5 minutes added 1.5 mL of 75% NA2CO3 and distilled water up to 10 mL were added. The mixture was incubated for 30 minutes in dark conditions at room temperature. After incubation, the absorbance was measured using a UV-Vis spectrophotometer at 765 nm. The total phenolics of methanolic extract were calculated using the Tannic acid calibration curve. The results were expressed as Tannic acid equivalent (GAE) mg/g extract.
Determinations of flavonoid content
Total flavonoid levels determined by the colorimetric method13 using quercetin as a standard refer to the procedure that was modified for its quercetin concentration. standard quercetin dissolved with methanol diluted to concentrations of 25, 50, 75, and 100 μg/ml. 1 ml of each concentration of quercetin standard solution and extract, mixed with 4 mL of distilled water and 0.3 ml of 5% Na2NO3. After 5 minutes, 0.3 ml of 10% AlCl3 was added, and after 6 minutes of incubation, the samples were2 ml of NaOH (1 M) was also added to make up 10 ml vol. by volumetric flask by 2.4 ml distilled water. After incubation, the absorbance was measured using a UV-Vis spectrophotometer at 510 nm. Total flavonoids of the methanolic extract were calculated using the quercetin calibration curve. The results were expressed as quercetin equivalent (QE) mg/g extract.
Antioxidant studies
Determination of 1, 1-diphenyl-2-picryl hydrazyl (DPPH) radical scavenging activity
Based on the scavenging of stable DPPH free radicals, the antioxidant activity was determined.13 Various concentrations (100–500 μg/mL) of methanolic extracts were added to 1 mL of a 0.004% methanol solution of DPPH. 2 ml of methanol was added to give a final working volume. The blank sample consisted of 2ml ml of methanol, while the control consisted of 2 ml of methanolic DPPH only. The absorbance of samples, blank, and control was measured at 517 nm using a UV-Vis spectrophotometer (Labman). The mixed solution was incubated at room temperature in the dark for 30 minutes. The percent of DPPH scavenging activity was measured as
Scavenging activity (%) = (Absorbance of control sample – Absorbance of test sample) / (Absorbance of control) x 100
Determination of reducing power
From the stock solution, sample solutions comprising 10–100 g extracts were created. A 1 mL aliquot of the extract was combined with 1 mL of 1% (w/v) potassium ferricyanide and 1 mL of 0.2 M phosphate buffer with a pH of 6.6. The mixture was incubated at 50°C for 20 minutes. The mixture was centrifuged at 3000 rpm for 10 minutes after adding 1 mL of 10% w/v trichloroacetic acid. 1 mL of the supernatant was mixed with 0.2 mL of a 0.1% (w/v) ferric chloride (FeCl3) solution and 1 mL of distilled water. A UV-Vis spectrophotometer was used to measure the absorbance at 700 nm. The reducing power of ascorbic acid as a standard was also determined. The results were expressed as absorbance values. The increased absorbance of the reaction mixture indicates an increase in reducing power.14
Determination of H2O2 radical scavenging activity
The extract’s capacity to scavenge H2O2 was established. H2O2 solution (0.6 mL, 40 mM) was added to 100 μl (0.1 ml) of extract samples or standards (10–100 μg/mL). A solution of H2O2 was prepared in 50 mM PBS (pH 7.4) and diluted with 4 ml PB. The H2O2 concentration was determined spectrophotometrically at 230 nm. The absorbance was measured after 10 minutes against a blank (PBS without H2O2)and a control (PBS with H2O2).15 The antioxidant activity of the extracts was expressed as IC50.
Antimicrobial activity 16
Antibacterial activity of the plant extracts
Well diffusion technique
Preparation of test compound
The test extracts were evaluated for their antimicrobial properties, and amoxicillin was used as a standard test substance. During 24 hours at 37°C, all four pathogens were cultured in nutrient broth. Leaves, roots, stems, stem bark, fruits, and in vitro-grown callus and suspension culture extracts were prepared in DMSO solutions. The Drug concentration was prepared as 100mg/ml for the antimicrobial test.
Bacterial inoculum preparation
The antibacterial potency of each plant extract was evaluated using four bacterial strains: Escherichia coli (MTCC 40), Staphylococcus aureus (MTCC 740), Klebsiella pneumoniae (MTCC 109), and Pseudomonas aeruginosa (MTCC 741). The bacterial strains were provided by MTCC, the institute of microbial technology (IMTECH), Chandigarh. On Nutrient agar slants, each bacterial strain was subcultured for an entire night at 35–37°C. The bacterial inoculum was collected using 5 ml of sterile saline water, disciplined for absorbance at 580 µm using a spectrophotometer, and diluted to achieve a viable cell count of 107 CFU/ml.
Evaluation of antimicrobial activity
The nutrient agar, about 20 mL, was melted, cooled, and then placed into sterile petri plates. 100μl of all four pathogens were swabbed on Nutrient agar plates. In every agar plate, a 5-mm well was made. The well was filled with 100μg/ml test compound and Amoxicillin (0.1 mg/ml), and it was then incubated at 37oC for 24-48 hours. The zone of inhibition was observed surrounding the wells on the plates. Using the well diffusion technique, the most potent plant extracts were identified with high antibacterial activity at 10 mg/ml.
Determination of minimum inhibitory concentrations (MIC) and Minimum bactericidal concentration (MBC)
The MIC is defined as the minimum antimicrobial drug concentration that suppresses microbiological growth after 24 hours of incubation. The minimum concentrations of plant extract that showed invisible growth (from the inhibition zone of MIC plates) were collected as streaks, and they were then subcultured into nutrient agar plates. The plates were checked for bacterial growth corresponding to plant extract concentration after 24 hours of incubation at 35 °C. The minimum bactericidal concentration (MBC) was defined as the plant extract concentration that did not show any bacterial growth.
Antifungal activity
Well diffusion technique
Preparation of test compound
As fluconazole has the capacity to stop the growth of all infections, it was chosen as the standard test substance. A fungal strain of Candida Albicans was grown in Sabouraud dextrose broth at 28-30ºC for 3-5 days. The leaves, root, stem, stem bark, fruits, and in vitro-grown callus and suspension culture extracts were taken and prepared in DMSO solution. The Drug concentration was prepared at 100mg/ml for antifungal testing.
Fungal inoculum preparation
The antifungal potency was evaluated using the fungal strain Candida Albicans (MTCC 183). The fungal strain was provided by the Institute of Microbial Technology (IMTECH), Chandigarh. A fungal strain was subcultured overnight at 28-30ºC for 3-5 days on Sabouraud Dextrose agar plates.
Evaluation of antifungal activity
In sterile petri dishes, 20 mL of molten and cooled Sabouraud dextrose agar medium was added. On agar plates, a loopy fungus strain was swabbed. In every agar plate, a 5-mm well was made. Fluconazole and 100 g/ml test compounds were added to the well and incubated there for 3-5 days at 28–30 ºC. The plates were observed for an inhibitory zone surrounding the wells on the plates. Using the well diffusion technique, the most potent plant extracts that demonstrated significant antifungal activity at 100 mg/ml were identified.
Determination of minimum inhibitory concentrations (MIC) and Minimum fungicidal concentration (MFC)
MIC is defined as the minimum concentration of an antifungal dose that suppresses microbial growth after 3-5 days of incubation. Swabbed fungal inoculum was subcultured onto Sabouraud Dextrose agar plates using the lowest concentrations of plant extract, which established invisible growth (from the inhibition zone of MIC plates). For 3-5 days, the plates were incubated at 28–30 °C, then checked for fungus development. The minimum fungicidal concentration (MFC) was chosen as the concentration of plant extract on the freshly infected agar plates that did not show any fungal growth.
Results and Discussion
Determination of Phyto-constitute content:
Total Phenolic Content (TPC)
Tannic acid calibration curves as standard phenol compounds are presented in Figure. From the results of the Tannic acid calibration curve obtained a regression equation y = 0.0021x – 0.0331 with R² = 0.9336. The curves with a value of R2 close to one are linear.
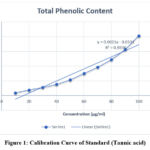 |
Figure 1: Calibration Curve of Standard (Tannic acid). |
The total phenolic content of plant extracts and tissue culture extracts was determined as TAE/g extract. The callus and suspension cultures showed the maximum phenolic content of 0.89mg/g and 0.93mg/g, respectively. Among plant parts, stem bark extract and fruit extract showed the maximum phenolic content of 0.52mg/ml and 0.68 mg/ml, respectively. Summarised in Table no. 1.
Table 1: Total phenolic content in different samples of N. nimmoniana.
|
Samples |
Total Phenolic Content (TPC) mg/g |
|
Leaves |
0.22 |
|
Roots |
0.32 |
|
Stem |
0.47 |
|
Stem Bark |
0.52 |
|
Fruits |
0.68 |
|
Callus |
0.89 |
|
Suspension culture |
0.93 |
Total Flavonoid content estimation
Quercetin calibration curves as standard phenol compounds are presented in Figure. From the results of the Quercetin calibration curve obtained a regression equation y = 0.013x + 0.0026 with R² = 0.9931.
 |
Figure 2: Calibration Curve of Standard (Quercetin) |
The total Flavonoid content of plant extracts and in vitro culture extracts was determined as QE/g extract. The callus and suspension cultures showed maximum flavonoid content of 0.76mg/g and 0.82 mg/g, respectively. Among the plant parts, roots extract and fruits extract have maximum phenolic content of 0.24mg/ml and 0.35 mg/ml, respectively.
Table 2: Total Flavonoid content in different samples of N. nimmoniana
|
Samples |
Total Flavonoid Content (TFC) mg/g |
|
Leaves |
0.09 |
|
Stem |
0.11 |
|
Stem bark |
0.16 |
|
Roots |
0.24 |
|
Fruits |
0.35 |
|
Callus |
0.76 |
|
Suspension Culture |
0.82 |
Antioxidant activity
Determination of DPPH radical scavenging activity
In the DPPH method, the absorbance was measured at 517 nm. A lower absorbance of the reaction mixture indicates higher free radical scavenging activity. Measuring the decrease in absorbance at 517 nm allows for a quantitative estimation of the reduction of DPPH radicals, widely used to evaluate the free radical scavenging effect of natural antioxidants. 17 The results of absorbance and % inhibition showed a decrease in concentration of DPPH radical due to the scavenging ability of the extract and standard ascorbic acid as a reference compound. The antioxidant capacity of N. nimmoniana is summarised in Table 3. The greatest capacity to scavenge the DPPH radical was confirmed for the extracts of suspension culture and fruit callus. It was significantly lowered in suspension culture (35.04%, 42.7%, 53.48%, 66.77%, 79.55%), and fruit callus extract (38.11%, 44.16%, 51.94%, 62.07%) at different concentrations. The IC50 values of suspension culture and fruit callus culture exhibited significant values of 43.09 mg/ml and 42.58 mg/ml, respectively. A hydrogen ion or an electron may be required for the stable free radical DPPH to change into a constant diamagnetic molecule. The methanolic solution of DPPH displays a strong absorbance at 517nm due to odd electrons.
Table 3: DPPH radical scavenging activity of extract of N. nimmoniana.
|
Samples |
Concentration (µg/ml)) and % Inhibition |
IC50 (µg/ml) |
||||
|
10 |
20 |
30 |
40 |
50 |
||
|
Std. Ascorbic acid |
51.06±0.03** |
64.78±0.03** |
72.01±0.02** |
89.54±0.02** |
91.57±0.01** |
40.02 |
|
Leaves |
15.84±0.01 |
18.14±0.03 |
20.36±0.04 |
22.8±0.01 |
24.27±0.02 |
47.52 |
|
Stem |
13.34±0.01 |
15.94±0.02 |
17.55±0.01 |
20.3±0.02 |
22.56±0.03 |
48.09 |
|
Stem bark |
8.01±0.01 |
12.07±0.03 |
14.41±0.02 |
16.57±0.03 |
18.62±0.02 |
47.52 |
|
Roots |
18.29±0.02 |
20.19±0.04 |
23.98±0.01 |
24.27±0.03 |
26.97±0.02 |
48.39 |
|
Fruits |
22.94±0.02 |
25.28±0.01 |
28.32±0.02 |
29.96±0.03 |
30.72±0.04 |
45.44 |
|
Fruit callus |
27.68±0.09 |
38.11±0.07* |
44.16±0.05* |
51.94±0.03** |
62.07±0.04** |
43.09** |
|
Suspension Culture |
35.04±0.04* |
42.7±0.01* |
53.48±0.08** |
66.77±0.03** |
79.55±0.02 ** |
42.58** |
Values are given as mean ± S.D. ** Significant at p˂0.01, * Significant at p˂0.05. p-value was calculated by comparing with control by ANOVA followed Dunnett’s test, values are expressed as ± SEM.
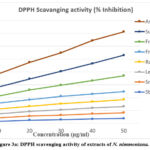 |
Figure 3a: DPPH scavenging activity of extracts of N. nimmoniana. |
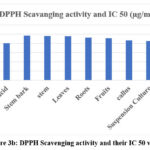 |
Figure 3b: DPPH Scavenging activity and their IC 50 values |
Determination of reducing power
A molecule’s potential antioxidant action may be strongly suggested by the reducing power of the chemical. When the Fe3+ ferricyanide complex was reduced to the ferrous form (Fe2+) during the reducing power assay, reductants (antioxidants) were present in the tested samples. The content of N. nimmoniana extracts in the reaction mixture was measured by measuring the absorbance at 740 nm, and this linearly increased. The absorbance gained with increasing concentration for both the standard ascorbic acid and sample extracts in the reducing power experiment. The reducing power was shown by absorbance in a concentration dependent manner. The suspension culture and fruit callus culture exhibited high reducing powers of 0.278, 0.392, 0.269, and 0.320 in 75µg/ml and 100 µg/ml concentrations, respectively. summarised in Table no. 4.
Table 4: Reducing power activity of methanolic extract of N. nimmoniana.
|
Extracts |
Concentration (µg/ml) and Absorbance |
||||
|
10 |
25 |
50 |
75 |
100 |
|
|
Std. Ascorbic acid |
0.097±0.01 |
0.137±0.03 |
0.243±0.07 |
0.349±0.04 |
0.471±0.02 |
|
Leaves |
0.06±0.07 |
0.108±0.01 |
0.116±0.02 |
0.254±0.02 |
0.259±0.03 |
|
stem |
0.022±0.03 |
0.103±0.06 |
0.165±0.05 |
0.213±0.01 |
0.262±0.07 |
|
Stem bark |
0.025±0.02 |
0.094±0.04 |
0.162±0.01 |
0.202±0.02 |
0.244±0.01 |
|
Roots |
0.035±0.05 |
0.103±0.04 |
0.221±0.01 |
0.262±0.02 |
0.263±0.00 |
|
Fruits |
0.038±0.01 |
0.065±0.03 |
0.126±0.06 |
0.134±0.04 |
0.243±0.05 |
|
Fruit callus |
0.067±0.02 |
0.093±0.07 |
0.126±0.03 |
0.269±0.01* |
0.320±0.04** |
|
Suspension Culture |
0.071±0.04 |
0.117±0.07 |
0.134±0.01 |
0.278±0.02* |
0.392±0.01** |
Values are given as mean ± S.D. (n=3) ** Significant at p˂0.01, * Significant at p˂0.05. p-value was calculated by comparing with control by ANOVA followed Dunnett’s test, values are expressed as ± SEM.
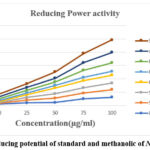 |
Figure 4: Reducing potential of standard and methanolic of N. nimmoniana |
Determination of H2O2 radical scavenging activity
The H2O2 radical itself is not extremely reactive, but it can occasionally be hazardous to cells because it causes the cell to produce the OH radical. The H2O2 radical was considerably scavenged by N. nimmoniana extracts in a concentration-dependent manner. The percentage inhibition of suspension culture and fruit callus culture extract significantly exhibited scavenging activity, respectively (42.27%, 50.14%, 60.5%), (43.18%, 58.76), as summarised in Table 5. The IC50 values of suspension culture and fruit callus culture extract both significantly exhibited 41.81 µg/ml and 43.19 µg/ml respectively.
Table 5: H2O2 radical scavenging activity of methanolic extract of N. nimmoniana.
|
Extracts |
Concentration (µg/ml) and % Inhibition |
IC 50 (µg/ml) |
||||
|
10 |
25 |
50 |
75 |
100 |
||
|
Std. Ascorbic acid |
38.33±0.02 |
45.1±0.04 |
52.95±0.00 |
62.89±0.03 |
66.26±0.05 |
40.26 |
|
Leaves |
6.71±0.07 |
11.69±0.04 |
17.62±0.01 |
26.93±0.05 |
32.79±0.07 |
49.64 |
|
Stem |
7.55±0.07 |
10.55±0.05 |
15.2±0.05 |
24.92±0.04 |
30.83±0.02 |
49.89 |
|
Stem bark |
15.93±0.07 |
29.05±0.01 |
34.92±0.01 |
40.94±0.03 |
51.59±0.03 |
48.85 |
|
Roots |
18.74±0.04 |
23.07±0.01 |
29.08±0.02 |
34.98±0.01 |
52.64±0.01 |
47.25 |
|
Fruits |
19.13±0.02 |
25.13±0.03 |
34.82±0.07 |
41.19±0.03 |
52.76±0.06 |
46.36 |
|
Fruit Callus |
26.29±0.04 |
34.16±0.03 |
36.96±0.05 |
43.18±0.05* |
58.76±0.01** |
43.19** |
|
Suspension Culture |
27.97±0.02 |
39.53±0.02 |
42.27±0.06* |
50.19±0.01* |
60.5±0.05** |
41.81** |
Values are given as mean ± S.D. (n=3).** Significant at p˂0.01, * Significant at p˂0.05. p-value was calculated by comparing with control by ANOVA followed Dunnett’s test, values are expressed as ± SEM.
 |
Figure 5: H2O2 radical scavenging of standard and the methanolic extracts of N. nimmoniana |
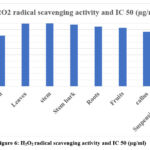 |
Figure 6: H2O2 radical scavenging activity and IC 50 (µg/ml). |
Antibacterial activity of the plant extracts18
Well Diffusion Technique
The antibacterial activity was determined against strains of Gram-negative bacteria such as E. coli, Staphylococcus aureus, Klebsiella pneumoniae, and Pseudomonas aeruginosa. The results revealed that all plant extracts exhibited various levels of potential efficiency in inhibiting the growth of bacteria. The zones of inhibition as observed on the plates revealed that suspension culture and Fruit callus culture showed significant inhibitory activity against E. coli and Staphylococcus aureus, moderate inhibitory activity against Pseudomonas aeruginosa, and the lowest inhibitory activity against Klebsiella pneumoniae. The standard Amoxicillin results in a 30 mm, 37 mm, 35 mm, and 17 mm zone of inhibition against E. coli, Staphylococcus aureus, Klebsiella pneumonia, and Pseudomonas aeruginosa. The suspension culture showed good inhibition zones of 27 mm, 30 mm, and 15 mm, whereas the fruit callus culture showed good inhibition zones of 25 mm, 28 mm, and 15mm against E. coli, Staphylococcus aureus, and Pseudomonas aeruginosa. Only fruit extracts showed a good inhibition zone of 28 mm against Klebsiella pneumonia, as shown in Table 6. (Figure 7-10)
Table 6: Zone of Inhibition: Using different part of Nothopodytes nimmoniana
|
Test Samples |
Zone of Inhibition in mm |
|||
|
E.coli |
S. aureus |
K. pneumonie |
P. aeruginosa |
|
|
Amoxicillin (Standard) |
30±0.0 |
37±0.0 |
35±0.0 |
17±0.0 |
|
Leaves |
21±0.0 |
14±0.0 |
23±0.0 |
10±0.0 |
|
Stem |
19±0.0 |
20±0.0 |
22±0.0 |
12±0.0 |
|
Stem bark |
18±0.0 |
17±0.0 |
20±0.0 |
11±0.0 |
|
Roots |
20±0.0 |
14±0.0 |
19±0.0 |
11±0.0 |
|
Fruits |
23±0.0 |
25±0.0 |
28±0.0 |
12±0.0 |
|
Fruit Callus |
25±0.0 |
28±0.0 |
22±0.0 |
14±0.0 |
|
Suspension Culture |
27±0.0 |
30±0.0 |
20±0.0 |
15±0.0 |
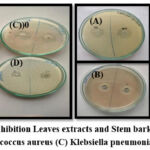 |
Figure 7: Zone of Inhibition Leaves extracts and Stem bark extracts against (A)E. coli (B) Staphylococcus aureus (C) Klebsiella pneumoniae (D) Pseudomonas |
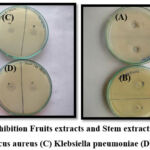 |
Figure 8: Zone of Inhibition Fruits extracts and Stem extracts against (A) E. coli (B) Staphylococcus aureus (C) Klebsiella pneumoniae (D) Pseudomonas. |
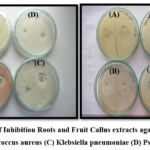 |
Figure 9: Zone of Inhibition Roots and Fruit Callus extracts against (A) E. coli. |
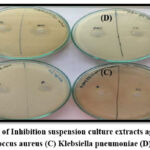 |
Figure 10: Zone of Inhibition suspension culture extracts against (A) E. coli (B) Staphylococcus aureus (C) Klebsiella pneumoniae (D) Pseudomonas |
Determination of Minimum inhibitory concentrations (MIC) and Minimum bactericidal concentration (MBC)
The standard and test sample concentrations for MIC were 0.1 mg/ml, 0.5 mg/ml, 1mg/ml, 2mg/ml, and 5mg/ml. The suspension culture sample shows the minimum inhibition concentration for E. coli (2 mg/ml), Staphylococcus aureus (0.1 mg/ml), Klebsiella (2 mg/ml), and Pseudomonas (0.1 mg/ml). The suspension culture sample also showed MBC for E. coli (5 mg/ml) and Staphylococcus aureus (5 mg/ml). The Fruit callus sample shows the minimum inhibition concentration for E. coli (2 mg/ml), Staphylococcus aureus (2 mg/ml), Klebsiella (2 mg/ml), and Pseudomonas (2 mg/ml). The Fruit callus sample also showed MBC for E. coli (5 mg/ml) and Staphylococcus aureus (5 mg/ml). Among the four bacterial strains, E. coli and Staphylococcus aureus showed great potency at low concentrations of the drug compound. Comparatively to suspension culture and fruit callus culture, the other plant extracts show the minimum inhibition concentration (MIC) for all four pathogens at high concentrations, as summarised in Table 7.
Table 7: Determination of Minimum inhibitory Concentration (MIC) and Minimum bactericidal concentration (MBC)
|
Test Samples |
MIC (mg/mL) |
MBC (mg/mL) |
||||||
|
E. coli |
S. aureus |
K. pneumonie |
P. aeruginosa |
E. coli |
S. aureus |
K. pneumonie |
P. aeruginosa |
|
|
Amoxicillin (Std) |
2mg/ml |
2mg/ml |
1mg/ml |
5mg/ml |
– |
– |
– |
– |
|
Leaves |
5mg/ml |
5mg/ml |
1mg/ml |
2mg/ml |
– |
– |
– |
– |
|
Stem |
5mg/ml |
5mg/ml |
5mg/ml |
2mg/ml |
– |
– |
– |
– |
|
Stem bark |
5mg/ml |
5mg/ml |
5mg/ml |
5mg/ml |
2mg/ml |
– |
– |
– |
|
Roots |
5mg/ml |
5mg/ml |
5mg/ml |
5mg/ml |
– |
– |
– |
– |
|
Fruits |
5mg/ml |
5mg/ml |
5mg/ml |
5mg/ml |
– |
– |
– |
– |
|
Fruit Callus |
2mg/ml |
1mg/ml |
2mg/ml |
2mg/ml |
5mg/ml |
2mg/ml |
– |
– |
|
Suspension Culture |
2mg/ml |
0.1mg/ml |
2mg/ml |
0.1mg/ml |
5mg/ml |
5mg/ml |
– |
– |
Antifungal activity
The standard Fluconazole resulted in a 27-mm zone of inhibition against Candida albicans. The suspension culture and Fruit callus exhibited good inhibition zones of 24 mm and 21 mm, whereas leaves, stem, stem bark, roots, and fruit extract showed inhibition zones of 10 mm, 18 mm, 14 mm, 19 mm, and 15mm. Summarised in table no. 8.
Table 8: Zone of Inhibition: Using different part of Nothopodytes nimmoniana.
|
Test Samples |
Zone of Inhibition in mm |
|
Candida Albicans |
|
|
Fluconazole (Standard) |
27±0.0 |
|
Leaves |
10±0.0 |
|
Stem |
18±0.0 |
|
Stem bark |
14±0.0 |
|
Roots |
19±0.0 |
|
Fruits |
15±0.0 |
|
Fruit Callus |
21±0.0 |
|
Suspension Culture |
24±0.0 |
The zones of inhibition as observed in the plates revealed that N. nimmoniana Fruit callus and suspension culture were shown good inhibitory activity against Candida albicans. Whereas stem and roots extracts showed activity against Candida albicans (Shown in Figure 11).
 |
Figure 11: Zone of Inhibition extracts of leaves (A), stem (B), roots (C), stem bark (D), fruits (E), fruit callus (F), and suspension culture (G), extracts against Candida Albicans |
Determination of Minimum inhibitory concentrations (MIC) and Minimum fungicidal concentration (MFC)
The standard and test sample concentrations for MIC were 0.5 mg/ml, 1 mg/ml, 2mg/ml, 4 mg/ml, and 6mg/ml. The minimum inhibitory concentration (MIC) for Candida albicans is shown in the leaf extract (6 mg/ml), stem extract (6 mg/ml), stem bark extract (6 mg/ml), root extract (4mg/ml, fruit extract (4mg/ml, callus sample (4 mg/ml), and suspension culture sample (2 mg/ml). The minimum fungicidal concentration (MFC) for Candida albicans shown in fruit extracts and fruit callus samples is 6 mg/ml. Table No. 9
Table 9: Determination of Minimum inhibitory Concentration (MIC) and Minimum fungicidal concentration (MFC).
|
Test Samples |
MIC (mg/ml) |
MFC (mg/ml) |
|
Candida Albicans |
||
|
Fluconazole (Standard) |
4mg/ml |
– |
|
Leaves |
6mg/ml |
– |
|
Stem |
6mg/ml |
– |
|
Stem bark |
6mg/ml |
– |
|
Roots |
4mg/ml |
– |
|
Fruits |
4mg/ml |
– |
|
Fruit Callus |
4mg/ml |
6 mg/ml. |
|
Suspension Culture |
2mg/ml |
6 mg/ml. |
Conclusion
In this research, it was observed that Nothopodytes nimmoniana methanolic extracts were obtained from the different plant parts and from in vitro callus and plant cell suspensions. All extracts showed antioxidant and antimicrobial activity, but fruit callus and suspension culture showed the highest antioxidant and antimicrobial properties. The reducing power of the suspension culture and fruit callus culture was enhanced with the increase in concentrations. The fruit callus culture and cell suspension culture showed higher concentrations of total phenolics and flavonoids, contributing to antioxidant and antimicrobial activity compared to normal extracts of other parts of the plant. This study indicates that the plant fruit and suspension cultures contain increased concentrations of compounds contributing to antioxidant and antimicrobial activity, which could be used for MDR bacterial and fungal infections and the development of useful natural compounds.
Acknowledgments
Authors would like to express our sincere gratitude and thanks to Amity University, Madhya Pradesh, Gwalior, for their constant support, guidance, and successfully completing this research work,
Conflict of Interest
there is no conflict of interest.
Funding Source:
Acknowledge MPCST, Bhopal, India, project number R&D/RP-2/2018-10/273, for giving financial support.
References
- Bhat S.G. Medicinal Plants and Its Pharmacological Values. Nat. Med. Plants., 2022.
CrossRef - Stankovic N, Krstev T.M, Zlatković B, Jovanovic V.S, Mitic V, Jovic J, Čomic L, Kocic B, Bernstein N. Antibacterial and Antioxidant Activity of Traditional Medicinal Plants from the Balkan Peninsula. Wageningen J. Life Sci.,2016; 78: 1573-5214.
CrossRef - Phaniendra A., Jestadi D. B, Periyasamy L. Free radicals: properties, sources, targets, and their implication in various diseases. Indian J. Clin. Biochem., 2015; 30(1):11-26.
CrossRef - Chandrappa V. M, Govindappa A, Kumar N.V, Channabasava R, Chandrasekar N and Umashankar T. Evaluation of in vitro antioxidant activity of ethanol extract of Carmona retusa (Vahl.) Masam.International J. Scienti. & Eng. Res., 2013; 4 (12): 861-872.
CrossRef - Balouiri M, Sadiki M, Ibnsouda S.K. Methods for in vitro evaluating antimicrobial activity: A review. J. Pharma. Analys., 2016; 6(2): 71-79.
- Sharma A, Chhikara S, Ghodekar S, Gawande R, Namdeo A et al. Camptothecin: Discovery and developments. Pharmacogn. Rev., 2008; 2(4): 219-227.
- Li F, Jiang T, Li Q, Ling X. Camptothecin (CPT) and its derivatives are known to target topoisomerase I (Top1) as their mechanism of action: Did we miss something in CPT analogue molecular targets for treating human disease such as cancer? Am. J. Cancer Res., 2017; 7(12): 2350-2394.
- Namdeo A.G, Sharma A, Fulzele D.P, and Mahadik K.R. Influence of Geographical and Climatic Conditions on Camptothecin Content of Nothapodytes nimmoniana. Rec. Nat. Prod., 2010. 4: 64-71.
- Hannah C., Priyakumari C., Joyce and Bhai, N. Prediction of high CPT yielding ecotypes of Nothapodytes nimmoniana (Graham) Mabb. in Western Ghats using Ecological Niche Modeling. 2018; 7.
CrossRef - Kamila P.K, Das P.K, Panda P.C. Nothapodytes nimmoniana (J. Graham) Mabb. (Icacinaceae) – an addition to the forest trees of Odisha, India. Ne. Bio., 2020; 11(2):63-66.
- Shrivastava V., Sharma N., Shrivastava V. and Sharma A. Review on Camptothecin Producing Medicinal Plant: Nothapodytes Nimmoniana. Biomed Pharmacol J. 2021; 14(4): 1799-1813.
CrossRef - Saravanan P. & Boopalan E. Occurrence of Camptothecin an Anticancer Drug From Ixora coccinea Linn. Int. J. Appli. Biol., 2011; 2: 30-34.
- Datkhile K, Patil S, Durgawale P, Patil M, Jagdale N and Deshmukh V. Studies on phytoconstituents, in vitro antioxidant, antibacterial, and cytotoxicity potential of Argemone mexicana Linn. (Family: Papaveraceae). J. Nat. Sci. Biol. Med. 2020; 11: 198-205.
- Benhamada N. and Idoui T. Enhancement of antioxidant properties of Triticum durum obtained by traditional spontaneous fermentation in underground silos. Acta Scienti. Biol. Sci., 2021; 43: 1-8.
CrossRef - Ali B.M., Boothapandi M, Nasar A.S. Nitric oxide, DPPH and hydrogen peroxide radical scavenging activity of TEMPO terminated polyurethane dendrimers: Data supporting antioxidant activity of Radical dendrimers.2020;28: 1-5.
CrossRef - Velmurugan K, Prabhu J, Kannan V.R, Nandhakumar R. Antimicrobial activity of different solvent extracts of the leaves and stem of Mappia foetida. Biotech. An Indian J., 2014; 9(4): 143-146.
- Kaur R, Kaur K, and Bansal M. Evaluation of DPPH Radical Scavenging Activity of 2-(Furan-2′-yl)-3-hydroxy-4H-chromen-4-one and Their Derivatives. Asian J. Chem., 2016; 28: 1921-1924.
CrossRef - Sumangala N., Jayaramu M., Prasad M. P. Studies on phytochemical constituents and antimicrobial activity of some endangered plant species collected from the Western Ghats. Indian J. Appli. Res.2019; 9(6): 38-42.

