
Manuscript accepted on :23-11-2023
Published online on: 29-12-2023
Plagiarism Check: Yes
Reviewed by: Dr. Karuna Priya Chitra karunakaran and Dr. Cherry Bansal
Second Review by: Dr. Nataliya Kitsera
Final Approval by: Dr. Patorn Piromchai
Hamid Farhane1 , Majida Motrane1, Fatima-Ezzahra Anaibar1, Aïcha Motrane2, Said Nassor Abeid1, Nourdin Harich1
1Laboratory of Anthropogenetics, Biotechnology and Health, Department of Biology, Faculty of Sciences, Chouaïb Doukkali University, El Jadida, Morocco.
2Diabetes Diagnosis and Treatment Center, Provincial Delegation of Public Health of El Jadida, El Jadida, Morocco.
Corresponding Author E-mail: harichanthropo@gmail.com
DOI : https://dx.doi.org/10.13005/bpj/2769
Abstract
Background: Metabolic syndrome (MetS) is a multifactorial disorder characterized by the aggregation of various metabolic disorders, including obesity, hyperglycemia, hypertriglyceridemia, hypoHDLemia and hypertension. In addition to environmental influences, genetic factors can play a major role in the development of MetS. Objective: The present bibliographic review aims to examine the contribution of candidate gene polymorphisms to MetS susceptibility in North African populations. Methods: A systematic review search was conducted to identify pertinent articles published on Embase, PubMed, and Web of Science from their inception to August 2, 2023 to obtain all reported genetic data related to MetS in North African populations. Results: According to the literature search strategy, 785 articles were initially obtained from the cited databases, and 15 more papers were found utilizing other sources. Following the filtering procedure, 25 papers totalising 3925 cases and 4431 controls were included, from which only 13 were eligible for meta-analysis. The meta-analysis results suggest that the genetic cumulative risk of developing MetS was substantially influenced by four polymorphisms, including APOA5 (rs3135506 and rs662799), APOC3 (rs5128), and FTO (rs9939609), while the vaspin polymorphism (rs2236242) was reported to play a protective role from MetS. Furthermore, no significant association was observed between rs1169288, rs2464196, and rs735396 polymorphisms at HNF1A gene and MetS development. A narrative synthesis of association studies revealed that a multitude of candidate genes is associated with MetS components. In all included studies, 14 polymorphisms were linked to obesity, and 13 polymorphisms were associated with hyperglycemia. The association of hypertension with polymorphisms represents the lowest number, with only seven polymorphisms associated with this MetS component. In the other hand, studies about MetS in North Africa considering the genetic association of candidate genes with dyslipidemia component represents the highest number with 20 polymorphisms in approximately 14 genes. Conclusion: The present meta-analysis suggests that four polymorphisms, namely rs3135506 and rs662799 at APOA5 gene, rs5128 at APOC3 and rs9939609 at FTO, contributed significantly to the MetS risk susceptibility, via their association with some MetS components as dyslipidemia, hyperglycemia, obesity, and hypertension. Nevertheless, we can state that genetic association and genetic susceptibility studies to MetS in North African populations are still lacking, requiring additional well-designed epidemiogenetic studies.
Keywords
Association; Genetic Polymorphism; Metabolic Syndrome; North Africa
Download this article as:| Copy the following to cite this article: Farhane H, Motrane M, Anaibar F. F, Motrane A, Abeid S. N, Harich N. Genetic Polymorphisms Associated with Metabolic Syndrome in North Africa: Systematic Review and Meta-Analysis. Biomed Pharmacol J 2023;16(4). |
| Copy the following to cite this URL: Farhane H, Motrane M, Anaibar F. F, Motrane A, Abeid S. N, Harich N. Genetic Polymorphisms Associated with Metabolic Syndrome in North Africa: Systematic Review and Meta-Analysis. Biomed Pharmacol J 2023;16(4). Available from: https://bit.ly/3NOfV39 |
Introduction
Metabolic syndrome (MetS) is defined by the presence in a same patient of a set of health disorders having a lipid and/or a carbohydrate leading to a weight excess and an increased risk of developing cardiovascular diseases and/or other disorders 1,2. It is now accepted that the main MetS components are : insulin resistance, abdominal obesity, dyslipidemia, and hypertension 3 and they are population-dependent. The MetS constitute nowadays a complex disorder that represents a global health problem with a prevalence varying between 10 and 40% according to population 4, which seems to be mainly influenced by obesity and a sedentary lifestyle as behavioral criteria 5. The latter can be considered as the inevitable consequences of upheavals in lifestyles (following demographic and dietary transitions) of human populations throughout the world, particularly those in industrialized and developing countries 4.
In addition to constituting a real socio-economic burden on health systems, the complications that patients affected by MetS can develop have also a very negative impact on their life quality by increasing the risk of comorbidities and mortality. Statistics around the world make it possible to distinguish a very significant variability in the prevalence of MetS, sometimes even between the two sexes. In North Africa, according to the studies available, the prevalence of MetS is also variable [8.6–55%] 5,6,15–19,7–14, generally more common in women than in men, and with a higher incidence among illiterates and married subjects 5,7,15,17–19.
In addition to differences in lifestyle and habits, the inter-population variability observed for the prevalence of MetS would likely be due to the genetic factor mainly in its pathophysiology 20, which could influence its development in several ways. Indeed, each of the key elements of MetS -abdominal obesity, dyslipidemia, hyperglycemia, and arterial hypertension- has its own genetic basis, for which candidate genes have been identified, of which certain alleles or allelic combinations may lead to a greater predisposition to the development of MetS. The analysis of genetic factors should make it possible to better understand the pathophysiology of MetS and to better guide the diagnosis towards a specific management adapted to each population. In this context, this systematic review aimed to examine the genetic contribution of candidate gene polymorphisms to MetS susceptibility among populations and ethnic groups in the North African region.
Materials and Methods
This meta-analysis was conducted in accordance with the QUOROM guidelines21. The procedures adhered to the Meta-analysis on Genetic Association Studies Checklist and the PRISMA 2009 Statement Guidelines 22.
Research Strategy
Systematic literature research was performed to identify pertinent articles published on Embase, PubMed, and the Web of Science. The keywords used were: (“gene polymorphism” or “single nucleotide polymorphism” or “SNP” or “gene mutation” or “gene variants”) paired with (“metabolic syndrome” or “syndrome X” or “MetS”) and (“Moroccan population” or “Morocco” or “Algerian population” or “Algeria” or “Tunisian population” or “Tunisia” or “Libyan population” or “Libya” or “Egyptian population” or “Egypt” or “North Africa”). Additionally, we retrieved the references cited in these publications for consultation and potential research. The research was restricted to articles published in English and we considered publications available until August 2, 2023.
Study selection criteria and exclusion criteria
We included articles that had MetS as an outcome and met the following criteria : published in English; constituted original research involving humans; and tested the primary effects of polymorphisms. All existing MetS definitions were eligible as study outcomes. Included polymorphisms were qualified for incorporation in meta-analyses if performed for SNPs with at least two eligible studies available in North African populations.
For inclusion into our meta-analysis, studies must satisfy the following inclusion criteria : 1) they should have investigated the relationship between the polymorphisms and MetS in North African populations; 2) they must be case-control or cohort-designed; 3) studies must provide enough data in control and case groups to calculate an odds ratio (OR) and 95% confidence interval (CI); and 4) About duplicate studies, we selected the one with the largest number of samples and/or the latest publication date.
The exclusion criteria encompassed 1) meta-analyses, reviews article, , letters, case reports, and conference abstracts; 2) studies that lacked complete data necessary to determine genotype numbers in controls and cases for ORs and CI calculations; and 3) studies that not considered humans..
Data extraction and quality assessment
The extraction of data was done by two authors independently and any disagreement was resolved through discussion and consensus. The informations collected from the publications: the first author’s name, publication year , country of origin, MetS definition, sample, genotype and allele distributions in both case and control groups, and the p-value assessing Hardy-Weinberg equilibrium (HWE) in control group. For the quality assessment of every study, we used the Newcastle-Ottawa quality assessment scale (NOS).
Statistical analysis
We computed the pooled OR and their corresponding 95% CI to evaluate the strength of the association between the polymorphisms and MetS. Combined ORs and 95% CIs were determined under four genetic models: the allele model (a vs. A), dominant genetic model (aa + Aa vs. AA), recessive genetic model (aa vs. Aa + AA), and additive genetic model (Aa vs. AA+aa). (Note: a and A, represent the minor and major alleles of the polymorphism, respectively). We examined the HWE in the control groups using the χ2 test, and assessed heterogeneity among the studies included in this meta-analysis using χ2 based Q-tests and I-square (I2) tests. In the absence heterogeneity (p ≥ 0.05), we applied a fixed-effect model; otherwise, a random-effect model was used. We conducted a sensitivity analysis to gauge the impact of each study on the combined ORs and 95% CI. All statistical analyses were carried out using RevMan V.5.1 (The Cochrane Collaboration).
Results
Study characteristics
According to the literature search strategy outlined previously, 785 papers were initially obtained in the PubMed, Embase, and Web of Science databases, and 15 additional articles were obtained using other sources. The sifting process is represented in Figure 1. Briefly, 390 records were eliminated due to duplicates; 337 articles were excluded after reviewing their titles and abstracts; and 53 articles with full text were collected for further assessment of eligibility. At last, 29 were excluded for the following reasons: Eleven studies had insufficient data for the calculation of OR and 95% CI; tree studies were meta-analyses; tow study had repeated data; three studies did not include healthy controls; six studies had no full-text articles; and three studies looked at other diseases. Finally, 25 studies whose publication dates ranged from 2011 to 2022, summing 3925 cases and 4431 controls, were retained in our study; according to the origin of the samples, the Moroccans were the subject of four studies, the Algerians of a single study, the Tunisians of nine, and the Egyptians of eleven studies (we note that no study has yet been carried out on the Libyan population) 23,24,33–42,25,43,26–32. Three different definitions were applied for the MetS diagnosis : sixteen studies adopted the IDF 2005 definition 3, seven studies diagnosed MetS using the NCEP-ATP III definition 44, and two studies recruited its subjects using the Harmonized definition 1. Two different types of genotyping methods were performed: eleven polymorphisms were analyzed using restriction fragment length polymorphism (RFLP), and fourteen polymorphisms were genotyped using real-time PCR.
Meta-analyses were performed for SNPs with at least two eligible studies available, resulting in the inclusion of 13 studies 24,25,42,43,45,27–29,32,36–39 that considered nine SNPs located in six genes (APOA5, APOC3, APOE, FTO, Vaspin, HNF1A).
Meta-analysis
Firstly, we will elucidate the association between MetS and genes that possess sufficient data for meta-analyses. Secondly, we will present a narrative review of the remaining SNP and MetS associations. An overview of all the studied genes and the pathways in which they are involved are depicted in Table 3. Detailed information on all studies integrated in the meta-analysis and the genotype frequencies extracted from each are available in Table 1.
APOA5
The APOA5 gene is mapped to chromosome 11q23.3 which forms a cluster with three other apolipoprotein genes (APOA1/C3/A4/A5). It consists of four exons and encodes a protein composed of 366 amino acids. The APOA5 plays a role in reducing plasma TG levels by stimulating TG hydrolysis through the activation of lipoprotein lipase (LPL) and by inhibiting the production of VLDL 46. Five polymorphisms of the APOA5 gene were studied in North African populations (rs3135506, rs662799, rs2075291, rs2266788 and rs651821), but only two of them (rs3135506 and rs662799) were considered in our meta-analysis.
The rs3135506 is a polymorphic transition also called c.56C>G ; data from two studies39,45 totalizing 464 cases and 391 controls were included. Heterogeneity was not statistically significant, leading to the use of fixed models for data synthesis. This polymorphism showed an association with MetS in two genetic models (allelic and dominant): the G allele of c.56C>G polymorphism increased the MetS risk by 39% (OR = 1.39; 95% CI [1.06-1.84]; Z = 2.35; p = 0.02), and the dominant model CG+GG vs CC (OR = 1.43; 95% CI [1.04-1.96]; Z = 2.23; p = 0.03). For rs662799 polymorphism, called also T1131C, the data included in the meta-analysis correspond to three studies 38,39,42. Overall, three genetic models showed a significant association with an increased risk of developing MetS: the allelic model (T vs. C); OR = 2.25; 95% CI [1.42-3.57]; Z = 3.44; p = 0.0006; the dominant model (TC+CC vs. TT); OR = 3.05; 95% CI [1.57–5.90], Z = 3.31, p = 0.0009; and the additive model (TC vs. TT+CC); OR = 2.87; 95% CI [1.61–5.14], Z = 3.55, p = 0.0004 (Table 2). In the analysis of these three genetic models, a random-effect model was used due to the presence of statistically significant heterogeneity among studies.
However, the other polymorphisms of the APOA5 gene does not respect the inclusion criteria, we note that only the rs651821 polymorphism was associated with MetS in the Tunisian population 45 (Table 3).
APOC3
APOCIII, is a protein consisting of 79 amino acids, synthesized by both the liver and intestine, and it is an important marker of TG-rich lipoprotein levels. the APOC3 gene overexpression results in higher TG levels 47. The APOC3 gene codes for APOCIII, and several polymorphic sites were detected inside and around the APOC3 gene. The most studied was the rs5128 polymorphism, resulting from the substitution of cytosine by guanine at nucleotide 3238C>G (rs5128) at the 3’UTR region of exon 4 34.
Two studies carried out in the Moroccan population 34,36 were included in our meta-analysis. The heterogeneity was not statistically significant, so fixed models were used when synthesizing the results. This polymorphism is associated with the MetS in all genetic models except the recessive one. The G allele of the 3238C>G multiplies the risk of MetS by 2.63 times : OR = 2.63, 95% CI [1.58-4.36], Z = 3.75, p = 0.0002 for the dominant model (CG+GG vs CC): OR =3.10, 95% CI [1.79-5.39], Z =4.02, P < 0.0001, and for the additive model (CG vs. CC+GG): OR = 3.25, 95% CI [1.83-5.79], Z = 4, P < 0.0001 (Table 2).
FTO
The FTO gene located in the 16q12.2 chromosomal region is associated with fat mass and obesity, and plays an essential role in the energy balance system 48. Three polymorphisms have been studied in North African populations (rs9939609, rs1421085, and rs8057044), from which only the rs9939609 polymorphism was included in our meta-analysis. Random-effects models were applied in the recessive genetics model because the heterogeneity between studies was statistically significant; when synthesizing the results of the other genetic models, the heterogeneity was not statistically significant, and therefore fixed models were used. Thus, this polymorphism has been shown to be associated with MetS in the three genetic models (allelic, dominant, and additive). The A allele of the rs9939609 polymorphism increased the risk of MetS, (T vs. A) OR = 1.30 (95%CI= [1.06-1.58]), Z = 2.54, p = 0.01; for the dominant model (TA+AA vs. TT) OR = 1.52 (95% CI= [1.14-2.02]), Z = 2.87, p = 0.004, finally for the additive model (TA vs. TT+AA) OR = 1.33 (95% CI= [1.01-1.76]), Z = 2.05, p = 0.04 (Table 2). The study of Elouej et al. (2016) revealed an association of the rs1421085 polymorphism with the MetS, whereas no association was found between the rs8057044 polymorphism and the MetS 49 (Table 3).
Vaspin
Vaspin is an adipocytokine derived from visceral adipose tissue, member of serine protease inhibitors family 50. It is known for its potential insulin-sensitizing effects 51. Clinical studies into the regulation of human vaspin have demonstrated a positive association between serum levels and insulin resistance. Furthermore, it has been observed that these levels decrease following a reduction in weight and/or in food intake 52. A single polymorphism (rs2236242) has been studied in North African populations. Our meta-analysis included two studies done in the Egyptian population in all every the two samples of 200 cases and 200 controls 27,43. The absence of statistically significant heterogeneity led to utilization of fixed models for data synthesis. This polymorphism was shown to be associated with the MetS and appeared to play a protective role in three genetic models (allelic, dominant, and recessive) : for allelic model (T vs. A): OR = 0.61 (95% CI= [0.45-0.82]), Z = 3.22, p = 0.001; for dominant model (TA+AA vs. TT): OR = 0.48, (95% CI= [0.32-0.73]), Z = 3.43, p = 0.0006, and for recessive model (TA vs. TT+AA): OR = 0.60, (95% CI= [0.40-0.90]), Z = 2.47, p = 0.01 (Table 2).
APOE
The APOE gene located at locus 19q13.32 codes for a protein that have an important role in clearing chylomicron remnants and VLDL from plasma. Only one polymorphism (rs4420638) was included in our meta-analysis 25,35. Random-effects models were used in all four genetic models because the heterogeneity between studies was statistically significant. In all genetic models rs4420638 was not associated with MetS.: (A vs. G) OR = 0.92, 95% CI [0.68–1.26], Z = 0.51, p = 0.61; (AG+GG vs. AA) OR = 0.90, 95% CI [0.64–1.27], Z = 0.59, p = 0.55; (GG vs. AA+AG) OR = 1.06, (95% CI [0.36-3.10]), Z = 0.11, p = 0.91; (AG vs. AA+GG) OR = 0.89, (95% CI [0.63–1.27]), Z = 0.65,p = 0.52; (Table 2). In addition, another study25 did not show any association of the three epsilons polymorphisms and also rs439401 with MetS (Table 3).
HNF1A
HNF1A gene is located on chromosome 12q24.2 and codes for hepatocyte nuclear factor 1-alpha 53,54. This protein has a crucial role in regulating gene expression related to the development and function of various organs, notably the liver 24. HNF1A is mainly expressed in the liver, as well as in the digestive tract, pancreas, and kidneys. Its key function extends to the regulation of several genes involved in metabolism, glucose and lipid transport , as well as in the blood coagulation process 32.
In our study, we identified two studies investigating the relationship of three HNF1A polymorphisms (rs1169288, rs2464196, and rs735396) with MetS in North African populations 24,32. The results of our meta-analysis indicated that no significant association was observed among the three HNF1A polymorphisms studied and the MetS risk , with the exception of rs1169288 polymorphism who showed a significant association with the MetS development OR = 1.41; 95% IC [1.06-1.86]; Z=2.40; p=0.02, at the additive model (AC vs AA+CC) only (Table2). The p-value did not indicate any significant heterogeneity between the results of the two studies for this polymorphism, so we have adopted the fixed-effect approach.
Narrative review: Polymorphisms associated with MetS and its components
In this narrative review, we have gathered all the polymorphisms studied in different North Africa populations. In addition to the studies recruited in the meta-analysis, we have included studies that have considered SNPs that were not eligible for meta-analysis (since they were studied in only research project) and others having studied the association between SNPs and independent MetS component.
Polymorphisms associated with obesity
The genetic component of obesity is relatively moderate, at 24.56% for obesity and/or abdominal obesity, according to studies (Figure 2). Association studies that have been performed have revealed a multitude of candidate genes to be associated with related to obesity traits. In the set of studies included in our review, 11 candidate genes with 14 different polymorphisms were associated with obesity and/or abdominal obesity. Studies considering genetic association with obesity among North African countries, have not considered the same candidates genes. Indeed, in the Moroccan population, two candidate genes, APOA5 (rs662799 and rs2266788) 39 and ADCY5 (rs11708067) 34, were positively associated. In Tunisians, four others candidate genes, ZNF664 (rs12310367) 35, LEP (rs7799039 and rs1137101) 55, and RETN (420C/G)41, HNF1A (rs2464196 and rs735396) 31, have shown an association. In Egyptians, five genes, Vaspin (rs2236242) 27, CD36 (rs1761667) 23, Chemerin (rs17173608) 29, ESR1 (rs2234693) 56, and TNF (rs1800629) 26, have been associated (Table 3).
Polymorphisms associated with hyperglycemia
Hyperglycemia has a genetic component of 22.81%, with 10 candidate genes and 12 polymorphisms. In the present study, the candidate gene approach allowed the unequivocal identification of common genetic variants associated with hyperglycemia (Figure 2). These polymorphisms are located on the genes : APOA5 (rs3135506, rs662799) 38,45, APOC3 (rs5128) 36, FTO (rs9939609)49, Vaspin (rs2236242) 27, and CD36 (rs1761667) 23, Chemerin (rs17173608) 29, ESR1 (rs2234693) 56, HNF1A (rs1169288) 24, PPARy2 (Pro12Ala and C161T) 31, and LEP (rs1137101) 55; it is important to emphasize that some polymorphisms are associated with both MetS and hyperglycemia and some are not (Table 3).
Polymorphisms associated with hypertension
Hypertension have between the other components of MetS the weakest genetic component (13.73%): 7 genes with 7 polymorphisms (Figure 2). Two polymorphisms showed an association with hypertension in the Moroccan population: APOA5 (rs662799) 39 and HNF1A (rs1169288) 24, one in Algerian APOE (rs439401) 25, and three in Egyptian Vaspin (rs2236242), Chemerin (rs17173608) 27, CD36 (rs1761667) 23, and ESR1 (rs2234693) 56 (Table 3).
Polymorphisms associated with dyslipidemia
Between all the MetS components, dyslipidemia has the strong genetic component (35.09 %) (Figure 2). Studies carried out in North Africa with MetS found a high number of candidate genes associated with dyslipidemia, around 14 genes with 20 polymorphisms (Table 3).
Polymorphisms associated with MetS
In this narrative review, we identified 19 candidate genes that have shown a relationship with MetS (Table 3). From this list of 19 genes, a total of 23 polymorphisms (representing 47.37% of the total polymorphisms analyzed) have presented an association with MetS in North African populations (Figure 2).
Indeed, we found some diversity in polymorphisms associated with MetS between North African populations. It is possible for a polymorphism to be associated to MetS in one population while it show no association in another. Furthermore, although these genes correlate with various MetS components, they do not appear to be linked to the MetS development perhaps because of the definition used in the studies (Table 3).
Evidence for pleiotropic genetic effects on MetS-related traits
When studying the relationship between of gene polymorphisms with the MetS components , it was possible to highlight different pleiotropic combinations of traits. Polymorphisms that influence multiple phenotypes can be said to have pleiotropic effects, although the effect may not be directly on the MetS. Genes that impact multiple results can be highly desirable targets for intervention and can help identify connection points between different pathways. Indeed, there are examples of individual polymorphisms that have pleiotropic effects on the suite of MetS traits. According to our review, 21.57% of the polymorphisms studied affect both components (hyperglycemia and dyslipidemia), and 15.69% of the polymorphisms had an association at the same time with obesity and dyslipidemia. The percentage of other combinations is presented in figure 3.
 |
Table 1: Gene polymorphisms characteristics, genotype and allelic distributions in MetS cases and Controls |
Table 2: Summary of the combined data used in the meta-analysis.
|
Polymorphisme |
Genetic Model |
OR (95 CI) |
Z |
P |
Phet |
I2 (%) |
Model |
|
APOA5 (rs3135506) |
C vs G |
1.39 [1.06-1.84] |
2.35 |
0.02 |
0.13 |
56 |
Fixed |
|
|
CG+GG vs CC |
1.43 [1.04-1.96] |
2.23 |
0.03 |
0.19 |
43 |
Fixed |
|
|
GG vs CC+CG |
1.63 [0.72-3.67] |
1.17 |
0.24 |
0.23 |
29 |
Fixed |
|
|
CG vs CC+GG |
1.35 [0.97-1.87] |
1.81 |
0.07 |
0.53 |
0 |
Fixed |
|
APOA5 (rs662799) |
T vs C |
2.25 [1.42-3.57] |
3.44 |
0.0006 |
0.01 |
77 |
Random |
|
|
TC+CC vs TT |
3.05 [1.57-5.90] |
3.31 |
0.0009 |
0.002 |
84 |
Random |
|
|
CC vs TT+TC |
1.69 [0.90-3.19] |
1.64 |
0.1 |
0.07 |
63 |
Fixed |
|
|
TC vs TT+CC |
2.87 [1.61-5.14] |
3.55 |
0.0004 |
0.01 |
78 |
Random |
|
APOC3 (rs5128) |
C vs G |
2.63 [1.58-4.36] |
3.75 |
0.0002 |
0.6 |
0 |
Fixed |
|
|
CG+GG vs CC |
3.10 [1.79-5.39] |
4.02 |
P < 0.0001 |
0.54 |
0 |
Fixed |
|
|
GG vs CC+CG |
1.33 [0.25-6.98] |
0.34 |
0.73 |
0.9 |
0 |
Fixed |
|
|
CG vs CC+GG |
3.25 [1.83-5.79] |
4 |
P < 0.0001 |
0.49 |
0 |
Fixed |
|
APOE (rs4420638) |
A vs G |
0.92 [0.68-1.26] |
0.51 |
0.61 |
0.46 |
0 |
Fixed |
|
|
AG+GG vs AA |
0.90 [0.64-1.27] |
0.59 |
0.55 |
0.62 |
0 |
Fixed |
|
|
GG vs AA+AG |
1.06 [0.36-3.10] |
0.11 |
0.91 |
0.3 |
7 |
Fixed |
|
|
AG vs AA+GG |
0.89 [0.63-1.27] |
0.65 |
0.52 |
0.86 |
0 |
Fixed |
|
FTO (rs9939609) |
T vs A |
1.30 [1.06-1.58] |
2.54 |
0.01 |
0.09 |
64 |
Fixed |
|
|
TA+AA vs TT |
1.52 [1.14-2.02] |
2.87 |
0.004 |
0.34 |
0 |
Fixed |
|
|
AA vs TT+TA |
1.58 [0.53-4.70] |
0.82 |
0.41 |
0.03 |
79 |
Random |
|
|
TA vs TT+AA |
1.33 [1.01-1.76] |
2.05 |
0.04 |
0.49 |
0 |
Fixed |
|
Vaspin (rs2236242) |
T vs A |
0.61 [0.45-0.82] |
3.22 |
0.001 |
0.33 |
0 |
Fixed |
|
|
TA+AA vs TT |
0.48 [0.32-0.73] |
3.43 |
0.0006 |
0.58 |
0 |
Fixed |
|
|
AA vs TT+TA |
0.61 [0.31-1.18] |
1.48 |
0.14 |
0.78 |
0 |
Fixed |
|
|
TA vs TT+AA |
0.60 [0.40-0.90] |
2.47 |
0.01 |
0.33 |
0 |
Fixed |
|
HNF1A (rs1169288) |
A vs C |
1.42 [0.71-2.82] |
0.99 |
0.32 |
0.004 |
88 |
Random |
|
|
AC + CC vs AA |
1.65 [0.76-3.61] |
1.26 |
0.21 |
0.01 |
84 |
Random |
|
|
CC vs AC + AA |
1.02 [0.68-1.53] |
0.08 |
0.94 |
0.07 |
69 |
Fixed |
|
|
AC vs AA+CC |
1.41 [1.06-1.86] |
2.40 |
0.02 |
0.14 |
54 |
Fixed |
|
HNF1A (rs2464196) |
G vs A |
1.14 [0.94-1.39] |
1.34 |
0.18 |
0.07 |
69 |
Fixed |
|
|
GA + AA vs GG |
1.30 [0.88-1.91] |
1.30 |
0.19 |
0.21 |
36 |
Fixed |
|
|
AA vs GA + GG |
1.10 [0.77-1.57] |
0.54 |
0.59 |
0.11 |
61 |
Fixed |
|
|
GA vs GG+AA |
1.16 [0.88-1.52] |
1.05 |
0.29 |
0.87 |
0 |
Fixed |
|
HNF1A (rs735396) |
T vs C |
0.92 [0.76-1.12] |
0.83 |
0.41 |
0.82 |
0 |
Fixed |
|
|
TC + CC vs TT |
0.89 [0.66-1.21] |
0.73 |
0.47 |
0.23 |
31 |
Fixed |
|
|
CC vs TC + TT |
0.91 [0.66-1.25] |
0.61 |
0.54 |
0.32 |
0 |
Fixed |
|
|
TC vs TT+CC |
0.98 [0.75-1.29] |
0.14 |
0.89 |
0.05 |
75 |
Fixed |
Table 3: Summary of the association with the MetS and its components
|
|
Association with the MetS and its components |
|||||||
|
Gene |
Polymorphisms |
Author |
Population |
MetS |
Obesity |
Hypergly |
Hypert |
Dyslipi |
|
Meta-analyses |
||||||||
|
APOA5 |
rs3135506 |
Ajjemami et al 2015 |
Moroccan |
(+) |
x |
x |
||
|
APOA5 |
rs3135506 |
Kefi et al. 2017 |
Tunisian |
(-) |
x |
x |
||
|
APOA5 |
rs662799 |
Zaki et al 2014 |
Egyptian |
(+) |
x |
x |
||
|
APOA5 |
rs662799 |
Ajjemami et al 2015 |
Moroccan |
(+) |
x |
x |
x |
|
|
APOA5 |
rs662799 |
Hechmi et al 2020 |
Tunisian |
(+) |
||||
|
APOC3 |
rs5128 |
Ajjemami et al 2014 |
Moroccan |
(+) |
x |
|||
|
APOC3 |
rs5128 |
Lakbakbi et al 2017 |
Moroccan |
(+) |
x |
|
||
|
APOE |
rs4420638 |
Boulenouar et al 2019 |
Algerian |
(-) |
|
|||
|
APOE |
rs4420638 |
Elouej et al 2016 |
Tunisian |
(-) |
|
|||
|
FTO |
rs9939609 |
Khell et al 2017 |
Egyptian |
(+) |
x |
|||
|
FTO |
rs9939609 |
Elouej et al 2016 |
Tunisian |
(+) |
x |
|||
|
Vaspin |
rs2236242 |
Mehanna et al 2015 |
Egyptian |
(+) |
x |
x |
x |
x |
|
Vaspin |
rs2236242 |
Alnory et al 2016 |
Egyptian |
(-) |
||||
|
HNF1A |
rs1169288 |
Morjane et al 2017 |
Morocco |
(+) |
x |
x |
x |
|
|
HNF1A |
rs1169288 |
Dalali et al 2022 |
Tunisia |
(-) |
||||
|
HNF1A |
rs2464196 |
Morjane et al 2017 |
Morocco |
(+) |
x |
|||
|
HNF1A |
rs2464196 |
Dalali et al 2022 |
Tunisia |
(-) |
x |
x |
||
|
HNF1A |
rs735396 |
Morjane et al 2017 |
Morocco |
(-) |
x |
|||
|
HNF1A |
rs735396 |
Dalali et al 2022 |
Tunisia |
(-) |
x |
|
||
|
Narrative review |
||||||||
|
ADCY5 |
rs11708067 |
Lakbakbi et al 2017 |
Moroccan |
(+) |
x |
|||
|
Apelin |
rs2235306 |
Mehanna et al 2014 |
Egyptian |
(-) |
||||
|
APOA5 |
rs2075291 |
Ajjemami et al 2015 |
Moroccan |
(-) |
||||
|
APOA5 |
rs2266788 |
Ajjemami et al 2015 |
Moroccan |
(-) |
x |
|||
|
APOA5 |
rs651821 |
Kefi et al. 2027 |
Tunisian |
(+) |
|
|||
|
APOE |
epsilon |
Boulenouar et al 2019 |
Algerian |
(-) |
||||
|
APOE |
rs439401 |
Boulenouar et al 2019 |
Algerian |
(-) |
X |
|||
|
CD36 |
rs1761667 |
Bayoumy, et al 2012 |
Egyptian |
(+) |
x |
x |
x |
x |
|
CETP |
rs708272 |
Elsammak et al 2011 |
Egyptian |
(+) |
x |
|||
|
Chemerin |
rs17173608 |
Mehanna et al 2015 |
Egyptian |
(+) |
x |
x |
x |
x |
|
CILP2 |
rs10401969 |
Elouej et al 2016 |
Tunisian |
(-) |
|
|||
|
DUSP9 |
rs5945326 |
Lakbakbi et al 2017 |
Moroccan |
(+) |
||||
|
ESR1 |
rs2234693 |
Ghattasa et al 2013 |
Egyptian |
(-) |
x |
x |
x |
x |
|
ESR1 |
rs9340799 |
Ghattasa et al 2013 |
Egyptian |
(+) |
|
|||
|
FTO |
rs1421085 |
Elouej S et al 2016 |
Tunisian |
(+) |
|
|||
|
FTO |
rs8057044 |
Elouej S et al 2016 |
Tunisian |
(-) |
x |
|||
|
G6PC2 |
rs560887 |
Lakbakbi et al 2017 |
Moroccan |
(-) |
|
|||
|
INSR |
rs2059807 |
Elouej S et al 2016 |
Tunisian |
(-) |
||||
|
KLF14 |
rs1562398 |
Elouej S et al 2016 |
Tunisian |
(-) |
||||
|
Leptin |
rs7799039 |
Alnory et al 2016 |
Egyptian |
(+) |
||||
|
LRPAP1 |
rs762861 |
Elouej S et al 2016 |
Tunisian |
(+) |
||||
|
PROX1 |
rs340874 |
Lakbakbi et al 2017 |
Moroccan |
(+) |
||||
|
TNF-α |
rs1800629 |
Ghareeb et al 2021 |
Egyptian |
(+) |
x |
|
x |
|
|
UBE2E2 |
rs7612463 |
Lakbakbi et al 2017 |
Moroccan |
(-) |
x |
|||
|
VDR |
rs1544410 |
Mackawy et al 2014 |
Egyptian |
(-) |
|
|||
|
VDR |
rs2228570 |
Mackawy et al 2014 |
Egyptian |
(+) |
||||
|
ZNF664 |
rs12310367 |
Elouej S et al 2016 |
Tunisian |
(-) |
x |
|||
|
PPARγ2 |
Pro12Ala |
Youssef et al 2013 |
Tunisian |
(-) |
x |
x |
||
|
PPARγ2 |
C161T |
Youssef et al 2013 |
Tunisian |
(+) |
x |
x |
||
|
LEP |
rs7799039 |
Boumaiza et al 2012 |
Tunisian |
(+) |
x |
x |
||
|
LEP |
rs1137101 |
Boumaiza et al 2012 |
Tunisian |
(-) |
x |
x |
x |
|
|
RETN |
420C/G |
Boumaiza et al 2012 |
Tunisian |
(-) |
x |
|
||
|
RETN |
44G/A |
Boumaiza et al 2012 |
Tunisian |
(+) |
x |
|||
|
RETN |
62G/A |
Boumaiza et al 2012 |
Tunisian |
(-) |
|
|||
|
RETN |
394C/G |
Boumaiza et al 2012 |
Tunisian |
(-) |
||||
|
CAPN10 |
rs3842570 |
El‑Far et al 2022 |
Egyptian |
(-) |
||||
|
CAPN10 |
rs3792267 |
El‑Far et al 2022 |
Egyptian |
(-) |
||||
|
CAPN10 |
rs5030952 |
El‑Far et al 2022 |
Egyptian |
(-) |
||||
 |
Figure 1: Flow chart of the studies selected in our meta-analysis. |
 |
Figure 2: Percentage of the polymorphisms associated with the MetS and its components |
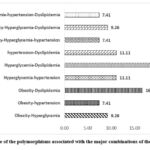 |
Figure 3: Percentage of the polymorphisms associated with the major combinations of the MetS components |
Discussion
MetS is a topic of extensive research, particularly due to its high prevalence. It is identified by the association of several risk factors or components that can lead to coronary artery disease and/or other pathologies, particularly abdominal obesity, hypertension, hyperglycemia, high TG levels and low HDL-c levels 47. The MetS development is believed to be influenced by genetics , making genetic studies an active research area 57.
In this bibliographic review, only polymorphisms that have been the subject of at least two studies, in relation to MetS in North African populations, were included in the meta-analysis. In the same context, significant SNP-MetS associations that were investigated in only one study were included in our narrative review. Thus, the overall results of the meta-analyses suggest an association between MetS and the SNPs in the APOA5 (rs3135506 and rs662799), APOC3 (rs5128), FTO (rs9939609), and vaspin (rs2236242) genes (Table 2).
Our results indicate that the APOA5 gene c.C56G (rs3135506) polymorphism significantly increases the susceptibility to MetS in North African populations by 39% and 43% in the allelic and dominant models, respectively. Furthermore, when assessing the link between c.C56G and MetS in Asian populations 58, the genotype carrying the G allele significantly increased the MetS risk (OR = 1.32; 95% CI [1.15–1.50]; p<0.001). On the same gene, the rs662799 showed values of Odd’s Ratio indicating an increased risk of developing MetS compared to the value of the allelic model of the first polymorphism rs3135506 : (T vs. C), OR =2.25 95% CI [1.42-3.57], p = 0.0006; (TC+CC vs. TT), OR =3.05 95% CI [1.57-5.90], p = 0.0009; (TC vs. TT+CC), OR =2.87 95% CI [1.61-5.14], p = 0.0004. In another meta-analysis, involving a dataset from 12 studies with 5 573 MetS cases and 8 290 controls subjects in Asians and Europeans, the -1131C allele was associated with an increased risk of MetS with an OR = 1.43, 95% CI [1.29-1.58] in Asian and an OR = 1.30, 95% CI [0.94-1.78] in European populations 59. However, among the other APOA5 gene polymorphisms that were not included in the meta-analysis, only the rs651821 polymorphism was associated with MetS in the Tunisian population45.
In the meta-analysis we investigate the relationship beteween the APOC3 rs5128 polymorphism and plasma APOC3/lipid levels. The results indicated that carriers of the variant G allele had higher TG levels, total cholesterol, and LDL-c than non-carriers60. The combination of two studies in our meta-analysis showed increased susceptibility to MetS development in three models (allelic, dominant, and additive). Indeed, the G allele of the rs5128 polymorphism multiplies the risk of MetS by 2.63 : (C vs. G); OR = 2.63 95% CI [1.58-4.36], p = 0.0002, while with the dominant model (CG+GG vs. CC); OR =3.10 95% CI [1.79-5.39], P < 0.0001; and with the additive model (CG vs. CC+GG); OR = 3.25 95% CI [1.83-5.79] P < 0.0001.
Concerning the FTO gene polymorphisms that were shown to be associated with MetS, our meta-analysis indicated that the rs9939609 polymorphism increased the MetS risk in three genetic models: the allelic (T vs. A) OR = 1.30; 95% IC [1, 06-1.58]; p = 0.01; the dominant model (TA+AA vs. TT) OR = 1.52; 95% IC [1.14-2.02]; p = 0.004 and the additive model (TA vs. TT+AA) OR = 1.33; 95% IC [1.01-1.76]; Z=2.05, p=0.04. Similarly, in the combined analysis, the rs9939609 polymorphism significantly increased MetS susceptibility in comparisons by allele (A vs. T) (OR = 1.21; 95% CI [1.10–1.35]; p <0.001) and in the dominant model (OR = 1.35; 95% CI [1.13–1.62]; p < 0.001). Subgroup analyses within allele comparisons (A vs. T) indicated that the elevated risk was seen in adults (OR = 1.26, 95% CI [1.08-1.47], P = 0.003) but not in children and adolescents (OR = 1.14, 95% CI [0.95-1.36], p = 0.17) [59]. Nevertheless, Elouej et al. found an association between the rs1421085 polymorphism and the MetS, but no association was found between the rs8057044 polymorphism and the MetS 49.
The vaspin gene polymorphism showed a significant association with MetS and appeared to play a protective role in three genetic models (allelic, dominant, and additive), respectively: (T vs. A) OR = 0.61; 95% CI [0.45-0.82]; p = 0.001; (TA+AA vs. TT) OR = 0.48; 95% CI [0.32-0.73] Z = 3.43 p = 0.0006; (TA vs. TT+AA) OR = 0.60, 95% CI [0.40-0.90] p = 0.01. Similarly, Hashemi et al. (2012) suggested that the vaspin polymorphism rs2236242 plays a protective role in susceptibility to MetS in Zhedn in the southeastern Iran 61. Furthermore, the results of our meta-analysis revealed the absence of a significant association between the three HNF1A polymorphisms (rs1169288, rs2464196, rs735396) and MetS predisposition. However, it is important to underline that the three HNF1A gene SNPs studied have been correlated with the insulin resistance, high LDL-c and low HDL-c levels in some studies 54,62.
The genetic identification of MetS is made problematic because of its complexity. This complexity exists at two levels: on the one hand, each of the metabolic processes involved in the development of the syndrome is complex and involves numerous genes or polymorphisms, on the other hand, the syndrome etiology remains unknown. The candidate genes choice is then based on two hypotheses: either the gene or the polymorphism has a pleiotropic effect and plays on different MetS metabolic pathways, or it plays on a specific trait that may be sufficient on its own for the development of MetS. Many studies have investigated whether genes or polymorphisms already associated with one MetS component could also be associated with another component or with the risk of developing globally the MetS 47,57. In our review, we were able to identify pleiotropic genes: among the genes associated with obesity, the APOA5, vaspin, CD 36, chemerin, and ESR1 genes are also associated with hypertension, hyperglycemia, and dyslipidemia 23,27,39,56. In the case-control studies included, 21.57% of the polymorphisms showed an association with hyperglycemia and dyslipidemia, and 15.69% of the SNPs showed susceptibility to obesity and dyslipidemia (Table 3 and figure 3). However, although these polymorphisms are associated with several MetS components, they appear to be 52.94% associated with the MetS risk 63. For example, the APOA5 (rs3135506) polymorphism is associated with hyperglycemia and dyslipidemia in the Tunisian population 45, but its impact on the MetS risk has not yet been shown.
Association analyses carried out in this narrative review revealed numerous potential candidate genes to MetS and/or its components. Across all the studies included, we identified 11 candidate genes carrying 14 SNPs (representing 24.56% of the total number of SNPs) associated with obesity and/or abdominal obesity. A further 10 candidate genes carrying 13 genetic SNPs (22.81%) correspond to common genetic variants linked to hyperglycemia. The association between hypertension and genetic variations has the lowest prevalence among MetS components (12.28%), with the involvement of 7 genes and 7 variants. Concerning the genetic association with dyslipidemia, our review revealed the highest prevalence (35.09%) with 14 candidate genes analyzed and 20 SNPs associated. It is important to note that globally the genetic association with MetS components presents a great variability between different North African countries (Table 2 and figure 2). Focusing on combination between the principal phenotypes (obesity, hyperglycemia, hypertension, and dyslipidemia) could lead to the identification of new SNPs that would not have been found associated when studying the phenotypes separately. The present review illustrates that the use of this strategy allowed the highlighting of new risk loci shared between MetS components (Table 3). Furthermore, we could found that the association of a SNP with the MetS implies its association with at least one of its components; therefore, the association of a SNP with one component does not imply that it must be associated with MetS. For example, the SNPs FTO (rs8057044) 28 and HNF1A (rs735396) 24 are linked to dyslipidemia but do not appear to be associated with MetS. This distinction between SNPs associated with a single MetS component and those related to several components or to MetS as a whole, may simplify the identification of pathways underlying the clustering observed in the context of MetS 47. Surprisingly, our findings revealed that despite suggestions that disturbances in glucose metabolism, weight regulation, and hypertension could trigger MetS 64, most of the SNPs associated with MetS are located in genes involved in lipid metabolism. Then associations of the SNPs on APOA5 (rs3135506 and rs662799), APOC3 (rs5128), and FTO (rs9939609) genes with MetS, may be mediated by hypertriglyceridemia and/or hypo-HDL-demia. TG accumulation in the muscles can promote the development of insulin resistance 64. Additionally, dysfunction of the APOA5 and APOC3 genes increases free fatty acid levels 65, which may in turn stimulate the development of MetS characteristics such as dyslipidemia, overweight, insulin resistance, hypertension, or inflammation 64. Alternatively, the overrepresentation of SNPs in lipid metabolism may be caused by the emphasis on lipid metabolism in the MetS criteria. In the most common MetS definitions, the NCEP ATP III definition and the IDF definition, disturbed lipid metabolism is characterized by two MetS characteristics, namely low HDL-c and increased triglyceride levels, while disturbances in other mechanisms such as weight regulation are all characterized by a single MetS feature 47.
Genetic association studies establish the link between genetic factors and a trait using the approach of case-control studies. These studies often involve multiple SNP markers selected across the genome that are analyzed in patient and control samples 57. Other kinds of markers can also be explored, like insertion/deletion polymorphisms 66. Variants are chosen from candidate genes presenting a functional relation with MetS pathophysiology, like genes of insulin signaling, lipid metabolism, hypertension, inflammation, and adipose tissue distribution.
Several factors contributed to the heterogeneity observed between the studies selected, including variations in MetS definitions, populations studied, sample sizes, research design, and genetic markers analysed. For instance, while most studies encompassed the two genders in populations, some ones have focused only women 24,32. Similarly, there was variability in the proportion of men and women as well as the age groups, across the majority of studies; both of which are recognized as well-known sources of heterogeneity in meta-analyses 67. It is important to acknowledge the challenges associated with precisely defining North African populations, as they consist of various ethnic subgroups. In addition, we evaluated within-study heterogeneity by using statistic I 68, which estimates the share of variance within a study attributed to heterogeneity 68. Nevertheless, these values may lack precison and exhibit substantial bias when the number of studies in a meta-analysis is small, as in our study 69. Due to the small number of studies available for different genes and genetic variations, we were unable to ascertain the degree of publication bias.
Limitations of the study
Our study had a number of limitations that should be noted: firstly, we limited our articles search to English language and we have ignored research published in other languages; secondly, we did not considered some additional risk factors for MetS such as excessive food intake and physical inactivity; thirdly, some of the included case-control studies had small sample sizes, which could have resulted in a decreased ability reducing the power to detect differences in genotype distribution between cases and controls. Furthermore, several studies did not consider matching factors like age, sex, or other variables, which could may have influenced the studies’ findings. The strength of this analysis was the comprehensive inclusion of all eligible genetic association studies related to MetS risk, leading to a substantially larger sample size, which improved the evaluation of the association effectively.
Conclusion
This review provides a concise overview of the existing literature concerning the relationship between genetic polymorphisms and MetS susceptibility in North African populations. Our meta-analysis results suggest that four polymorphisms, APOA5 (rs3135506 and rs662799), APOC3 (rs5128) and FTO (rs9939609), contributed significantly to the combined risk of developing MetS. The vaspin polymorphism (rs2236242) appeared to play a protective role against MetS. Each of these SNPs was also linked to some MetS components, but the most of them showed an association with dyslipidemia. The number of genes associated with MetS susceptibility in North African populations is still low, which invite to additional efforts and well-designed epidemiogenetic studies involving large sample sizes of population’s subjects anthropogenetically well defined and considering a large number of polymorphisms implicated in the different metabolic pathways leading to MetS.
Acknowledgement
None
Conflict of Interest
No conflict of interest to declare.
Funding Sources
There are no funding sources.
References
- Alberti KGMM, Eckel RH, Grundy SM, et al. Harmonizing the Metabolic Syndrome. Circulation. 2009;120(16):1640-1645. doi:10.1161/CIRCULATIONAHA.109.192644
- Grundy SM. Metabolic syndrome update. Trends Cardiovasc Med. 2016;26(4):364-373. doi:10.1016/J.TCM.2015.10.004
- IDF. International Diabetes Federation Press Conference: The IDF Consensus Worldwide Definition of the Metabolic Syndrome Article Online.; 2005.
- Al-Rubeaan K, Bawazeer N, Al Farsi Y, et al. Prevalence of metabolic syndrome in Saudi Arabia – a cross sectional study. BMC Endocr Disord 2018 181. 2018;18(1):1-9. doi:10.1186/S12902-018-0244-4
- Pengpid S, Peltzer K. Prevalence and correlates of the metabolic syndrome in a cross-sectional community-based sample of 18–100 year-olds in Morocco: Results of the first national STEPS survey in 2017. Diabetes Metab Syndr Clin Res Rev. 2020;14(5):1487-1493. doi:10.1016/J.DSX.2020.07.047
- Hannoun Z, Harraqui K, Attoumane R, et al. Epidemiological profile and clinical characteristics of metabolic syndrome in Marrakesh, Morocco. Pan Afr Med J. 2020;36(1). doi:10.11604/pamj.2020.36.133.19913
- Houti L, Hamani-Medjaoui I, Lardjam-Hetraf SA, et al. Prevalence of Metabolic Syndrome and its Related Risk Factors in the City of Oran, Algeria: the ISOR Study. Ethn Dis. 2016;26(1):99. doi:10.18865/ED.26.1.99
- Elaziz KMA, Gabal MS, Aldafrawy OA, Seif HAAA, Allam MF. Prevalence of metabolic syndrome and cardiovascular risk factors among voluntary screened middle-aged and elderly Egyptians. J Public Health (Bangkok). 2015;37(4):612-617. doi:10.1093/PUBMED/FDU097
- El-Shareif H. Prevalence of metabolic syndrome and its components in nondiabetic Libyan females. Libyan Int Med Univ J. 2018;03(01):20-25. doi:10.4103/LIUJ.LIUJ_9_18
- Kacem I, Maoua M, Hasni Y, et al. Évaluation du risque de syndrome métabolique chez les travailleurs postés en Tunisie. East Mediterr Heal J. 2019;25(10):677. doi:10.26719/emhj.19.040
- Bachir Cherif A, Temmar M, Chibane A, et al. Le syndrome métabolique chez les hypertendus de la population noire du sud algérien. Ann Cardiol Angeiol (Paris). 2015;64(3):158-163. doi:10.1016/J.ANCARD.2015.04.005
- Samara I, Bour A. THE PREVALENCE OF METABOLIC SYNDROME COMPARED TO PHYSICAL ACTIVITY IN A POPULATION OF SALE, A NORTH WEST CITY OF MOROCCO. Swedish J Sci Res. 2016;3:37. Accessed August 31, 2022. www.sjsr.se
- El Brini O, Akhouayri O, Gamal A, Mesfioui A, Benazzouz B. Prevalence of metabolic syndrome and its components based on a harmonious definition among adults in Morocco. Diabetes, Metab Syndr Obes Targets Ther. 2014;7:341. doi:10.2147/DMSO.S61245
- Mohammed EA, Mohamed M, Denis L, Rekia B. Prevalence of parameter indicators of obesity and its relationship with metabolic syndrome in urban Moroccan women. Am J Hum Biol. 2008;20(4):484-486. doi:10.1002/AJHB.20746
- Hamjane N, Benyahya F, Bennani Mechita M, Ghailani Nourouti N, Barakat A. The metabolic syndrome: Prevalence, associated risk factors and health complications in obese subjects in Northern Morocco. Adv Intell Syst Comput. 2019;914:90-99. doi:10.1007/978-3-030-11884-6_8/COVER
- Rguibi M, Belahsen R. Metabolic syndrome among Moroccan Sahraoui adult Women. Am J Hum Biol. 2004;16(5):598-601. doi:10.1002/AJHB.20065
- Allal-Elasmi M, Haj Taieb S, Hsairi M, et al. The metabolic syndrome: Prevalence, main characteristics and association with socio-economic status in adults living in Great Tunis. Diabetes Metab. 2010;36(3):204-208. doi:10.1016/J.DIABET.2009.11.009
- Belfki H, Ali S Ben, Aounallah-Skhiri H, et al. Prevalence and determinants of the metabolic syndrome among Tunisian adults: results of the Transition and Health Impact in North Africa (TAHINA) project. Public Health Nutr. 2013;16(4):582-590. doi:10.1017/S1368980012003291
- Gannar F, León C De, Antonio Brito Díaz B, et al. Social class and metabolic syndrome in populations from Tunisia and Spain. Diabetol Metab Syndr. 2015;7(1):1-7. doi:10.1186/S13098-015-0084-6/FIGURES/1
- Pollex RL, Hegele RA. Genetic determinants of the metabolic syndrome. Nat Clin Pract Cardiovasc Med 2006 39. 2006;3(9):482-489. doi:10.1038/ncpcardio0638
- Moher D, Cook DJ, Eastwood S, Olkin I, Rennie D, Stroup DF. Improving the quality of reports of meta-analyses of randomised controlled trials: the QUOROM statement. Lancet. 1999;354(9193):1896-1900. doi:10.1016/S0140-6736(99)04149-5
- Moher D, Liberati A, Tetzlaff J, et al. Preferred Reporting Items for Systematic Reviews and Meta-Analyses: The PRISMA Statement. PLoS Med. 2009;6(7). doi:10.1371/JOURNAL.PMED.1000097
- Bayoumy NM, El-Shabrawi MM, Hassan HH. Association of cluster of differentiation 36 gene variant rs1761667 (G>A) with metabolic syndrome in Egyptian adults. Saudi Med J. 2012;33(5):489-494. Accessed October 13, 2022. https://europepmc.org/article/med/22588808
- Morjane I, Kefi R, Charoute H, et al. Association study of HNF1A polymorphisms with metabolic syndrome in the Moroccan population. Diabetes Metab Syndr Clin Res Rev. 2017;11(142410):S853-S857. doi:10.1016/j.dsx.2017.07.005
- Boulenouar H, Mediene Benchekor S, Ouhaibi Djellouli H, Larjam Hetraf SA, Houti L, Hammani-Medjaoui I. Association study of APOE gene polymorphisms with diabetes and the main cardiometabolic risk factors, in the Algerian population. Egypt J Med Hum Genet. 2019;20(1):1-8. doi:10.1186/s43042-019-0013-6
- Ghareeb D, Abdelazem AS, Hussein EM, Al-Karamany AS. Association of TNF-α-308 G>A (rs1800629) polymorphism with susceptibility of metabolic syndrome. J Diabetes Metab Disord 2021 201. 2021;20(1):209-215. doi:10.1007/S40200-021-00732-3
- Mehanna ET, Mesbah NM, Ghattas MH, Saleh SM, Abo-Elmatty DM. Association of chemerin Rs17173608 and vaspin Rs2236242 gene polymorphisms with metabolic syndrome in Egyptian women. Endocr Res. 2016;41(1):43-48. doi:10.3109/07435800.2015.1066802
- Elouej S, Belfki-Benali H, Nagara M, et al. Association of rs9939609 Polymorphism with Metabolic Parameters and FTO Risk Haplotype among Tunisian Metabolic Syndrome. Metab Syndr Relat Disord. 2016;14(2):121-128. doi:10.1089/met.2015.0090
- Mehanna ET, Abo-Elmatty DM, Ghattas MH, Mesbah NM, Saleh SM. Apelin rs2235306 polymorphism is not related to metabolic syndrome in Egyptian women. Egypt J Med Hum Genet. 2015;16(1):35-40. doi:10.1016/j.ejmhg.2014.11.004
- Mackawy AMH, Badawi MEH. Association of vitamin D and vitamin D receptor gene polymorphisms with chronic inflammation, insulin resistance and metabolic syndrome components in type 2 diabetic Egyptian patients. Meta Gene. 2014;2:540-556. doi:10.1016/j.mgene.2014.07.002
- Youssef SM, Mohamed N, Afef S, et al. Combined effects of the C161T and Pro12Ala PPARγ2 gene variants with insulin resistance on metabolic syndrome: A case-control study of a central tunisian population. J Mol Neurosci. 2014;52(4):487-492. doi:10.1007/s12031-013-0161-y
- Dallali H, Hechmi M, Morjane I, et al. Association of HNF1A gene variants and haplotypes with metabolic syndrome: a case–control study in the Tunisian population and a meta-analysis. Diabetol Metab Syndr. 2022;14(1):1-11. doi:10.1186/S13098-022-00794-0/FIGURES/2
- El-Far SW, Kassem HS, Embaby AM, Saad AA, Mowafy N, Haroun M. Association of CAPN10 haplotype combinations with type 2 diabetes mellitus and metabolic syndrome among Egyptians: pilot study—genotyping of three CAPN10 variants. Egypt J Med Hum Genet. 2022;23(1):1-7. doi:10.1186/S43042-022-00212-0/TABLES/4
- Lakbakbi El Yaagoubi F, Charoute H, Morjane I, et al. Association analysis of genetic variants with metabolic syndrome components in the Moroccan population. Curr Res Transl Med. 2017;65(3):121-125. doi:10.1016/j.retram.2017.08.001
- Elouej S, Rejeb I, Attaoua R, et al. Gender-specific associations of genetic variants with metabolic syndrome components in the Tunisian population. Endocr Res. 2016;41(4):300-309. doi:10.3109/07435800.2016.1141945
- Ajjemami M, Rhaissi H, Benrahma H, et al. Association between polymorphism in APOC3, and Metabolic Syndrome in the Moroccan Population. Int J Sci Res Publ. 2014;4(10):4-7. www.ijsrp.org
- Khella MS, Hamdy NM, Amin AI, El-Mesallamy HO. The (FTO) gene polymorphism is associated with metabolic syndrome risk in Egyptian females: A case- control study. BMC Med Genet. 2017;18(1):1-8. doi:10.1186/s12881-017-0461-0
- Zaki M, Amr K. Apolipoprotein A5 T-1131C variant and risk for metabolic syndrome in obese adolescents. Gene. 2014;534(1):44-47. doi:10.1016/j.gene.2013.10.032
- Ajjemami M, Ouatou S, Charoute H, et al. Haplotype analysis of the Apolipoprotein A5 gene in Moroccan patients with the metabolic syndrome. J Diabetes Metab Disord. 2015;14(1):1-8. doi:10.1186/s40200-015-0160-3
- Elsammak MY, Al-Sharkaweey RM, Fahmy M, et al. Taq 1B polymorphism of cholesteryl ester transfer protein (CETP) in Egyptian patients with metabolic syndrome. Diabetes Metab Syndr Clin Res Rev. 2011;5(2):61-65. doi:10.1016/j.dsx.2010.12.009
- Boumaiza I, Omezzine A, Rejeb J, et al. Association between four resistin polymorphisms, obesity, and metabolic syndrome parameters in tunisian volunteers. Genet Test Mol Biomarkers. 2012;16(12):1356-1362. doi:10.1089/gtmb.2012.0156
- Hechmi M, Dallali H, Gharbi M, et al. Association of rs662799 variant and APOA5 gene haplotypes with metabolic syndrome and its components: A meta-analysis in North Africa. Biosci Rep. 2020;40(8):1-10. doi:10.1042/BSR20200706
- Alnory A, Gad H, Hegazy G, Shaker O. The association of vaspin rs2236242 and leptin rs7799039 polymorphism with metabolic syndrome in Egyptian women. Turkish J Med Sci. 2016;46(5):1335-1340. doi:10.3906/sag-1502-138
- NCEP-ATPIII. Executive Summary of the Third Report of the National Cholesterol Education Program (NCEP) Expert Panel on Detection, Evaluation, and Treatment of High Blood Cholesterol in Adults (Adult Treatment Panel III). JAMA. 2001;285(19):2486-2497. doi:10.1001/JAMA.285.19.2486
- Kefi R, Hechmi M, Dallali H, et al. Étude d’association du gène APOA5 au syndrome métabolique et à ses composantes dans la population tunisienne. Ann Endocrinol (Paris). 2017;78(3):146-155. doi:10.1016/j.ando.2017.01.005
- Merkel M, Loeffler B, Kluger M, et al. Apolipoprotein AV accelerates plasma hydrolysis of triglyceride-rich lipoproteins by interaction with proteoglycan-bound lipoprotein lipase. J Biol Chem. 2005;280(22):21553-21560. doi:10.1074/jbc.M411412200
- Povel CM, Boer JMA, Reiling E, Feskens EJM. Genetic variants and the metabolic syndrome: A systematic review. Obes Rev. 2011;12(11):952-967. doi:10.1111/j.1467-789X.2011.00907.x
- Dina C, Meyre D, Gallina S, et al. Variation in FTO contributes to childhood obesity and severe adult obesity. Nat Genet 2007 396. 2007;39(6):724-726. doi:10.1038/ng2048
- Elouej S, Nagara M, Attaoua R, et al. Association of genetic variants in the FTO gene with metabolic syndrome: A case-control study in the Tunisian population. J Diabetes Complications. 2016;30(2):206-211. doi:10.1016/j.jdiacomp.2015.11.013
- Hida K, Wada J, Eguchi J, et al. Visceral adipose tissue-derived serine protease inhibitor: A unique insulin-sensitizing adipocytokine in obesity. Proc Natl Acad Sci. 2005;102(30):10610-10615. doi:10.1073/PNAS.0504703102
- Li K, Li L, Yang M, et al. Short-term continuous subcutaneous insulin infusion decreases the plasma vaspin levels in patients with type 2 diabetes mellitus concomitant with improvement in insulin sensitivity. Eur J Endocrinol. 2011;164(6):905-910. doi:10.1530/EJE-10-1023
- Esaki E, Adachi H, Hirai Y, et al. Serum vaspin levels are positively associated with carotid atherosclerosis in a general population. Atherosclerosis. 2014;233(1):248-252. doi:10.1016/J.ATHEROSCLEROSIS.2013.12.040
- Hong EP, Kim DH, Park JW. Interactions of genetic and non-genetic factors on plasma hs-CRP concentration in a Korean community-based cohort study. Genes and Genomics. 2015;37(3):231-239. doi:10.1007/S13258-014-0240-7/METRICS
- Wakil SM, Muiya NP, Tahir AI, et al. A new susceptibility locus for myocardial infarction, hypertension, type 2 diabetes mellitus, and dyslipidemia on chromosome 12q24. Dis Markers. 2014;2014. doi:10.1155/2014/291419
- Boumaiza I, Omezzine A, Rejeb J, et al. Relationship between leptin G2548A and leptin receptor Q223R gene polymorphisms and obesity and metabolic syndrome risk in Tunisian volunteers. Genet Test Mol Biomarkers. 2012;16(7):726-733. doi:10.1089/gtmb.2011.0324
- Ghattas MH, Mehanna ET, Mesbah NM, Abo-Elmatty DM. Association of estrogen receptor alpha gene polymorphisms with metabolic syndrome in Egyptian women. Metabolism. 2013;62(10):1437-1442. doi:10.1016/j.metabol.2013.05.014
- Tisha J, Lahiry P, Pollex RL, Hegele RA. Génétique du syndrome métabolique. Bio Trib Mag. 2009;30(1):25-32. doi:10.1007/s11834-009-0110-9
- Liu CF, Yang QF, Chen XL, Liu CY. Apolipoprotein A5 gene polymorphism and risk for metabolic syndrome: A meta-analysis. Genet Test Mol Biomarkers. 2012;16(10):1241-1245. doi:10.1089/gtmb.2012.0183
- Xu C, Bai R, Zhang D, et al. Effects of APOA5 −1131T>C (rs662799) on Fasting Plasma Lipids and Risk of Metabolic Syndrome: Evidence from a Case-Control Study in China and a Meta-Analysis. PLoS One. 2013;8(2):e56216. doi:10.1371/JOURNAL.PONE.0056216
- Song Y, Zhu L, Richa M, Li P, Yang Y, Li S. Associations of the APOC3 rs5128 polymorphism with plasma APOC3 and lipid levels: A meta-analysis. Lipids Health Dis. 2015;14(1). doi:10.1186/s12944-015-0027-0
- Hashemi M, Rezaei H, Eskandari-Nasab E, kaykhaei MA, Zakeri Z, Taheri M. Association between chemerin rs17173608 and vaspin rs2236242 gene polymorphisms and the metabolic syndrome, a preliminary report. Gene. 2012;510(2):113-117. doi:10.1016/J.GENE.2012.08.048
- Li Y, Li L, Bi L, et al. Lipid-associated genetic polymorphisms are associated with FBP and LDL-c levels among myocardial infarction patients in Chinese population. Gene. 2018;676:22-28. doi:10.1016/J.GENE.2018.07.016
- Dunajska K, Lwow F, Milewicz A, et al. β3-Adrenergic receptor polymorphism and metabolic syndrome in postmenopausal women. Gynecol Endocrinol. 2008;24(3):133-138. doi:10.1080/09513590801921686
- Eckel RH, Alberti KGMM, Grundy SM, Zimmet PZ. The metabolic syndrome. Lancet. 2010;375(9710):181-183. doi:10.1016/S0140-6736(09)61794-3
- Hahne P, Krempler F, Schaap FG, et al. Determinants of plasma apolipoprotein A-V and APOA5 gene transcripts in humans. J Intern Med. 2008;264(5):452-462. doi:10.1111/j.1365-2796.2008.01987.x
- Payer LM, Steranka JP, Yang WR, et al. Structural variants caused by Alu insertions are associated with risks for many human diseases. Proc Natl Acad Sci U S A. 2017;114(20):E3984-E3992. doi:10.1073/PNAS.1704117114/SUPPL_FILE/PNAS.1704117114.SD05.XLSX
- Pei YF, Tian Q, Zhang L, Deng HW. Exploring the Major Sources and Extent of Heterogeneity in a Genome-Wide Association Meta-Analysis. Ann Hum Genet. 2016;80(2):113-122. doi:10.1111/AHG.12143
- Galassi A, Reynolds K, He J. Metabolic syndrome and risk of cardiovascular disease: a meta-analysis. Am J Med. 2006;119(10):812-819. doi:10.1016/J.AMJMED.2006.02.031
- Von Hippel PT. The heterogeneity statistic I2 can be biased in small meta-analyses. BMC Med Res Methodol. 2015;15(1). doi:10.1186/S12874-015-0024-Z
Abbreviations
MetS : Metabolic syndrome; RFLP: Restriction fragment length polymorphism; IDF : International Diabetes Federation; NCEP-ATP III: National Cholesterol Education Program Adult Treatment Panel III; CVDs: Cardiovascular diseases; LDL-C: Low-density lipoprotein cholesterol; SNPs: Single-nucleotide polymorphisms; VLDL: Very low-density lipoprotein; HDL: High-density lipoprotein; PRISMA 2009: Preferred Reporting Items for Systematic Reviews and Meta-Analyses 2009; OR : odds ratio; 95% CI : confidence interval; HWE: Hardy-Weinberg equilibrium; NOS: Newcastle-Ottawa scale

