
Manuscript accepted on :22-03-2023
Published online on: 25-10-2023
Plagiarism Check: Yes
Reviewed by: Dr. Nicolas Padilla
Second Review by: Dr. Revathi Shenoy
Final Approval by: Dr. Ayush Dogra
A. Arif Yezdani1* , S. Kishore Kumar1and Kesavaram Padmavathy2
1Department of Orthodontics and Dentofacial Orthopedics, Sree Balaji Dental College and Hospital, Bharath Institute of Higher Education and Research, Chennai, Tamil Nadu, India.
2Department of Microbiology, Research Laboratory for Oral-Systemic Health, Sree Balaji Dental College and Hospital, Bharath Institute of Higher Education and Research, Chennai Tamil Nadu, India.
Corresponding Author E-mail: arifyezdani@yahoo.com
DOI : https://dx.doi.org/10.13005/bpj/2789
Abstract
Introduction: Accurate measurement of skeletal maturity is critical to the optimal treatment timing of skeletal jaw discrepancies. Skeletal maturity can be assessed by several radiologic biologic indicators such as orthopantomograph, middle phalanx of third finger (MP3), hand-wrist radiograph and cervical vertebral maturation indicators (CVMI), but since they are highly subjective techniques to identify peak mandibular growth, a quest for a reliable non-radiologic biologic marker was deemed necessary. Parathyroid Hormone related Protein (PTHrP) was chosen to assess the skeletal maturity as its evidence was scarce in literature. Materials and Methods: The sample consisted of 80 skeletal Class II malocclusion subjects, males (n= 38), females (n=42), aged 11–18 years. The cervical stage of each subject was assessed with a lateral cephalogram. Two mL blood was obtained by venipuncture. Serum PTHrP was quantitatively assessed by ELISA-Sandwich principle using Elabscience, ELISA kit. Results: Mean PTHrP serum levels in males witnessed an increase in CS3 & in females in CS2 followed by CS5, exhibiting a pubertal trend in males and a pre-pubertal trend in females. Mean PTHrP serum levels in the four intervals of cervical staging showed an increase in CS2 through to CS4 in males and in CS2-CS3 in females, showing an increase of this biomarker in the pre and pubertal stages in both the sexes. Conclusions: PTHrP mean serum levels was found to be increased in early rather than in the later stages of puberty in both males and females leading to the speculation that PTHrP could serve as a potential biomarker to assess the pubertal growth spurt.
Keywords
Cervical vertebral stages; Malocclusion; Parathyroid Hormone related Protein; Pubertal growth spurt
Download this article as:| Copy the following to cite this article: Yezdani A. A, Kumar S. K, Padmavathy K. Estimation of Serum Parathyroid Hormone Related Protein in the Assessment of Pubertal Growth Spurt in Skeletal Class II Malocclusion Subjects. Biomed Pharmacol J 2023;16(4). |
| Copy the following to cite this URL: Yezdani A. A, Kumar S. K, Padmavathy K. Estimation of Serum Parathyroid Hormone Related Protein in the Assessment of Pubertal Growth Spurt in Skeletal Class II Malocclusion Subjects. Biomed Pharmacol J 2023;16(4). Available from: https://bit.ly/470cXzN |
Introduction
Modification of skeletal jaw discrepancies is best attempted during the adolescent growth spurt. During adolescence, the timing of the pubertal growth spurt occurs two years earlier in girls in comparison to boys.1 It has also been reiterated that treatment timing in mandibular deficiencies is directly dependent on mandibular growth spurt in sync with pubertal onset.2 Biological skeletal maturity indicators helps identify this pubertal growth spurt. The radiologic biomarkers like hand-wrist radiograph3, MP3 stages on periapical x-ray films4 and cervical vertebral maturation assessment on lateral cephalograms5-10 have been reported to be used extensively for skeletal maturity assessment and for noting peak attainment in mandibular growth.
Cervical vertebral changes served as reliable skeletal maturity indicators without the need for an additional radiograph11 and in Class II jaw discrepancies, their assessment was found sufficient for functional appliance therapy.12 Several authors have also eschewed the reliability and validity of this method.13
However, radiographic methods have their inherent disadvantages like inter and intra-observer variability and failure to accurately determine the growth potential and end of growth spurt. The final stage of development as depicted in the radiographs also does not necessarily determine whether complete growth has been attained. Non radiologic biomarkers in contrast to radiologic biomarkers have been reported to be not only accurate in determining skeletal maturity but also in predicting the amount of growth left. Many non-radiologic biomarkers like insulin-like growth factor-1(IGF-1), insulin-like growth factor binding protien-3(IGFBP3) and osteocalcin have been used to assess the skeletal maturity of an individual.14, 15
Parathyroid Hormone related Protein (PTHrP), a poly hormone comprising of a family of distinct peptide hormones is secreted sometimes by cancer cells but primarily by the mesenchymal cells. Besides its parathyroid hormone like function, it also engages itself in epithelial cell growth, relaxation of smooth muscle, development of fetus, placental calcium transfer as also in skeletal morphogenesis.16 PTHrP is synthesized at the periarticular ends of bone. Chondrocytes distant from the influence of PTHrP differentiate and secrete Indian hedgehog protein (Ihh) which further triggers release of PTHrP. Early maturation of chondrocytes thus induces osteogenesis.17 During longitudinal growth, chondrocyte proliferation and differentiation is tightly controlled by the interplay between PTHrP & Ihh signaling in the growth plate facilitated also invariably by the PTHrP target gene (Zfp521).18 Chondrocyte differentiation is affected by PTHrP and in mice with PTHrP null mutancy, intramembranous & endochondral ossification abnormalities leading to deformities in the mandible have also been observed, reiterating its role in the control of muscle development too.19 Analysis of PTHrP null mutant mice revealed the formation of ectopic cartilage of a small proportion in the coronoid process of the mandible with increased multinucleated osteoclasts & abnormal bone marrow expansion. These immunohistochemical findings reiterated the role PTHrP played in bone modeling and chondrocyte differentiation.20 It has also been reported that mechanical loading on the condyle brought about by a bite-jumping device in Sprague Dawley rats caused condylar cartilage growth due to the expression of SOX9 and PTHrP.21
The objective of our study was thus to assess the serum levels of the PTHrP biomarker and correlate the same with the cervical vertebral stages to identify the pubertal growth spurt to facilitate timely correction of the skeletal class II malocclusion.
Materials and Methods
Eighty subjects, males (n= 38), females (n=42), in the age range of 11–18 years, were selected from the outpatient department of Orthodontics & Dentofacial Orthopedics, Sree Balaji Dental College & Hospital, Chennai. All the subjects were screened for Class II skeletal malocclusion by extraoral and intraoral clinical examination.Subjects with chronic systemic illness, endocrinological disorders, bleeding disorders, growth abnormalities, congenital syndromes and history of facial trauma/injury were excluded. Written informed consent was obtained from the participant and their parent/guardian respectively before recruitment. The proposed study design & protocol was reviewed and approved by the Human Institutional Ethics Committee. The study design was a cross sectional study. Sample size of 80 was calculated with α level of 0.05 and β power of 0.8 for this study based on our previous study on non radiologic biomarkers in skeletal Class II malocclusion subjects. The samples were selected using systematic sampling method.
Complete case history of each patient was recorded alongwith information regarding the pubertal status of the subjects from the parents concerned. Lateral cephalometric radiograph of the subjects was taken in the natural head position and lateral cephalometric analysis was carried out to confirm skeletal Class II pattern. Morphological evaluation of the 2nd, 3rd & 4th cervical vertebrae (CV) was carried out by visual inspection of the lateral cephalograms by 2 investigators independently as per the method advocated.22 Based on the cervical stages ranging from CS2 to CS6, the 38 male & 42 female subjects were classified as has been depicted in (Table 1).
Two mL of blood was collected from the study subjects. The collected sample was centrifuged at 1000x g at 2-80 C for a duration of 20 minutes. Serum was then separated & stored at -20°C until the ELISA test was performed. Human PTHrP in the serum was quantitatively assessed by ELISA-Sandwich principle using Elabscience, ELISA kit (E-EL-H1478, Elabscience®, USA). The absorbance (OD) was read at 450 nm using a microplate reader (TECAN, InfiniteM200PRO, Switzerland) within 10 minutes of addition of Stop Solution.
The average of the duplicate OD values for each standard & patient’s sample was first calculated & the average zero standard OD was then subtracted from it. A standard curve was plotted with x-axis denoting standard concentration & y-axis the OD values. Using the average absorbance values of each sample, PTHrP concentration in each sample was calculated.
Table 1: Study subjects classified based on cervical stages.
|
Cervical Stages |
Male (n = 38) |
Female (n = 42) |
||||||
|
n |
Age (years) |
n |
Age (Years) |
|||||
|
Mean |
SD |
Median |
Mean |
SD |
Median |
|||
|
CS 2 |
8 |
11.5 |
.8 |
11.0 |
4 |
12.3 |
1.0 |
12.5 |
|
CS 3 |
10 |
13.4 |
1.3 |
13.0 |
3 |
12.7 |
1.2 |
12.0 |
|
CS 4 |
9 |
13.9 |
1.4 |
14.0 |
10 |
13.4 |
1.0 |
13.5 |
|
CS 5 |
4 |
16.8 |
1.0 |
16.5 |
19 |
15.8 |
1.8 |
16.0 |
|
CS 6 |
7 |
16.7 |
1.0 |
17.0 |
6 |
16.0 |
1.7 |
17.0 |
Statistical Analysis
CVM staging was assessed by two orthodontists blinded regarding patient’s details like age, sex & PTHrP serum levels. Kappa statistics was used to measure intra-observer and inter-observer reliability and it was found to be 0.98 and 0.96 respectively with an almost perfect agreement. The data based on PTHrP serum levels was subjected to normality tests. Since the P value of Shapiro-Wilk test was less than 0.05, the hypothesis that PTHrP data was normally distributed was rejected. Hence, non-parametric tests were carried out. Statistical analysis for gender wise comparison of PTHrP serum levels at each cervical stage and in the four intervals of the cervical stages was carried out using Kruskal-Wallis test and for intergroup comparisons, Mann-Whitney U test with Bonferroni”s correction was done. (P <0.05 was considered statistically significant). Analysis of the data was carried out utilizing SPSS (Version 24.0).
Results
Gender wise comparison of serum PTHrP levels at each cervical stage (CS) is depicted in (Table 2). In males, the highest mean PTHrP levels was 26.02 ± 37.57 pg/mL in CS3 with a decline subsequently from CS4 to CS6 with the lowest mean PTHrP levels in CS5 (12.29 ± 1.69 pg/mL) but it was statistically not significant (P = 0.988). In females, the highest mean PTHrP levels was 22.64 ± 9.73 pg/mL in CS2 with an appreciable increase in CS5 (16.90 ± 11.57 pg/mL) and the lowest mean PTHrP levels was in CS3 (11.32 ± 0.65 pg/mL). However, it was not significant statistically (P = 0.268) (Table 2A & 2B), (Figure 1).
Table 2. Gender wise distribution of PTHrP (pg/mL) serum levels at each cervical stage.
Table 2A: PTHrP (pg/mL) serum levels in males at each cervical stage.
|
Cervical Stages |
Mean PTHrP (pg/mL) ± SD |
SEM |
95.0% Confidence interval for Mean |
Median |
PTHrP (pg/mL) |
||
|
LL |
UL |
Min. |
Max. |
||||
|
CS 2 |
13.77 ± 4.70 |
1.66 |
9.84 |
17.70 |
12.09 |
10 |
24 |
|
CS 3 |
26.02 ± 37.57 |
11.88 |
-.85 |
52.90 |
11.83 |
10 |
132 |
|
CS 4 |
15.04 ± 8.53 |
2.84 |
8.48 |
21.60 |
11.89 |
10 |
36 |
|
CS 5 |
12.29 ± 1.69 |
.85 |
9.60 |
14.98 |
12.40 |
10 |
14 |
|
CS 6 |
13.56 ± 3.03 |
1.15 |
10.75 |
16.36 |
13.74 |
10 |
19 |
Kruskal-Wallis test: P = 0.988 (NS)
Table 2B: PTHrP (pg/mL) serum levels in females at each cervical stage.
|
Cervical Stages |
Mean PTHrP (pg/mL) SD |
SEM |
95.0% Confidence interval for Mean |
Median |
PTHrP (pg/mL) |
||
|
LL |
UL |
Min. |
Max. |
||||
|
CS 2 |
22.64 ± 9.73 |
4.87 |
7.16 |
38.13 |
20.75 |
14 |
35 |
|
CS 3 |
11.32 ± 0.65 |
.38 |
9.70 |
12.94 |
11.06 |
11 |
12 |
|
CS 4 |
15.59 ± 5.75 |
1.82 |
11.47 |
19.70 |
13.18 |
10 |
26 |
|
CS 5 |
16.90 ± 11.57 |
2.65 |
11.32 |
22.47 |
12.26 |
10 |
45 |
|
CS 6 |
13.16 ± 2.32 |
.95 |
10.73 |
15.59 |
13.34 |
10 |
16 |
Kruskal-Wallis test: P = 0.268 (NS)
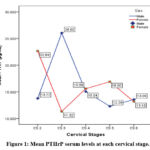 |
Figure 1: Mean PTHrP serum levels at each cervical stage. |
To evaluate intergroup comparisons of PTHrP serum levels with different cervical vertebral stages, Mann-Whitney U test with Bonferroni’s correction was carried out (Table 3). The results showed none of the variables were statistically significant (Table 3A, Table 3B).
Table 3: Intergroup comparison of PTHrP (pg/mL) serum levels with different cervical stages in both males and females.
|
A. Intergroup comparison of serum PTHrP levels with different CS in male subjects |
B. Intergroup comparison of serum PTHrP levels with different CS in female subjects |
||||
|
Cervical Stage |
Compared Stage |
P Value |
Cervical Stage |
Compared Stage |
P Value |
|
CS 2 |
CS 3 |
0.829 (NS) |
CS 2 |
CS 3 |
0.057 (NS) |
|
CS 4 |
0.963 (NS) |
CS 4 |
0.142 (NS) |
||
|
CS 5 |
0.933 (NS) |
CS 5 |
0.081 (NS) |
||
|
CS 6 |
0.867 (NS) |
CS 6 |
0.067 (NS) |
||
|
CS 3 |
CS 4 |
0.780 (NS) |
CS 3 |
CS 4 |
0.573 (NS) |
|
CS 5 |
0.839 (NS) |
CS 5 |
0.408 (NS) |
||
|
CS 6 |
0.740 (NS) |
CS 6 |
0.381 (NS) |
||
|
CS 4 |
CS 5 |
0.825(NS) |
CS 4 |
CS 5 |
0.804 (NS) |
|
CS 6 |
0.758 (NS) |
CS 6 |
0.792 (NS) |
||
|
CS 5 |
CS 6 |
0.527 (NS) |
CS 5 |
CS 6 |
0.926 (NS) |
Mann-Whitney U test with Bonferroni’s correction for 10 comparisons, alpha value set at 0.05/10=0.005; (P < 0.005); Sig.: Significant; NS – Not Significant
Gender wise comparison of serum PTHrP levels at each interval of cervical stage is depicted in (Table 4). In males, PTHrP levels was highest in CS2-CS3 & in CS3-CS4 (20.82 ± 27.75 pg/mL) with a gradual decline in CS4-CS5, to being lowest in CS5-CS6 (13.09 ± 2.60 pg/mL) but statistically was not significant (P = 0.984). In females, the highest mean PTHrP levels was 17.79 ± 9.17 pg/mL in CS2-CS3 stage with a slight decline in CS3-CS4, CS4-CS5 & CS5-CS6, to being lowest in CS3-CS4 (14.60 ± 5.33 pg/mL). It too was statistically not significant (P = 0.819) (Table 4A & 4B), (Figure 2).
Table 4. Gender wise distribution of PTHrP (pg/mL) serum levels at each interval of cervical stage.
Table 4A: PTHrP (pg/mL) serum levels of male subjects at each interval of cervical stage
|
Cervical Stages |
Mean PTHrP (pg/mL) ± SD |
SEM |
95.0% Confidence interval for Mean |
Median |
PTHrP (pg/mL) |
||
|
LL |
UL |
Min. |
Max. |
||||
|
C2 – C3 |
20.58 ± 28.21 |
6.65 |
6.55 |
34.60 |
12.09 |
10 |
132 |
|
C3 – C4 |
20.82 ± 27.75 |
6.37 |
7.45 |
34.19 |
11.89 |
10 |
132 |
|
C4 – C5 |
14.20 ± 7.14 |
1.98 |
9.88 |
18.51 |
12.06 |
10 |
36 |
|
C5 – C6 |
13.09 ± 2.60 |
.79 |
11.34 |
14.84 |
12.74 |
10 |
19 |
Kruskal-Wallis test: P = 0.984 (NS)
Table 4B: PTHrP (pg/mL) serum levels of female subjects at each interval of cervical stage
|
Cervical Stages |
Mean PTHrP (pg/mL) ± SD |
SEM |
95.0% Confidence interval for Mean |
Median |
PTHrP (pg/mL) |
||
|
LL |
UL |
Min. |
Max. |
||||
|
C2 – C3 |
17.79 ± 9.17 |
3.47 |
9.31 |
26.27 |
14.04 |
11 |
35 |
|
C3 – C4 |
14.60 ± 5.33 |
1.48 |
11.38 |
17.82 |
12.06 |
10 |
26 |
|
C4 – C5 |
16.45 ± 9.85 |
1.83 |
12.70 |
20.19 |
12.26 |
10 |
45 |
|
C5 – C6 |
16.00 ± 10.21 |
2.04 |
11.79 |
20.21 |
12.31 |
10 |
45 |
Kruskal-Wallis test: P = 0.819 (NS)
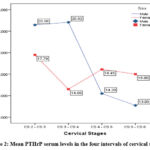 |
Figure 2: Mean PTHrP serum levels in the four intervals of cervical stages. |
To evaluate intergroup comparisons of serum PTHrP levels with different cervical stage intervals, Mann-Whitney U test with Bonferroni’s correction was carried out (Table 5). The results showed none of the variables were statistically significant (Table 5A, Table 5B).
Table 5. Intergroup comparison of PTHrP (pg/mL) serum levels with different cervical stage intervals in both males and females.
|
A. Intergroup comparison of serum PTHrP levels with different cervical stage intervals in males |
B. Intergroup comparison of serum PTHrP levels with different cervical stage intervals in females |
||||
|
Cervical Stage |
Compared Stage |
P Value |
Cervical Stage |
Compared Stage |
P Value |
|
CS 2 – CS 3 |
CS 3 – CS 4 |
0.964 (NS) |
CS 2 – CS 3 |
CS 3 – CS 4 |
0.311 (NS) |
|
CS 4 – CS 5 |
0.767 (NS) |
CS 4 – CS 5 |
0.456 (NS) |
||
|
CS 5 – CS 6 |
0.842 (NS) |
CS 5 – CS 6 |
0.420 (NS) |
||
|
CS 3 – CS 4 |
CS 4 – CS 5 |
0.880 (NS) |
CS 3 – CS 4 |
CS 4 – CS 5 |
0.851 (NS) |
|
CS 5 – CS 6 |
1.000 (NS) |
CS 5 – CS 6 |
0.903 (NS) |
||
|
CS 4 – CS 5 |
CS 5 – CS 6 |
0.608 (NS) |
CS 4 – CS 5 |
CS 5 – CS 6 |
— |
Mann-Whitney U test with Bonferroni’s correction for 10 comparisons, alpha value set at 0.05/6=0.008; (P < 0.008); Sig.: Significant; NS – Not Significant
Discussion
Radiologic biomarkers like hand wrist radiograph, CVMI and MP3 used to assess skeletal maturity are highly subjective techniques with questionable validity and reliability. They lack the ability to determine the intensity & end of growth spurt as also fail to identify the peak in mandibular growth. CVM assessment is based on the morphological changes of the 2nd, 3rd & fourth cervical vertebrae that occurs simultaneously with growth reflecting the initiation and completion of the pubertal growth spurt. However, biological and technical reasons could preclude reproducibility in CV staging. The timing of the growth spurt would also be difficult to assess as one is not aware of what point in time of the CS the lateral cephalometric radiograph was obtained.
These limitations highlighted the need to identify various other non-radiologic biomarkers that could accurately determine the skeletal maturity of an individual and detect the peak in pubertal growth spurt with less ambiguity. Though IGF-1, IGFBP-3 and osteocalcin have been used as potential biomarkers, PTHrP was chosen as available literature on PTHrP in assessing the adolescent growth spurt more particularly in skeletal Class II malocclusion subjects was scarce and non- existent. The comparison of these non-radiologic biomarkers was done with the CVM method as these cervical vertebrae could be readily analyzed in a lateral cephalometric radiograph that is routinely taken for orthodontic diagnosis and treatment planning.
Literature has been evidence of the fact that PTHrP plays a very important role in the eruption of teeth by promoting osteoclast formation above the dental crypt. 23,24 Some authors observed that the chondroblasts differentiated in increased numbers with increase in volume of the cartilage when the mandible was advanced with functional appliances in 35 days old Sprague-Dawley rats and that with increased PTHrP expression levels there was a slowing of chondrocyte hypertrophy and resultant increased growth.25 PTHrP that is synthesized by the chondrocytes & perichondrial cells present at the end of cartilage mold in early fetal life, irrevocably controls endochondral ossification and development of bone. Chondrocytes also synthesize Indian hedgehog (Ihh) required for PTHrP synthesis and differentiation of chondrocytes. Animal experiments in knock-in mouse also confirmed the mechanical regulatory action of PTHrP on subjacent bone cell populations at insertion sites of ligament/tendon & periosteum of endochondral bones.26 The role of PTHrP in the regulation of endochondral bone formation in fetal life and bone remodeling in post natal life has been widely reported.27
Our data revealed that in males the mean PTHrP levels peaked in CS3 with a decline in the levels till CS6 and in females it peaked at CS2 with another less intense peak in CS5. In males, this increase was found in the interval CS2-3 leading upto CS3-CS4 whereas in females this increase was observed in the interval CS2-CS3. Our findings were in tune with the findings of another study where the levels of PTHrP expression & Ihh in hypertrophic chondrocytes was found to be increased in early rather than in the later stages of puberty leading to the speculation that PTHrP and Ihh could both serve as regulators of pubertal growth in humans.28 However, our findings did not correlate with the findings of another study where the human serum PTHrP levels was found to be increased in late rather than in the early stages of puberty.29 The role played by PTHrP in cartilage and bone development has been reiterated time and again in literature.30 Most of the PTHrP functions are either autocrine or paracrine with its classical endocrinal role exhibited only in lactation and in placental maternal‒fetal calcium transport, and in Humoral Hypercalcemia Malignancy syndrome. Mutations in the PTHrP gene is reported to be associated with chondrodysplasia and brachydactyly type E.31 PTHrP signaling has also been documented to regulate a network of downstream events that alter chondrocyte proliferation and differentiation during development.32,33
However, the reportage of PTHrP as a skeletal maturity indicator to determine peak pubertal growth was observed to be scant in orthodontic literature. In adolescence, though we can predict the sequential changes in puberty fairly well, the timing of puberty is however variable. Genetic and environmental factors affect variations in pubertal timing in different ethnic populations.34 Our data revealed that in both the genders, peak PTHrP levels was expressed more so in the pubertal stage of cervical vertebral development.
Several authors35 have reiterated the fact that condylar growth was greatly influenced by PTHrP, Ihh, and SOX 9 transcription factor and that the latter was upregulated by PTHrP. This chain of events seemed to bring about delayed maturation of replicating chondrocytes and promotion of chondroblast differentiation in the condylar cartilage. Animal experiments too have indicated a five-fold PTHrP increase after the advancement of the mandible with functional appliance therapy. Extrapolating these findings to humans it may be construed that commencement of functional appliance therapy in early pubertal stages could enhance condylar cartilage growth in Class II skeletal pattern with retrognathic mandible. It has been reported that in healthy subjects the detected circulating PTHrP with immunoradiometric assay was 2.6 pmol per liter.36 We had used ELISA in our study for its reported analytical specificity and sensitivity and hence our values were also different from that reported in literature. The low values of PTHrP that was observed in our data could be attributed to the hook-effect. Hook effect normally contributes to false-low results primarily due to the presence of excess amount of analyte in single step heterogenous assays particularly Sandwich-ELISA. Nevertheless, this could be negated by serial dilution of the patient’s samples. Owing to the escalating cost that could incur, serial sample dilutions were not performed. This could be a limitation of our study.
CVM, a commonly used skeletal maturity indicator as seen in a lateral cephalogram is also not a perfect rating system. At best it is an imprecise science, ordinal in nature in contrast to the continuous nature of growth process and is also plagued with intra and inter-examiner reliability and high staging subjectivity. However, 3-D Cone Beam Computerized Tomography would yield a much more precise evaluation of the cervical vertebrae in comparison to a 2-D evaluation on a lateral cephalogram.
Longitudinal studies are recommended to highlight the use of this biomarker to precisely estimate the intensity & timing of the pubertal growth spurt. Reference ranges of PTHrP serum levels at different CVM stages pertaining to South Indian population to assess peak pubertal growth could also be considered for future research.
Conclusions
Mean PTHrP serum levels in males witnessed an increase in CS3-4 interval & in females, first CS2 & then CS5 witnessed a spike, exhibiting a pre-pubertal trend in females and a pubertal trend in males.
Comparison of mean PTHrP serum levels in the four intervals of cervical staging showed it being expressed more so in CS2 through to CS4 in males and in CS2-CS3 in females, showing an increase of this biomarker in the pre and pubertal stages in both the sexes.
Conflict of Interest
There is no conflict of interest
Funding Sources
There are no funding sources
References
- Profitt WR, Fields HW. Contemporary Orthodontics. 3rd ed. St. Louis: Mosby-Year Book’s. 29, 156; 2000.
- Franchi L, Baccetti T, McNamara JA Jr. Mandibular growth as related to cervical vertebral maturation and body height. Am J Orthod Dentofacial Orthop. 2000;118(3):335-340. doi:10.1067/mod.2000.107009.
CrossRef - Fishman LS. Radiographic evaluation of skeletal maturation. A clinically oriented method based on hand-wrist films. Angle Orthod. 1982;52(2):88-112. doi:10.1043/0003-3219(1982)052<0088:REOSM>2.0.CO;2.
- Rajagopal R, Kansal S. A comparison of modified MP3 stages and the cervical vertebrae as growth indicators. J Clin Orthod. 2002;36(7):398-406.
- Lamparski DG. Skeletal age assessment utilizing cervical vertebrae. Am J Orthod. 1975;67(4):458-9. doi:10.1016/0002-9416(75)90038-X.
CrossRef - Hassel B, Farman AG. Skeletal maturation evaluation using cervical vertebrae [published correction appears in Am J Orthod Dentofacial Orthop 1995 Jun;107(6):19]. Am J Orthod Dentofacial Orthop. 1995;107(1):58-66. doi:10.1016/s0889-5406(95)70157-5.
CrossRef - Baccetti T, Franchi L, McNamara JA Jr. An improved version of the cervical vertebral maturation (CVM) method for the assessment of mandibular growth. Angle Orthod. 2002;72(4):316-323. doi:10.1043/0003-3219(2002)072<0316:AIVOTC>2.0.CO;2
- Damian MF, Cechinato F, Molina RD, Woitchunas FE. Relationship between cranial and mandibular growth and the stages of maturation of the cervical vertebrae. J Appl Oral Sci. 2007;15(2):115-119. doi:10.1590/s1678-77572007000200008.
CrossRef - Chen LL, Xu TM, Jiang JH, Zhang XZ, Lin JX. Quantitative cervical vertebral maturation assessment in adolescents with normal occlusion: a mixed longitudinal study. Am J Orthod Dentofacial Orthop. 2008;134(6):720.e1-721. doi:10.1016/j.ajodo.2008.03.014.
CrossRef - McNamara JA Jr, Franchi L. The cervical vertebral maturation method: A user’s guide. Angle Orthod. 2018;88(2):133-143. doi:10.2319/111517-787.1.
CrossRef - García-Fernandez P, Torre H, Flores L, Rea J. The cervical vertebrae as maturational indicators. J Clin Orthod. 1998;32(4):221-225.
CrossRef - Baccetti T, Franchi L, Toth LR, McNamara JA Jr. Treatment timing for Twin-block therapy. Am J Orthod Dentofacial Orthop. 2000;118(2):159-170. doi:10.1067/mod.2000.105571.
CrossRef - San Román P, Palma JC, Oteo MD, Nevado E. Skeletal maturation determined by cervical vertebrae development. Eur J Orthod. 2002;24(3):303-311. doi:10.1093/ejo/24.3.303.
CrossRef - Jain N, Tripathi T, Gupta SK, Rai P, Kanase A, Kalra S. Serum IGF-1, IGFBP-3 and their ratio: Potential biochemical growth maturity indicators. Prog Orthod. 2017;18(1):11. doi:10.1186/s40510-017-0165-1.
CrossRef - Gundberg CM, Markowitz ME, Mizruchi M, Rosen JF. Osteocalcin in human serum: a circadian rhythm. J Clin Endocrinol Metab. 1985;60(4):736-739. doi:10.1210/jcem-60-4-736.
CrossRef - Moseley JM, Gillespie MT. Parathyroid hormone-related protein. Crit Rev Clin Lab Sci. 1995;32(3):299-343. doi:10.3109/10408369509084687.
CrossRef - Kronenberg HM. PTHrP and skeletal development. Ann N Y Acad Sci. 2006;1068:1-13. doi:10.1196/annals.1346.002.
CrossRef - Correa D, Hesse E, Seriwatanachai D, et al. Zfp521 is a target gene and key effector of parathyroid hormone-related peptide signaling in growth plate chondrocytes. Dev Cell. 2010;19(4):533-546. doi:10.1016/j.devcel.2010.09.008.
CrossRef - Shibata S, Suda N, Yamazaki K, et al. Mandibular deformities in parathyroid hormone-related protein (PTHrP) deficient mice: possible involvement of masseter muscle. Anat Embryol (Berl). 2000;202(2):85-93. doi:10.1007/s004290000100.
CrossRef - Shibata S, Suda N, Fukada K, Ohyama K, Yamashita Y, Hammond VE. Mandibular coronoid process in parathyroid hormone-related protein-deficient mice shows ectopic cartilage formation accompanied by abnormal bone modeling. Anat Embryol (Berl). 2003;207(1):35-44. doi:10.1007/s00429-003-0325-6.
CrossRef - Ng AF, Yang YO, Wong RW, Hägg EU, Rabie AB. Factors regulating condylar cartilage growth under repeated load application. Front Biosci. 2006;11:949-954. Published 2006 Jan 1. doi:10.2741/1851.
CrossRef - Baccetti T, Franchi L, McNamara JA Jr. The cervical vertebral maturation (CVM) method for the assessment of optimal treatment timing in dentofacial orthopedics. Sem in Orthod 2005;11(3):119–29. doi:https://doi.org/10.1053/j.sodo.2005.04.005.
CrossRef - Philbrick WM, Dreyer BE, Nakchbandi IA, Karaplis AC. Parathyroid hormone-related protein is required for tooth eruption. Proc Natl Acad Sci U S A. 1998;95(20):11846-11851. doi:10.1073/pnas.95.20.11846.
CrossRef - Boabaid F, Berry JE, Koh AJ, Somerman MJ, McCcauley LK. The role of parathyroid hormone-related protein in the regulation of osteoclastogenesis by cementoblasts. J Periodontol. 2004;75(9):1247-1254. doi:10.1902/jop.2004.75.9.1247.
CrossRef - Rabie AB, Tang GH, Xiong H, Hägg U. PTHrP regulates chondrocyte maturation in condylar cartilage. J Dent Res. 2003;82(8):627-631. doi:10.1177/154405910308200811.
CrossRef - Broadus AE, Macica C, Chen X. The PTHrP functional domain is at the gates of endochondral bones. Ann N Y Acad Sci. 2007;1116:65-81. doi:10.1196/annals.1402.061.
CrossRef - Naafs MAB. Parathyroid hormone related peptide (PTHrP): a mini-review. Endocrinol Metab Int J. 2017; 5(6):321-328. doi:10.15406/emij.2017.05.00139.
CrossRef - Kindblom JM, Nilsson O, Hurme T, Ohlsson C, Sävendahl L. Expression and localization of Indian hedgehog (Ihh) and parathyroid hormone related protein (PTHrP) in the human growth plate during pubertal development. J Endocrinol. 2002;174(2):R1-R6. doi:10.1677/joe.0.174r001.
CrossRef - Hussain MZ, Talapaneni AK, Prasad M, Krishnan R. Serum PTHrP level as a biomarker in assessing skeletal maturation during circumpubertal development. Am J Orthod Dentofacial Orthop. 2013;143(4):515-521. doi:10.1016/j.ajodo.2012.11.022.
CrossRef - Martin TJ. Parathyroid Hormone-Related Protein, Its Regulation of Cartilage and Bone Development, and Role in Treating Bone Diseases. Physiol Rev. 2016;96(3):831-871. doi:10.1152/physrev.00031.2015.
CrossRef - Maass PG, Wirth J, Aydin A, et al. A cis-regulatory site downregulates PTHLH in translocation t(8;12)(q13;p11.2) and leads to Brachydactyly Type E. Hum Mol Genet. 2010;19(5):848-860. doi:10.1093/hmg/ddp553.
CrossRef - Hirai T, Chagin AS, Kobayashi T, Mackem S, Kronenberg HM.
Parathyroid hormone/parathyroid hormone-related protein receptor signaling is required for maintenance of the growth plate in postnatal life. Proc Natl Acad Sci U S A. 2011;108(1):191-196. doi:10.1073/pnas.1005011108.
CrossRef - Wang Y, Cheng Z, Elalieh HZ, et al. IGF-1R signaling in chondrocytes modulates growth plate development by interacting with the PTHrP/Ihh pathway. J Bone Miner Res. 2011;26(7):1437-1446. doi:10.1002/jbmr.359.
CrossRef - Floyd B. Can socioeconomic factors account for “atypical” correlations between timing, peak velocity, and intensity of adolescent growth in Taiwanese girls?. Am J Hum Biol. 2000;12(1):102-117. doi:10.1002/(SICI)1520-6300(200001/02)12:1<102::AID-AJHB12>3.0.CO;2-M.
CrossRef - Fraser WD, Robinson J, Lawton R, et al. Clinical and laboratory studies of a new immunoradiometric assay of parathyroid hormone-related protein. Clin Chem. 1993;39(3):414-419.
CrossRef

