
Manuscript accepted on :11-09-2023
Published online on: 01-10-2023
Plagiarism Check: Yes
Reviewed by: Dr. Nicolas Padilla
Second Review by: Dr. Nagham Aljamali
Final Approval by: Dr. Patorn Promchai
Inas R. El-Alameey1,2* , Weam A. Al-Aswad1, Reham M. Khojah1 , Raneem D. Al-Rehaili1 , Lujain A. Al-Saedi1 and Yara S. Al-Buladi1
1Clinical Nutrition Department, College of Applied Medical Sciences, Taibah University, Al Madinah Al Munawara, Saudi Arabia
2Child Health Department, Medical Research and Clinical Studies Institute, National Research Centre, Egypt.
Corresponding Author E-mail:ielalameey@taibahu.edu.sa
DOI : https://dx.doi.org/10.13005/bpj/2718
Abstract
Background and Aim : Type 2 Diabetes Mellitus is a chronic global health condition that affects people of all ages at an alarming rate. It's more widespread in Middle Eastern countries, especially Saudi Arabia which has the second-highest rate of diabetes in the Middle East, according to the World Health Organization. The purpose of the study is to investigate the relationship between dietary habits, lifestyle factors, and dysglycemia among type 2 diabetic patients in Al-Madinah Al-Munawara, Saudi Arabia. Subjects and methods: This cross-sectional study was conducted on 281 type 2 diabetic patients aged between 20 and 65 years old via an online survey. Sociodemographic, anthropometric, dietary habits, physical activity, and other lifestyle data were collected from patients of Al Madinah's King Fahad Hospital in Al Madinah Al Munawara. Results: The highest age group of those surveyed was 41-65 years old. The majority (65.1%) were female. More than half of the surveyed population had university or college-level education. There was no association between family history and gender (p=0.631). There was a significant association between gender and intake of sweets (p= 0.001), red meat (p= 0.002), red tea (p= 0.013), green tea (p= 0.031), and consumption of grains (p= 0.027). Male patients were more active compared to the female group (14.3% vs. 4.9%), (p=0.043). Conclusion: Food habits influenced hyperglycemia. Female hyperglycemic patients had considerably greater rates of insufficient physical activity and sweet consumption. Male dysglycemic patients consumed considerably more red meat and poultry. Future consideration should be given to increasing awareness and knowledge of dietary intake and lifestyle factors and their importance to prevent future complications.
Keywords
Dietary intake; Type 2 diabetes mellitus -dysglycemia- Al-Madinah Al-Munawara- lifestyle
Download this article as:| Copy the following to cite this article: El-Alameey I. R, Al-Aswad W. A, Khojah R. M, Al-Rehaili R. D, Al-Saedi L. A, Al-Buladi Y. S. Relationship Between Dietary Habits, Lifestyle Risk Factors and Dysglycemia Among Patients with Type 2 Diabetes Mellitus in Al Madinah Al Munawara, Saudi Arabia. Biomed Pharmacol J 2023;16(3). |
| Copy the following to cite this URL: El-Alameey I. R, Al-Aswad W. A, Khojah R. M, Al-Rehaili R. D, Al-Saedi L. A, Al-Buladi Y. S. Relationship Between Dietary Habits, Lifestyle Risk Factors and Dysglycemia Among Patients with Type 2 Diabetes Mellitus in Al Madinah Al Munawara, Saudi Arabia. Biomed Pharmacol J 2023;16(3). Available from: https://bit.ly/46yr27c |
Type 2 diabetes mellitus (T2DM) is characterized by chronic hyperglycemia and impaired carbohydrates, lipids, and protein metabolism caused by complete or partial insufficiency of insulin secretion and/or insulin action, which alters the body’s response to glucose utilization normally 1. It is more frequent in Arab nations, particularly those in the Gulf Cooperation Council (GCC), such as Saudi Arabia. The temporal factor’s coefficient suggested that the prevalence rate grew from 1982 to 2015. Saudi Arabia has the highest prevalence of T2DM (32.8%). The prevalence is expected to rise to 35.37% in 2020, 40.37% in 2025, and 45.36% in 2030 2.
T2DM is defined as a combination of insulin resistance (reduced insulin’s ability to stimulate glucose utilization in the body) and reduced insulin secretion. It begins with a resistance to insulin in the cells of the body. Because of this resistance and increased hepatic glucose synthesis, insulin levels are insufficient to normalize plasma glucose levels 3. The risk of disease onset increased based on genetic background and environmental factors. It is one of the key contributors to an increased risk of developing cardiovascular disease and death 4. Many risk factors have been associated with the onset of diseases that affect the body’s ability to deal with glucose. Obesity, dietary habits, smoking, hypertension, family history, and a sedentary lifestyle have all been related to an increased risk of the disease 5. To reduce the disease’s burden, Saudi Arabia’s national health strategy should incorporate diabetes prevention initiatives by raising awareness of all aspects of the disease, including the etiology of T2DM (2). Insulin resistance is believed to be associated with decreased physical activity and obesity 6.
A family history of diabetes, obesity, or hypertension increases the risk of diabetes 7. This is considered the hallmark of T2DM and the main cause of most complications of diabetes, like Retinopathy, Nephropathy, and heart disease. To prevent these microvascular and macrovascular diabetes complications, diabetics can control hyperglycemia through medication and dietary intervention, paying close attention to how much and what they eat. Dietary habits refer to how individuals eat in compliance with the dietary recommendations made by healthcare professionals. It promotes a diet high in fiber and low in salt, as well as the consumption of fish, low-fat meals, omega-3 fatty acids, fruits, and vegetables. Controlling diabetics’ eating patterns can raise HbA1c, which can postpone the onset of diabetes complications 8.
Insufficient data are available regarding dietary habits and lifestyle risk factors among patients with type 2 diabetes mellitus in Al Madinah Al Munawara across diabetic patients aged between 20 and 65 years old. Therefore, the objective of the current study was to determine the association between dietary habits and lifestyle risk factors with dysglycemia and to explore and investigate gender differences in the dietary habits of type 2 diabetes mellitus patients aged 20–65 years old in Al Madinah Al Munawara.
Subjects and methods
Data were gathered for this analytical cross-sectional study via an online questionnaire. Participants were asked to fill out an online survey created via Google Forms and distributed through several social media applications, including WhatsApp, Twitter, and Snapchat. The survey link was sent to relatives, friends, and neighbors to encourage them to participate in the study and share the link with their contacts.
A minimum sample size of 58 male participants and 58 female participants with T2DM was required for this study. The number was estimated based on a two-sided test (alpha 0.01), beta 0.05, and a standardized effect size of 0.80 9. The standard deviation of carbohydrate intake used in the sample size calculation was 4.26g, with a mean of 67.09 10.
Ethical approval for this study was obtained from the Ethical Committee of the College of Applied Medical Sciences at Taibah University in Al-Madinah Al-Munawara with the approval number of 2021/107/203 CLN. All participants provided informed consent through a statement on the questionnaire to be included in the study.
This study recruited patients with T2DM aged between 20 and 65 years in Al-Madinah, Saudi Arabia. We excluded type 2 diabetic patients in the ICU and provided incomplete data. Dysglycemia in type 2 diabetic patients was diagnosed using a cutoff point of HbA1c 6.5% 11.
The data was collected between October 1, 2021, and January 27, 2022. The online survey included socio-demographic data including gender, age, anthropometrics, educational level, employment status, the region of residence, and family income. Other data includes information about family history of diabetes, hypertension, dyslipidemia, recorded HbA1c, duration of illness, physical activity level and patterns of exercise, smoking status, and sleeping duration.
Anthropometric data includes weight and height to calculate BMI. BMI describes a person’s nutritional status by comparing their weight (kg) with the square of their height (m2).
Dietary data have been collected via food frequency questions from all participants via the survey to estimate the participant’s dietary intake. It includes the number of each food group and their consumption (fruits, vegetables, grains (starch), meat and poultry, etc.), frequency of added sugar and honey consumption, number of meals and the type of beverages they consume, frequency of desserts and snack consumption, and adherence to the diet.
A scientifically designed and validated questionnaire that has previously been used in a study in Saudi Arabia served as the data gathering method 12. By doing so, we can help customers receive the most precise diagnoses and efficient therapies, which will enhance patient outcomes and engagement.
No personal information was required, and all those included in the study were anonymous. The online questionnaire consisted of 40 questions. The questionnaire included data regarding the sociodemographic, anthropometric, and dietary intake of adults, which included food frequency questions and specified carbohydrate intake.
Statistical Analysis
The data was entered into Microsoft Excel, which cleaned it all up for analysis. Variables were then imported into SPSS (Statistical Package for Social Sciences, version 26) for statistical analysis. The Kolmogorov-Smirnov test was applied to determine the nature of continuous data distribution. The relationship between demographic characteristics, anthropometric measurements, and dietary intake variables was analyzed using the Fisher exact test. Multinominal Logistic regression models were used to assess the association between significant dietary variables and dysglycemia among male and female patients with type 2 diabetes mellitus. The Odds Ratio (OR) and 95% Confidence Interval (CI) were obtained from the regression model. The means of all continuous variables such as BMI, height, and weight were compared among males and females using the Mann-Whitney U test. A P-value <0.05 was considered statistically significant, and all the tests were two-sided.
Results
Descriptive socio-demographics, anthropometric measurement and baseline characteristics among female and male T2DM patients were analyzed. The study included 281 adult patients aged between 20 and 65. The highest age group of those surveyed was 41–65. The majority (n = 183; 65.12%) were females. More than half of the surveyed population had university- or college-level education. More than 30% of the male and female participants reported that they earned an income of more than 10,000 SAR (female = 30.1%, male = 43.9%). The mean BMI of those surveyed was 29.4 ± 10 kg/m2, the mean height was 160 ± 15.7 cm, and the mean weight was 102± 47 kg. There was a significant difference in BMI and height between the male and female groups of patients (Table 1).
In both male and female patients, most of them had a history of T2DM (77% and 74.5%). There was no significant difference in the family history by gender (p=0.631). Of female participants, 19.1% had been suffering from T2DM for 20 or more years, compared to 17.3% in males. A total of 132 patients were suffering from T2DM for less than 10 years. Most of the patients, both male and female, had received education about T2DM. There was a significant association found between male and female patients regarding their physical activity (p = 0.043). Male patients were more active in physical activity compared to the female group (60.2% and 47.5%, respectively). Only 14.3% of males and 4.9% of females were doing more than two hours of physical activity per week.
Of the total male patients, 27.5% were smokers, among whom 21.4% had been smoking for more than 5 years. There was a significant association between smoking status and the gender of T2DM patients. In terms of T2DM patients’ sleeping patterns, 88.6% slept for less than 8 hours. Of female patients, 27.5% were hospitalized in the past five years. Most of the male and female patients had normal blood pressure which was significant (p = 0.003, female = 74.7%, male = 69.2%). There was no significant difference observed in the HbA1C level or cholesterol among the male and female T2DM patients (Table 1& Figure 1).
A questionnaire method was used to assess the patients’ dietary intake. There was a significant association between gender and intake of sweets (p= 0.001), red meat (p= 0.002), red tea (p= 0.013), green tea (p= 0.031), and consumption of grains (p= 0.027). Of the total participants, 67.2% were committed to taking a diabetic diet. Most of the male and female patients were eating 1 to 3 snacks between the main meal similarly most of the patients were most likely consuming fruits 1 to 3 times a week including dates. There was no significant difference in vegetable and whole-grain consumption in male and female patients. Red meat consumption was higher in male patients; 71.4% of them were eating red meat 1-3 times a week, and 18.4% were eating it more than 4 times a week. There was no significant difference in poultry products, seafood, processed foods, or natural juice between male and female participants. More than half of the participants did not drink green tea, and most of them were drinking red tea. Male patients were drinking more black tea than female patients. There was no significant difference in the consumption of other types of coffee, sugar, honey, or carbohydrates among the two comparative groups of patients. There was a significant association with grain consumption among male and female patients. A total of 199 patients consumed 1–3 grains per week, most of them were female patients (Table 2) (Figure2).
All the significant factors found to be associated with dysglycemic patients were analyzed using logistic regression. In the multinominal logistic regression model, sweet consumption (OR=2.928; CI: 1.618 – 5.299) was the strongest factor associated with type 2 diabetes mellitus in dysglycemic females. Patients lacking physical activity were higher in females compared to males (OR=1.497; CI: 0.888 – 2.522), while red meat (OR=5.400; CI:2.049 – 14.231), and poultry consumption were significantly higher in male patients (OR= 3; CI: 1.180 – 7.627). Sweet consumption was associated with 2.928 increased odds in female patients compared to males(Table 3).
Table 1: Comparison between female and male type 2 diabetic patients as regards their sociodemographic, anthropometric measurement, and other baseline characteristics (n = 281).
|
Variables |
Female patients n=183 |
Male patients n=98 |
Total |
p- values |
|
n (%) |
n (%) |
|||
|
Age |
||||
|
20-40 years |
54 (29.5%) |
27 (27.6%) |
81 |
0.73 |
|
41-65 years |
129 (70.5%) |
71 (72.4%) |
200 |
|
|
Education level |
||||
|
Illiterate |
26 (14.2%) |
6 (6.1%) |
32 |
0.005** |
|
Elementary school |
36 (19.7%) |
10 (10.2%) |
46 |
|
|
High school |
21 (11.5%) |
22 (22.4%) |
43 |
|
|
University/college degree |
100 (54.6%) |
60 (61.2%) |
160 |
|
|
Income per month |
||||
|
<SAR 3000 |
38 (20.8%) |
10 (10.2%) |
48 |
0.013* |
|
SAR3000-6000 |
42 (23%) |
28 (28.6%) |
70 |
|
|
SAR7000-10000 |
48 (26.2%) |
17 (17.3%) |
65 |
|
|
>SAR10000 |
55 (30.1%) |
43 (43.9% |
98 |
|
|
Family history of type 2 diabetes mellitus |
||||
|
No |
42 (23%) |
25 (25.5%) |
67 |
0.631 |
|
Yes |
141 (77%) |
73 (74.5%) |
214 |
|
|
Years of suffering from type 2 diabetes mellitus |
||||
|
< 10 years |
84 (45.9%) |
48 (49%) |
132 |
0.874 |
|
10-19 years |
64 (35%) |
33 (33.7%) |
97 |
|
|
≥20 years |
35 (19.1%) |
17 (17.3%) |
52 |
|
|
Educated regarding type 2 diabetes mellitus |
||||
|
No |
39 (21.3%) |
21 (21.4%) |
60 |
0.982 |
|
Yes |
144 (78.7%) |
77 (78.6%) |
221 |
|
|
Physical activity |
||||
|
No |
96 (52.5%) |
39 (39.8%) |
135 |
0.043* |
|
Yes |
87 (47.5%) |
59 (60.2%) |
146 |
|
|
Physical activity hours/week |
||||
|
No |
70 (38.3%) |
29 (29.6%) |
99 |
0.042* |
|
Half an hour or less |
56 (30.6%) |
30 (30.6%) |
86 |
|
|
1 -2 hours |
48 (26.2%) |
25 (25.5) |
73 |
|
|
> 2 hours |
9 (4.9%) |
14 (14.3%) |
23 |
|
|
Smoking history |
||||
|
< 5 years |
4 (2.2%) |
6 (6.1%) |
10 |
<0.001** |
|
≥5 years |
175 (95.6%) |
21 (21.4%) |
25 |
|
|
Not applicable |
175 (95.6%) |
71 (72.4%) |
246 |
|
|
Sleeping pattern |
||||
|
< 8 hours per day |
166 (90.7%) |
83 (84.7%) |
249 |
0.130 |
|
≥ 8 hours per day |
17 (9.3%) |
15 (15.3%) |
32 |
|
|
Hospitalized in the past 5 years |
||||
|
Yes |
49 (27.5%) |
15 (16.5%) |
64 |
0.044* |
|
No |
129 (72.5%) |
76 (83.5%) |
205 |
|
|
Blood pressure |
||||
|
More than 150/90 |
30 (16.9%) |
8 (8.8%) |
38 |
0.003** |
|
Normal value 120/80 |
133 (74.7%) |
63 (69.2%) |
196 |
|
|
Less than 120/80 |
15 (8.4%) |
20 (22.0%) |
35 |
|
|
HbA1c level in the past three months |
||||
|
7%-10% |
83 (46.6%) |
34 (37.4%) |
117 |
0.347 |
|
> 10% |
21 (11.8%) |
13 (14.3%) |
34 |
|
|
Not performed |
74 (41.6%) |
44 (48.4%) |
118 |
|
|
Serum cholesterol level |
||||
|
≥200 mg/dl |
27 (15.2%) |
12 (13.2%) |
39 |
0.586 |
|
< 200 mg/dl |
41 (23.0%) |
17 (18.7%) |
58 |
|
|
Not performed |
110 (61.8%) |
62 (68.1%) |
172 |
|
|
Anthropometric measurements |
Female |
Male |
Total Participant Mean ±SD |
p -values |
|
Mean ±SD |
||||
|
BMI |
29.36 ± 7.74 |
29.9 ± 6.23 |
29.48 ± 10 |
<0.001* |
|
Height |
156 ± 12.78 |
169 ± 17.3 |
160.39 ± 15.69 |
<0.001* |
|
Weight |
115 ± 55.5 |
78.6 ± 19.0 |
102.11± 47.77 |
0.066* |
*Significant difference at P < 0.05, **highly significant difference at P≤ 0.01.
Table 2: Comparison between female and male type 2 diabetic patients as regards of their dietary habits.
|
Variables |
Categories |
Female patients |
Male patients |
Total |
P- values |
|
How committed are you to the diabetic diet? |
Committed |
128 (70%) |
61 (62.2%) |
189 |
0.189 |
|
Not Committed |
55 (30%) |
37 (37.8%) |
92 |
||
|
How often do you eat snacks between the main meal in the day? |
No |
70 (38.3%) |
34 (43.7%) |
104 |
0.714 |
|
1-3 times |
107 (58.5%) |
62 (63.3%) |
169 |
||
|
4 times or more |
6 (3.3%) |
2 (2%) |
8 |
||
|
How many times a week do you eat sweets? |
No |
30 (16.4%) |
34 (34.7%) |
64 |
0.001** |
|
1-3 times |
124 (67.8%) |
48 (49%) |
172 |
||
|
4 times or more |
29 (15.8%) |
16 (16.3%) |
45 |
||
|
How many times a week do you eat fruit including dates?
|
No |
26 (14.2%) |
9 (9.2%) |
35 |
0.136 |
|
1-3 times |
99 (54.1%) |
47 (48%) |
146 |
||
|
4 times or more |
58(31.7%) |
42 (42.9%) |
100 |
||
|
How many times do you eat vegetables in a week? |
No |
14 (7.7%) |
6 (6.1%) |
20 |
0.727 |
|
1-3 times |
83 (45.4%) |
49 (50%) |
132 |
||
|
4 times or more |
86 (47%) |
43 (43.9%) |
129 |
||
|
How many times do you eat red meat per week? |
No |
45 (24.6%) |
10 (10.2%) |
55 |
0.002** |
|
1-3 times |
123 (67.2%) |
70 (71.4%) |
193 |
||
|
4 times or more |
15 (8.2%) |
18 (18.4%) |
33 |
||
|
How many times do you eat poultry in a week? |
No |
9 (4.9%) |
3 (3.1%) |
12 |
0.173 |
|
1-3 times |
114 (62.3%) |
52 (53.1%) |
166 |
||
|
4 times or more |
60 (32.8%) |
43 (43.9%) |
103 |
||
|
How many times do you eat seafood in a week? |
No |
81 (44.3%) |
41 (41.8%) |
122 |
0.775 |
|
1-3 times |
98 (53.6%) |
56 (57.1%) |
154 |
||
|
4 times or more |
4 (2.2%) |
1 (1%) |
5 |
||
|
How many times do you consume natural juices per week? |
No |
112 (61.2%) |
49 (50%) |
161 |
0.127 |
|
1-3 times |
58 (31.7%) |
43 (43.9%) |
101 |
||
|
4 time or more |
13 (7.1%) |
6 (6.1%) |
19 |
||
|
How many times do you consume for processed juices per week? |
No |
108 (59%) |
57 (58.2%) |
165 |
0.278 |
|
1-3 times |
61 (33.3%) |
28 (28.6%) |
89 |
||
|
4 time or more |
14 (7.7%) |
13 (13.3%) |
27 |
||
|
How many times do you consume black tea in a week? |
No |
48 (26.2%) |
12 (12.2%) |
60 |
0.013* |
|
1-3 times |
62 (33.9%) |
33 (33.7%) |
95 |
||
|
4 times or more |
73 (39.9%) |
53 (54.1%) |
126 |
||
|
How many times do you consume green tea in a week? |
No |
106 (57.9%) |
42 (42.9%) |
148 |
0.031* |
|
1-3 times |
52 (28.4%) |
33 (33.7%) |
85 |
||
|
4 times or more |
25 (13.7%) |
23 (23.5%) |
48 |
||
|
How many times do you consume Arabic coffee in a week? |
No |
37 (20.2%) |
21 (21.4%) |
58 |
0.729 |
|
1-3 times |
49 (26.8%) |
22 (22.4%) |
71 |
||
|
4 times or more |
97 (53%) |
55 (56.1%) |
152 |
||
|
How many times do you consume other types of coffee per week? |
No |
109 (59.6%) |
54 (55.1%) |
163 |
0.265 |
|
1-3 times |
47 (25.7%) |
22 (22.4%) |
69 |
||
|
4 times or more |
27 (14.8%) |
22 (22.4%) |
49 |
||
|
How many times do you consume can of soft drink/energy per week? |
No |
120 (65.6%) |
61 (62.2%) |
181 |
0.238 |
|
1-2 cans |
47 (25.7%) |
22 (22.4%) |
69 |
||
|
More than 3 cans |
16 (8.7%) |
15 (15.3%) |
31 |
||
|
How many times do you consume a spoonful of sugar per day? |
No |
90 (49.2%) |
44 (44.9%) |
134 |
0.067 |
|
1-3 small spoons |
74 (40.4%) |
34 (34.7%) |
108 |
||
|
More than 3 small spoons |
19 (10.4%) |
20 (20.4%) |
39 |
||
|
How many times do you eat honey in a week?? |
No |
124 (67.8%) |
58 (59.2%) |
182 |
0.077 |
|
1-3 small spoons |
52 (28.4%) |
30 (30.6%) |
82 |
||
|
More than 3 small spoons |
7 (3.8%) |
10 (10.2%) |
17 |
||
|
How many times do you eat carbohydrates per day? |
No |
12 (6.6%) |
9 (9.2%) |
21 |
0.182 |
|
1-3 times |
130 (71%) |
59 (60.2%) |
189 |
||
|
4 times or more |
41 (22.4%) |
30 (30.6%) |
71 |
||
|
How many times do you consume grains per week? |
No |
43 (23.5%) |
20 (20.4%) |
63 |
0.027* |
|
1-3 times |
133 (72.7%) |
66 (67.3%) |
199 |
||
|
4 times or more |
7 (3.8%) |
12 (12.2%) |
19 |
*Significant difference at P < 0.05, **highly significant difference at P≤ 0.01.
Table 3: Multinominal Logistic Regression analysis for the associated factors of type 2 Diabetes in female and male patients.
|
Variables |
Females group OR (95% CI) |
Males group OR (95% CI) |
p-value |
|
Physical activity |
|||
|
No 1.497 (0.888 – 2.522) 0.038 (0.396 – 1.126) 0.038* |
|||
|
Yes |
— |
— |
|
|
Sweets |
|||
|
1-3 times |
2.928 (1.618 – 5.299) |
0.342 (0.189 – 0.618) |
<0.001* |
|
4 or more |
2.054 (0.939 – 4.496) |
0.487 (0.222 – 1.066) |
0.072 |
|
No |
— |
— |
|
|
Red Meat |
|
|
|
|
1-3 times |
0.390 (0.185 – 0.823) |
2.561 (1.215 – 5.397) |
0.013* |
|
4 or more |
0.185 (0.070 – 0.488) |
5.400 (2.049 – 14.231) |
0.001** |
|
No |
— |
— |
|
|
Poultry |
|||
|
1-3 times |
0.483 (0.186 – 1.254) |
2.071 (0.797 – 5.382) |
0.135 |
|
4 or more |
0.333 (0.131 – 0.847) |
3.0 (1.180 – 7.627) |
0.021* |
|
No |
— |
— |
|
OR : Odds Ratio ; CI : Confidence Interval.
*Significant difference at P < 0.05, **Highly significant difference at P≤ 0.01.
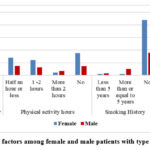 |
Figure 1: Lifestyle factors among female and male patients with type 2 diabetes mellitus. |
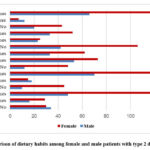 |
Figure 2: Comparison of dietary habits among female and male patients with type 2 diabetes mellitus. |
Discussion
In view of the high prevalence of type 2 diabetes mellitus in Saudi Arabia, analyzing the associated dietary habits with the condition is required to prevent dysglycemia. Sex differences in dietary habits may play a role. In this study, we aimed to explore the association between dietary habits and other lifestyle factors and dysglycemia in male and female type 2 diabetic adult patients in Al-Madinah Al-Munawara. Blood sugar control is crucial for diabetics, and choosing foods and beverages that optimize healthy blood sugar control is crucial.
In our study, most of the patients exceeded the HbA1c level by more than 7%. A previous study reported that the most common risk factors that might be used to identify those who were most at risk of developing dysglycemia included high age, abdominal obesity, BMI, decreased physical activity, smoking status, and low vegetable intake 12,13. In this study’s gender comparison, physical activity was significantly lower in female patients.
Among the lifestyle factors, male patients were more active compared to the female group, and a lower percentage of both males and females were doing more than two hours of physical activity per week. This was in line with the study conducted on the Saudi population 13. They reported that, in male patients, dysglycemia was linked to decreased physical activity. In male patients, it served as a dysglycemia predictor. According to the study, physical activity has a significant protective impact on dysglycemia. The interplay between insulin sensitivity and insulin resistance plays a key role in the development and persistence of the diabetic state, which can be directly linked to levels of physical activity. This association could be explained by how exercise improves insulin sensitivity 14. Markers of vascular inflammation and insulin resistance decreased when obese individuals lost body weight through lifestyle changes. For obese people, exercise training is a crucial part of changing their way of life 15. The smoking history was significantly higher in male patients compared to female patients. Smoking promotes the transition from normoglycemia to impaired glucose tolerance status, possibly by inducing the onset of insulin resistance, which raises smokers’ risk of developing diabetes 16.
Among the investigated dietary habits, intake of sweets, red meat, red tea, green tea, and grains was significantly different among male and female patients. Sweet intake was higher in female patients. Red meat was associated with type 2 diabetes in male patients in this study. Our finding was consistent with another study 17. Red meat was a significant predictor of dysglycemia in male type 2 diabetic patients. Agreeing with our study findings, several international studies have explained that red meat consumption is a significant risk factor for dysglycemia 18,19. Poultry consumption in dysglycemic patients in our study was found to be higher in female patients 20. In their meta-analysis, they found that poultry consumption is not associated with type 2 DM, at least when used unprocessed. However, additional analyses are warranted to clearly define the risk factors associated with the different meat types and processed and unprocessed meat.
Opting for calorie-free or very-low-calorie beverages like unsweetened tea over sugary beverages like sweetened coffee drinks is an excellent way to optimize diabetic control 21. In our study, the consumption of red and green tea was higher in male patients compared to female patients. According to a meta-analysis, daily tea consumption (3 cups/day) is associated with a lower risk of type 2 DM 22.
The large sample size and the selection of 281 online scenarios were two of the study’s primary strengths. We acknowledge that the cross-sectional design of the study limited our ability to investigate “cause-effect” linkages. Furthermore, data obtained only once may be subject to recall bias and seasonal volatility. Second, because our data was based on self-reported food and lifestyle habits, reporting inaccuracies is to be expected. This is true of all similar articles that rely on surveys to gather data.
Conclusion and future direction
In our study, food habits among the adult Saudis studied influenced dysglycemia. Female hyperglycemic patients had considerably greater rates of insufficient physical activity and sweets consumption. Male dysglycemic patients consumed considerably more red meat and poultry. Future consideration should be given to increasing awareness of dietary habits and the importance of physical activity among females through in-clinic education sessions using flyers that include information about what exercises can be performed and include basic information for patients with type 2 diabetes mellitus to understand the disease and how to prevent future complications.
Competing Interests
The authors have declared that there is no existence of competing interests.
Funding Source
There is no funding sources.
References
- Thelin, A.; Holmberg, S. Type 2 Diabetes and Lifestyle-A Prospective Population-Based Cohort Study among Rural Men. Int. J. Diabetes Clin. Res. 2014, 1, 2–5. [CrossRef]
- Meo S. A. Prevalence and future prediction of type 2 diabetes mellitus in the Kingdom of Saudi Arabia: a systematic review of published studies. The Journal of the Pakistan Medical Association. 2016;66(6):722–725. [PubMed] [Google Scholar] [Ref list]
- Roden M., Shulman G.I. The integrative biology of type 2 diabetes. Nature. 2019;576:51–60. doi: 10.1038/s41586-019-1797-8. [PubMed] [CrossRef] [Google Scholar] [Ref list]
- Yeboah, J., Bertoni, A. G., Herrington, D. M., Post, W. S., & Burke, G. L. (2011). Impaired Fasting Glucose and the Risk of Incident Diabetes Mellitus and Cardiovascular Events in an Adult Population. Journal of the American College of Cardiology, 58(2), 140–146. https://doi.org/10.1016/j.jacc.2011.03.025
- Manas Chacko, 1 P. Sankara Sarma, Sivadasanpillai H, ,2 Geevar Z, and Panniyammakal J (2020). Family history of cardiovascular disease and risk of premature coronary heart disease: A matched case-control study. Wellcome Open Res. 5: 70. Published online 2020 Jun 12. doi: 10.12688/wellcomeopenres.15829.2 PMCID: PMC7256470
- Buscemi S, Nicolucci A, Mattina A, Rosafio G, Massenti F, Lucisano G, et al. (2013). Association of dietary patterns with insulin resistance and clinically silent carotid atherosclerosis in apparently healthy people. Eur J Clin Nutr.;67(12);1284-90.
- Sreenivasamurthy L (2021). Evolution in Diagnosis and Classification of Diabetes.
Department of Medicine, Journal of Diabetes Mellitus > Vol.11 No.5, DOI: 10.4236/jdm.2021.115017 - Worku A, Solomon M , Molla M, Wassie A (2015). Dietary practice and associated factors among type 2 diabetic patients: a cross sectional hospital-based study, Addis Ababa, Ethiopia. Springerplus. 2015; 4: 15. Published online 2015 Jan 13. doi: 10.1186/s40064-015-0785-1 PMCID: PMC4306673. PMID: 25635244.
- Senadheera P, Anuruddhika S. Sagarika E, and Chandanie W(2016) :Dietary Habits of Type 2 Diabetes Patients: Variety and Frequency of Food Intake. Hindawi Publishing Corporation; Journal of Nutrition and Metabolism Volume 2016, Article ID 7987395, 6 pages. http://dx.doi.org/10.1155/2016/7987395
- Al-Mssallem, M. Q., Al-Qarni, A. A., & Al-Jamaan, M. (2020). Dietary carbohydrate intake in patients with type 2 diabetes mellitus and diabetes control: a cross-sectional study. Food & Nutrition Research, 64(0). https://doi.org/10.29219/fnr.v64.4751
- American Diabetes Association. Diagnosis and classification of diabetes mellitus. Diabetes Care. 2011;34(Suppl. 1):S62-S69. doi:10.2337/dc11-S062.
- Jambi, H., Enani, S., Malibary, M., Bahijri, S., Eldakhakhny, B., Al-Ahmadi, J., Al Raddadi, R., Ajabnoor, G., Boraie, A., &Tuomilehto, J. (2020). The Association Between Dietary Habits and Other Lifestyle Indicators and Dysglycemia in Saudi Adults Free of Previous Diagnosis of Diabetes. Nutrition and Metabolic Insights, 13, 117863882096525. https://doi.org/10.1177/1178638820965258
- Bahijri, S., Al‐Raddadi, R., Ajabnoor, G., Jambi, H., Al Ahmadi, J., Borai, A., Barengo, N. C., &Tuomilehto, J. (2020). Dysglycemia risk score in Saudi Arabia: A tool to identify people at high future risk of developing type 2 diabetes. Journal of Diabetes Investigation, 11(4), 844–855. https://doi.org/10.1111/jdi.13213
- Yajuan L, Rui F, Zhujing H, Jiatian L, Xiaolei Y, Ying Z, Yunlong X (2022).The Association Between Physical Activity and Insulin Level Under Different Levels of Lipid Indices and Serum Uric Acid. Front Physiol. 2022; 13: 809669. Published online 2022 Feb 2. doi: 10.3389/fphys.2022.809669. PMCID: PMC8847671.PMID: 35185617
- Ryan, A. S., Ge, S., Blumenthal, J. B., Serra, M. C., Prior, S. J., & Goldberg, A. P. (2014). Aerobic Exercise and Weight Loss Reduce Vascular Markers of Inflammation and Improve Insulin Sensitivity in Obese Women. Journal of the American Geriatrics Society, 62(4), 607–614. https://doi.org/10.1111/jgs.12749
- Campagna, D., Alamo, A., Di Pino, A., Russo, C., Calogero, A. E., Purrello, F., &Polosa, R. (2019). Smoking and diabetes: dangerous liaisons and confusing relationships. Diabetology & Metabolic Syndrome, 11(1), 85. https://doi.org/10.1186/s13098-019-0482-2
- Sami W, Ansari T, Butt NS, & Hamid, MA. (2017). Effect of diet on type 2 diabetes mellitus: A review. International Journal of Health Sciences (Qassim), 11(2), 65–71.
- Steinbrecher, A., Erber, E., Grandinetti, A., Kolonel, L. N., &Maskarinec, G. (2011). Meat consumption and risk of type 2 diabetes: the Multiethnic Cohort. Public Health Nutrition, 14(4), 568–574. https://doi.org/10.1017/S1368980010002004
- Pan A, Sun Q, Bernstein A M, Schulze MB, Manson J E, Willett, W C, & Hu FB. (2011). Red meat consumption and risk of type 2 diabetes: 3 cohorts of US adults and an updated meta-analysis. The American Journal of Clinical Nutrition, 94(4), 1088–1096. https://doi.org/10.3945/ajcn.111.018978
- Feskens, E. J. M., Sluik, D., & van Woudenbergh, G. J. (2013). Meat consumption, diabetes, and its complications. Current Diabetes Reports, 13(2), 298–306. https://doi.org/10.1007/s11892-013-0365-0
- Fu, Q.-Y., Li, Q.-S., Lin, X.-M., Qiao, R.-Y., Yang, R., Li, X.-M., Dong, Z.-B., Xiang, L.-P., Zheng, X.-Q., Lu, J.-L., Yuan, C.-B., Ye, J.-H., & Liang, Y.-R. (2017). Antidiabetic Effects of Tea. Molecules (Basel, Switzerland), 22(5). https://doi.org/10.3390/molecules22050849
- Yang J, Mao QX, Xu HX, Ma X, & Zeng CY. (2014). Tea consumption and risk of type 2 diabetes mellitus: a systematic review and meta-analysis update. BMJ Open, 4(7), e005632. https://doi.org/10.1136/bmjopen-2014-005632

