
Manuscript accepted on :09-01-2023
Published online on: 21-07-2023
Plagiarism Check: Yes
Reviewed by: Dr. Hany Akeel
Second Review by: Dr. Nagham Aljamali
Final Approval by: Dr. Anton R Kiselev
Anuradha Vashishtha1* , Anuja Kumar Acharya2 and Sujata Swain3
School of computer engineering, KIIT University, Bhubaneshwar, India.
Corresponding Author E-mail: er.anuradhavashishtha30@gmail.com
DOI : https://dx.doi.org/10.13005/bpj/2739
Abstract
Alzheimer's disease is a neurodegenerative brain disease that kills neurons. The global prevalence of the disease is gradually growing. In all leading countries, it is one of the senior citizens' leading causes of death. So, much research shows that early detection of illness is the most critical factor in improving patient care and treatment outcomes. Currently, AD is diagnosed by the manual study of magnetic resonance imaging, biomarker tests, and cognitive tests. Machine learning algorithms are used for automatic diagnosis. However, they have certain limits in terms of accuracy. Another issue is that models trained on class-unbalanced datasets often have poor results. Therefore, the main objective of the proposed work is to include a pre-processing method before the hybrid model to improve classification accuracy. This research presents a hybrid model based on a deep learning approach to detect Alzheimer’s disease. Which, we are using the SMOTE method to equally distribute the classes to prevent the issue of class imbalance. The hybrid model uses Inception V3 and Resnet50 to detect characteristics of Alzheimer's disease from magnetic resonance imaging. Finally, a dense layer of convolution neural network is used for classification. The hybrid approach achieves 99% accuracy in classifying MRI datasets, which is better than the old work. These results are better than existing approaches based on accuracy, specificity, sensitivity, and other characteristics.
Keywords
Alzheimer's disease (AD); Convolution neural network (CNN); InceptionV2, ResNet50; Magnetic resonance imaging (MRI).
Download this article as:| Copy the following to cite this article: Vashishtha A, Acharya A. K, Swain S. Hybrid Model: Deep Learning Method for Early Detection of Alzheimer’s Disease from MRI Images. Biomed Pharmacol J 2023;16(3). |
| Copy the following to cite this URL: Vashishtha A, Acharya A. K, Swain S. Hybrid Model: Deep Learning Method for Early Detection of Alzheimer’s Disease from MRI Images. Biomed Pharmacol J 2023;16(3). Available from: https://bit.ly/44EErtZ |
Introduction
Alzheimer’s disease is a prevalent form of dementia. This degenerative brain disease destroys brain cells and causes the ability to deteriorate a patient’s behavior, thinking, and social activity 1. According to previous research, one out of 85 people will be affected by Alzheimer’s disease by the year 2050 2. In the early stages of Alzheimer’s disease, it is critical to detect the disease and implement preventative measures. MRI, PET, and CT can be used to identify and predict AD; however, MRI is the most used neuroimaging modality for diagnosing AD patients. Early identification of this illness is being investigated to reduce aberrant brain degeneration, lower medical costs, and provide effective therapy. Recent research suggests that early intervention and diagnosis are critical to treating Alzheimer’s. Many new diagnostic criteria reflect how neuroimaging approaches depend more on dementia diagnosis. Using deep learning, neuroimaging improves diagnostic accuracy for various subtypes of dementia. Deep learning is a subtype of machine learning in artificial intelligence that enables the computer to learn categorization tasks from raw data due to the network’s many-layered and ordered structures. CNNs are employed in neural networks to extract high-level features from picture classification and prediction. They are also the most widely used deep learning technique due to their high success rate in image analysis and classification.
Deep learning is gaining popularity because it may one day be used to diagnose Alzheimer’s. Deep learning algorithms are increasingly used to diagnose Alzheimer’s. This aids in treatment decisions. Farooq et al. 8 used a convolutional network to classify sMRI images for diagnosing Alzheimer’s disease, its prodromal stages, MCI and LMCI, and healthy people. ADNI was used to obtain the data from the experiments. The GM images were first made from the photos. Then they were sent to the CNN network. Deep GoogleNet and ResNet models were used to train and test the network. The networks are trained for 100 epochs on the data, with each epoch containing 100 batches. All experiments are done by splitting the data into 75% and 25% training and testing sets, respectively. GoogleNet (22 layers) has the highest accuracy of 98.88 percent, while ResNet-18 has 98.01%, and ResNet-152 has 98.14 percent.
Y. Gupta 3 and his colleagues used data from the Alzheimer’s disease Neuroimaging Initiative (ADNI) and the National Research Center for Dementia (NRCD) to develop a method to distinguish people with Alzheimer’s disease (AD) from healthy people. 96% precision was achieved in classifying patients with Alzheimer’s disease versus healthy people using characteristics from MRI scans from the cortical, subcortical, and hippocampus areas (HC). Ahmed 4 and his colleagues received excellent feedback on their idea of using an ensemble CNN model for both the feature extractor and the SoftMax classifier. In MRI scans, the left and right hippocampus regions are used to avoid overfitting and obtain an accuracy rate of 90.05 percent, which is very good.
C. Ge et al. 5 developed a 3D multiscale deep learning architecture that could help people learn about AD. The system had a test accuracy of about 93.53 percent on a random brain scan-partitioned dataset, with an average accuracy of about 87.24 percent when it looked at the brain scans. Afzal et al. 6 employ data augmentation to overcome the class imbalance problem in identifying Alzheimer’s disease, attaining a classification precision of 98.41% in a single view and 95.111 in a 3D view of the OASIS dataset. According to R. Y. Janghel and R. Janghel K. Rathore 7, a pre-trained VGG16 should search the ADNI database for Alzheimer’s disease symptoms. SVM, Linear Discriminate, K means clustering, and a decision tree was used to categorize. They get functional MRI pictures that are 99.95% accurate and PET images that are 73.46% accurate, which is about the same.
The literature review is summarized in TABLE I. According to the literature, there are a variety of machine and deep learning algorithms for AD categorization. However, the significant model parameter and class imbalance remain a problem in the multi-class AD classification. To overcome this problem, we presented a Hybrid model with fewer parameters. We used the SMOTE approach to properly detect the early stages of AD to correct data class imbalance.
Table 1: Lists the most recent AD-classification techniques, including the classification method, class, dataset, and detection accuracy. Traditional computer vision techniques are used in some approaches, while deep and machine learning is used in others.
|
Author |
Year | Technique | Dataset | Classification | Accuracy % |
|
Farooq et al. 8 |
2017 | GoogleNet, ResNet | ADNI | NC vs. MCI vs. LMCI vs. AD | 97 |
|
Wang et al. 9 |
2018 |
CNN |
OASIS |
AD vs. CN |
95 |
|
Liu et al. 10 |
2018 |
CNN |
ADNI |
AD vs. CN MCI vs. CN |
94 73 |
|
Y. Gupta et al. 3 |
2019 |
Combine feature technique |
ADNI |
AD vs. HC |
96 |
|
S. Ahmed et al. 4 |
2019 |
Ensemble model |
ADNI |
AD vs. HC |
94 |
|
C. Ge et al. 5 |
2019 |
CNN |
ADNI |
AD vs. NC |
93 |
|
S. Afzal et al. 6 |
2019 |
3D model |
OASIS |
AD vs. NC |
95 |
|
R. R. Janghel and Y. K. Rathore 7 |
2020 |
VGG16 |
ADNI |
AD vs. NC |
73 |
|
Roy et al. 11 |
2019 |
CNN |
OASIS |
AD vs. NC |
81 |
|
Feng et al. 12
|
2020 |
2D-CNN, 3D-CNNs, 3D-CNN-SVM |
ADNI |
MCI vs. NC NC vs. AD AD vs. NC |
97 98 89 |
The ability to identify and classify Alzheimer’s disease early has just been available, resulting in large-scale multimodal neuroimaging studies. MRI, PET, and genetic sequencing findings are some of the several modalities used to examine Alzheimer’s disease. Analyzing many modalities to make a choice takes time. Furthermore, patients may be exposed to radioactive effects in modalities such as PET 13. We think that the MRI method has a lot of advantages in this study because it has a lot of flexibility; good tissue contrast does not use ionizing radiation and can give us essential information about human brain architecture 14. Develop a computer-aided diagnostic method to scan MRIs and diagnose Alzheimer’s.
This study provides a strategy that extracts discriminative features using a hybrid model. The Synthetic Minority Oversampling Technique (SMOTE) 15 is used to alleviate class imbalance. There were a lot of variables and costs in the model, so it was made from scratch to categorize the early stages of Alzheimer’s better. They are trained on the Kaggle MRI dataset 16. The findings show that the recommended model with fewer parameters is better than any other work model that has been published before.
The following are some of the work’s significant contributions.
A unique hybrid model with minimal parameters to identify dementia forms is created for training a smaller dataset.
SMOTE randomly duplicates the minority class of photos in the dataset to reduce overfitting.
We constructed a hybrid model with fewer parameters and lower execution costs that still diagnose Alzheimer’s.
In terms of ACC, PR, REC, and F1 score, we compared the proposed model with in-depth features to detect stages of AD and found that the proposed model was better than the deep features.
Materials and Methods
A hybrid is applied to extract discriminative features in proposed methodology, effectively increasing AD classification accuracy. Figure 3 shows the framework of the hybrid model and figure 4 shows the block diagram of the hybrid model. The model’s four phases are preprocessing data, balancing SMOTE datasets, and CNN Dense layer classification. The stages of the recommended model are detailed below.
Dataset Description and Data Acquisition
We have used the Kaggle dataset for the training and testing of the AD. Kaggle is an open-source platform containing 6400 MR images divided into four categories: MiD, MOD, ND, and VMD. The collection contains images with a size of 176 by 208 pixels each. The photos have been shrunk down to 98 pixels on each side. Figure 1 shows representative images from the four classes. The model was built using jupyter for Python and TensorFlow on a computer with 8 GB of RAM and an Intel HD 6000 1536 MB graphics card. We show AD class samples in Figure 1.
The distribution of the dataset and the number of photos in the collection are shown in TABLE II. The dataset is unbalanced by class. SMOTE corrects the imbalance in class composition by randomly replicating members of minority classes to make them comparable to members of dominant classes 17. The minority classes were oversampled using the SMOTE method and a 42-seed random number generator. Two advantages of employing SMOTE are the capacity to prevent knowledge loss and avoid over-fitting. TABLE III. Illustrates the distribution of the dataset after the SMOTE approach was enlarged to 12800 photos, with 3200 images in each class.
There are two parts to the 12,800-images dataset. One part is for training (80%), and the other is for testing (20%). To speed up learning how to set the best parameters, the pictures are normalized with a range of 0 to 1. 18.
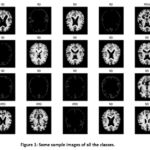 |
Figure 1: Some sample images of all the classes. |
Table 2: Distribution of datasets in the obtained dataset.
|
Class |
Number of MRI Images |
|
Mild Demented |
896 |
|
Moderated Demented |
3200 |
|
Non-Demented |
2240 |
|
Very Mild Demented |
64 |
Table 3: Distribution of Dataset after SMOTE
|
Class |
Number of MRI Images |
|
Mild Demented |
3200 |
|
Moderated Demented |
3200 |
|
Non-Demented |
3200 |
|
Very Mild Demented |
3200 |
Data pre-processing
Data preprocessing converts raw images into datasets. In this section, we describe how the image collection must be pre-processed to provide acceptable data for feature extraction and prediction shown in Figure 2. The image from the dataset is read in jpg format. We converted the picture to HSV after reading it to evaluate the color value in LAB. Following these procedures, we take the value of V and use K for division, with k = 2 chosen because there are two colors. The segmented image is obtained by masking the image of k.
We are reading a single image.
We are resizing it into (98*98).
We are converting the image into HSV and LAB.
Applying k means clustering on the value of V (k=2).
Applying masking to k means the segmented image.
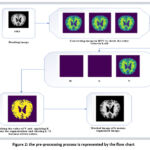 |
Figure 2: the pre-processing process is represented by the flow chart. |
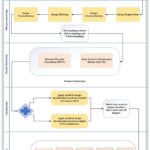 |
Figure 3: The framework for detecting and classifying Alzheimer’s disease |
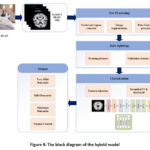 |
Figure 4: The block diagram of the hybrid model |
AD detection using the hybrid model
After pre-processing, the images are put into the hybrid model, which extracts discriminating characteristics to identify the Alzheimer’s afflicted region. This hybrid model is built from the ground up to help us figure out which stages of dementia we should look for in the research to tell if we have Alzheimer’s. It uses InceptionV3, and Resnet50, a dropout layer, two dense layers, a SoftMax classification layer, and two dense layers with ReLU activation for classification. A piecewise linear function best describes the ReLU. It serves as an activation function for the buried layer. Compared to other activation methods, ReLU enables networks to be learned more quickly and efficiently. The general process of my model and architecture is shown in Figures 5 and 6. A summary of the hybrid model is shown in TABLE IV.
Input Layer
The first layer of the hybrid model, known as image input1 (InceptionV3), receives the input of the MRI images. The second layer of the hybrid model, known as image input2 (Resnet50), receives input from the normalized and augmented MRI images. Magnetic resonance images are sent as input to both layers of the hybrid model.
Dropout Layer
In training, the dropout layer is used to randomly remove some neurons from the hidden layer, which makes it easier for the brain to learn new things. A dropout is also a way to fix the model’s overfitting problem. The best dropout rates are between 0.2 and 0.5. This is what we did in the suggested method. In dense 1 and 2 layers, we utilized 0.5.
Dense Layer
This layer turns high-dimensional data into a single-column vector. Flattened layer output makes dense layer denser. The thick layer of the artificial neural network performs the same calculations. Each neuron in the preceding layer is linked to a neuron in the dense layer. Next comes SoftMax. Neurons in each class are equal.
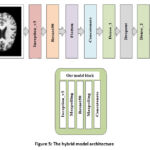 |
Figure 5: The hybrid model architecture |
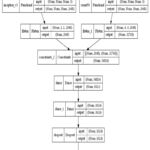 |
Figure 6: Hybrid model architecture details |
Table 4: Summary of hybrid model
|
Layer (type)
|
Output shape
|
Params
|
Connected to
|
|
image_input1 (InputLayer) |
[(None, 98, 98, 3)] |
0 |
[] |
|
image_input2 (InputLayer) |
[(None, 98, 98, 3)] |
0 |
[] |
|
inception_v3 (Functional) |
(None, None, None, 2048) |
21802784 |
[‘image_input1[0][0]’] |
|
resnet50 (Functional) |
(None, None, None, 2048) |
23587712 |
[‘image_input2[0][0]’] |
|
flatten (Flatten) |
(None, 2048) |
0 |
[‘inception_v3[0][0]’] |
|
flatten_1 (Flatten) |
(None, 32768) |
0 |
[‘resnet50[0][0]’] |
|
concatenate_2 (Concatenate) |
(None, 34816) |
0 |
[‘flatten[0][0]’, ‘flatten_1[0][0]’]
|
|
dense (Dense) |
(None, 1024) |
35652608 |
[‘concatenate_2[0][0]’] |
|
dense_1 (Dense) |
(None, 1024) |
1049600 |
[‘dense[0][0]’] |
|
dropout (Dropout) |
(None, 1024) |
0 |
[‘dense_1[0][0]’] |
|
dense_2 (Dense) |
(None, 4) |
4100 |
[‘dropout[0][0]’] |
|
Total params: 82,096,804 |
|||
|
Trainable params: 82,009,252 |
|||
|
Non-trainable params: 87,552 |
|||
The above TABLE IV represents the summary of the hybrid model. In this model, we take one layer of the InceptionV3 as an input layer and take another layer of the ResNet30 as an input. inception_v3 (Functional) t1 [0][0]’] and resnet50 (Functional) t2 [0][0]’] it is a preprocessing function of inception v3 and resnet30 in Keras. It returns a Keras image classification model, optionally loaded with weights pre-trained on ImageNet. After that, we used the two layers of the dense layer.
Performance evaluation parameters
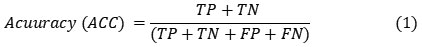
The confusion chart is used to check the proposed model’s accuracy, precision, recall, and F1 score and how well it works. To examine the efficiency indicators, the confusion chart is employed. The model’s findings are shown in the confusion matrix, which represents the data. The model’s accuracy is the most important metric for determining how effectively it predicts real-world positive and adverse events. The Equation below is used to Determine the accuracy. The training accuracy of the hybrid model is given in figure 7.
 |
Figure 7: Accuracy of the hybrid model training process with SMOTE |
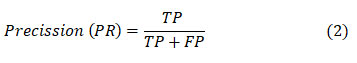
Here, the model thinks that both images and labels are good, so they are both excellent. Here, both the model and the label are wrong. The model predicts a lousy image. FP is returned if the image is standard, but the label is not. FN implies the model anticipated the image would be different, but the label was normal. Precision equals positive observations to optimistic forecasts (PR). A model precision of 1 is acceptable. The precision equation is below.
One way to measure how successfully the classifier can discover all positive data is to measure the Recall (REC). The recall is calculated using the Equation below.

The F1 score shows how well the balance between precision and recall is shown by the Equation below.
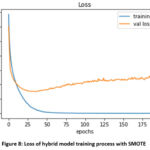 |
Figure 8: Loss of hybrid model training process with SMOTE |
Figure 8 represents the loss accuracy of the hybrid model. In the graph, Loss accuracy represents the summation of errors in the hybrid model. It measures hybrid model is doing well or not. If the errors are high then loss accuracy will be high, which means that the model is not working well. If the error is low then loss accuracy will be low, which means that the model is working well. So, the model loss accuracy is low which means the model is working well.
Experimental result and discussion
Details of performance
The model was tested on a 24GB NVIDIA Quadra RTX6000 workstation. The suggested model is trained with a 0.3297 initial learning rate and 32-epoch batches. The Adam is an algorithmic training optimizer. A scenario with and without SMOTE is used to train the model. The AUC is calculated after each epoch to determine if the model accurately classifies positive and negative data. Class imbalance and overfitting cause 96% training accuracy and 78% validation accuracy without SMOTE. Figures 6 and 7 exhibit SMOTE training on the hybrid model. The SMOTE model has 98% training and 88% validation accuracy. The training model is assessed with untrained images in confusion matrix model testing. As demonstrated in Figure 10, the hybrid model architecture to predict Alzheimer’s disease using the SMOTE technique to identify dementia stages is prone to misunderstanding. Classes from the four confusion matrix subcategories are shown in the projected class’s labeling. The confusion matrix shows the model’s training dataset performance. The computation considers 647 MD shots, 650 MOD photos, 640 ND photos, and 623 VMD photos. TABLE V. shows the individual class metrics derived from the confusion matrix.
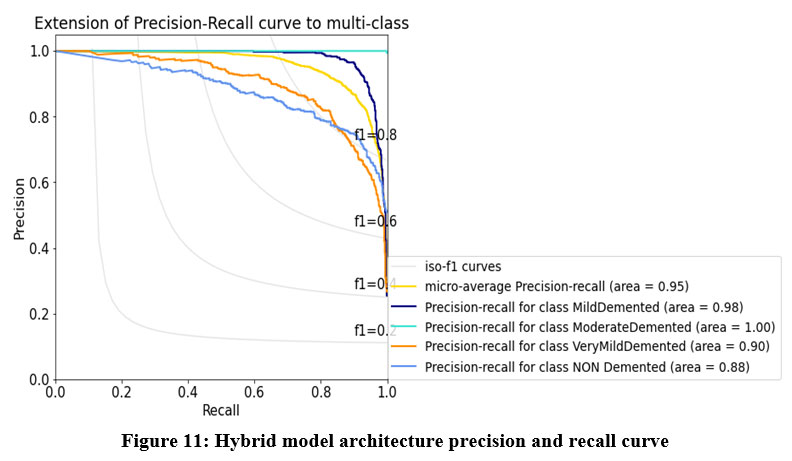
There are some promising results from MD, MOD, ND, and VMD in terms of PR, REC, and F1 score with the data set used to test them. SMOTE’s hybrid model is 99 percent accurate when testing the dataset. Without SMOTE, the model is only 85 percent accurate when testing, which is not very good. SMOTE is used 97 percent of the time, and the model without SMOTE gets 92 percent of the time. AUC indicates how well a model can distinguish between positive and negative groups. Figure 9 illustrates the average AUC curve for each class, representing the FPR and TPR with a single threshold value. Here is how it all goes down: There are precision and recall curves for people in class 0. People in class 1 have precision and recall curves that are shown as well. A graph is shown in Figure 11 that shows how well the model works. This graph shows the precision and recall curve.
 |
Figure 9: Training process AUC of hybrid model with SMOTE |
It is clear from the above Figure 9. A plot that the AUC for ROC with moderate dementia is higher than for other classes, i.e., mild dementia, very mild dementia, and non-demented.
 |
Figure 10: Confusion matrix for the four-class hybrid model. |
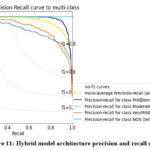 |
Figure 11: Hybrid model architecture precision and recall curve. |
Table 5: Indices of performance by individual class
|
Dementia Stage |
Precision |
Recall |
F1-Score |
Support |
|
Mild Demented |
0.92 |
0.94 |
0.93 |
647 |
|
Moderate Demented |
1.00 |
1.00 |
1.00 |
650 |
|
Non Demented |
0.81 |
0.80 |
0.80 |
640 |
|
Very Mild Demented |
0.81 |
0.81 |
0.81 |
623 |
The hybrid model comparison with other models
When we make a hybrid model, we compare it to other machine learning models that are not hybrid. We must compare the model to other models and image modalities used in the literature paper. Those metrics are used to compare the models that are talked about in the literature to the ones that are talked about there. In the performance analysis, we looked at the already used methods. With the ADNI dataset, they either learned how to solve a multi-class problem or how to solve a binary classification problem. MRI images have been used to train the hybrid model with SMOTE and without SMOTE, so we can see how well it works. In table VI, we compare the hybrid model to the traditional machine learning models Ensemble learning [19], Siamese Network [20], CBLSTM+ SMOTE 21, and DEMENT Model + SMOTE 22. The results are shown in table VI. All the other models do not do as well as the hybrid model, which is shown by how well it tried to classify four different groups with 82,096,804 parameters. It works well when we use the hybrid model to look at the data.
Table 6: The hybrid model’s performance compared to other models
|
Reference |
Dataset |
Data Type |
ACC |
PR |
REC |
F1-Score |
|
Proposed model (SMOTE) |
Kaggle Four-classes |
MRI |
99% |
88.53% |
88.59% |
88.56% |
|
Ensemble learning [19] |
GARD Two-classes |
MRI |
90% |
88% |
89% |
89% |
|
CBLSTM+ SMOTE [21] |
ADNI |
MRI |
82% |
78% |
88% |
82% |
|
DEMENT Model + SMOTE [22] |
Kaggle Four-classes |
MRI |
95% |
96% |
95% |
95% |
|
Siamese Network [20] |
ADNI |
MRI |
92% |
95% |
89% |
93% |
The above TABLE VI represents the accuracy (ACC), precision (PR), recall (REC), and F1-score of the model. The hybrid model accuracy is better for other models like Ensemble learning, CBLSTM+ SMOTE, DEMENT Model + SMOTE, and Siamese Network. The hybrid model used the multi-class Alzheimer’s disease dataset from Kaggle.
Dataset: https://www.kaggle.com/datasets/tourist55/alzheimers-dataset-4-class-of-images.
Conclusion
The study and interpretation of medical pictures have become important research topics in biomedical engineering due to recent breakthroughs. The usage and implementation of Deep Learning are reasons for this advancement in medical picture analysis. Many people have been using DL-based categorization and AI-based methods to find AD in its early stages in the last year. It is essential to have an automated system and a classification for AD that uses MRI images to get an early diagnosis of people with Alzheimer’s. This paper shows a hybrid method for categorizing people with AD. The model is trained and tested with data from Kaggle, which is used to categorize dementia stages. The dataset’s biggest flaw is that it does not have enough of each class. This problem is solved by using the SMOTE method. The proposed model had an overall accuracy rate of 99 percent compared to other methods when tested with data from four classes. So, it can detect brain areas linked to Alzheimer’s disease and help doctors determine how severe the disease will be based on how much dementia they have.
In the future, we will train and test the model on more datasets to ensure that it can be utilized independently to screen the dementia stages of Alzheimer’s. Furthermore, this deep learning technique helps other neurogenerative diseases, doctors, caregivers, radiologists, and patients with this condition, but it also helps the researcher figure out what else is wrong with someone else.
Conflict of Interest
The authors declare no conflict of interest.
References
- Gupta, Gaurav, et al. “Mobile health applications and android toolkit for Alzheimer’s patients, caregivers, and doctors.” Biological Forum–An International Journal. Vol. 11. No. 1. 2019.
- Wang, Shui-Hua, et al. “Classification of Alzheimer’s disease based on an eight-layer convolutional neural network with the leaky rectified linear unit and max pooling.” Journal of medical systems 42.5 (2018): 1-11.
CrossRef - Gupta, Yubraj, et al. “Early diagnosis of Alzheimer’s disease using combined features from voxel-based morphometry and cortical, subcortical, and hippocampus regions of MRI T1 brain images.” PLoS One 14.10 (2019): e0222446.
CrossRef - Ahmed, Samsuddin, et al. “Ensembles of patch-based classifiers for diagnosis of Alzheimer’s diseases.” IEEE Access 7 (2019): 73373-73383.
CrossRef - Ge, Chenjie, et al. “Multiscale deep convolutional networks for characterization and detection of Alzheimer’s disease using MRI images.” 2019 IEEE International Conference on Image Processing (ICIP). IEEE, 2019.
CrossRef - Afzal, Sitara, et al. “A data augmentation-based framework to handle class imbalance problem for Alzheimer’s stage detection.” IEEE Access 7 (2019): 115528-115539.
CrossRef - Janghel, R. R., and Y. K. Rathore. “Deep convolution neural network based system for early diagnosis of Alzheimer’s disease.” Irbm 42.4 (2021): 258-267.
CrossRef - Farooq, Ammarah, et al. “A deep CNN-based multi-class classification of Alzheimer’s disease using MRI.” 2017 IEEE International Conference on Imaging systems and techniques (IST). IEEE, 2017.
CrossRef - Wang, Shui-Hua, et al. “Classification of Alzheimer’s disease based on an eight-layer convolutional neural network with the leaky rectified linear unit and max pooling.” Journal of medical systems 42.5 (2018): 1-11.
CrossRef - Liu, Manhua, et al. “Multi-modality cascaded convolutional neural networks for Alzheimer’s disease diagnosis.” Neuroinformatics 16.3 (2018): 295-308.
CrossRef - Roy, Sanjiban Sekhar, Raghav Sikaria, and Aarti Susan. “A deep learning based CNN approach on MRI for Alzheimer’s disease detection.” Intelligent Decision Technologies 13.4 (2019): 495-505.
CrossRef - Feng, Wei, et al. “Automated MRI-based deep learning model for detection of Alzheimer’s disease process.” International Journal of Neural Systems 30.06 (2020): 2050032.
CrossRef - Kim, Yeonghee. “Are we being exposed to radiation in the hospital?.” Environmental Health and Toxicology 31 (2016).
CrossRef - Al-kuraishy AA, Jalil HJ, Mahdi AS, Al-hussaniy HA. General anesthesia in a patient with Brain Injury. Medical and Pharmaceutical Journal. 2022 May 27;1(1):24-34.
CrossRef - Mansourifar, Hadi, and Weidong Shi. “Deep synthetic minority over-sampling technique.” arXiv preprint arXiv:2003.09788 (2020).
- Dubey, Sarvesh. “Alzheimer’s dataset (4 class of images).” Kaggle, Dec (2019).
- Pan, Tingting, et al. “Learning imbalanced datasets based on SMOTE and Gaussian distribution.” Information Sciences 512 (2020): 1214-1233.
CrossRef - J. Jordan. (2018). Normalizing Your Data. [Online]. Available: https://www.jeremyjordan.me/batch-normalization/
- Ahmed, Samsuddin, et al. “Ensembles of patch-based classifiers for diagnosis of Alzheimer’s diseases.” IEEE Access 7 (2019): 73373-73383.
CrossRef - Liu, Chin-Fu, et al. “Using deep Siamese neural networks for detection of brain asymmetries associated with Alzheimer’s disease and mild cognitive impairment.” Magnetic resonance imaging 64 (2019): 190-199.
CrossRef - Afzal, Sitara, et al. “A data augmentation-based framework to handle class imbalance problem for Alzheimer’s stage detection.” IEEE Access 7 (2019): 115528-115539.
CrossRef - Murugan, Suriya, et al. “DEMNET: a deep learning model for early diagnosis of Alzheimer’s diseases and dementia from MR images.” IEEE Access 9 (2021): 90319-90329.
CrossRef

