
Manuscript accepted on :29-08-2023
Published online on: 28-09-2023
Plagiarism Check: Yes
Reviewed by: Dr. Sudhanshu Bharti
Second Review by: Dr. Rajat Goyal
Final Approval by: Dr. Patorn Promchai
Muhammad Wahizul Haswan Abdul Aziz1,2 , Dayang Fredalina Basri3 , Siti Fathiah Masre1 and Ahmad Rohi Ghazali1*
1Centre for Toxicology and Health Risk Studies (CORE), Faculty of Health Sciences, Universiti Kebangsaan Malaysia, Jalan Raja Muda Abdul Aziz, Kuala Lumpur, Malaysia.
2Department of Para-clinical Sciences, Faculty of Medicine and Health Sciences, Universiti Malaysia Sarawak, Jalan Datuk Mohammad Musa, Kota Samarahan, Sarawak, Malaysia.
3Centre for Diagnostic, Therapeutic and Investigative Studies (CODTIS), Faculty of Health Sciences, Universiti Kebangsaan Malaysia, Jalan Raja Muda Abdul Aziz, 50300 Kuala Lumpur, Malaysia.
Corresponding Author E-mail: rohi@ukm.edu.my
DOI : https://dx.doi.org/10.13005/bpj/2732
Abstract
The most common type of cancer found in the human outer and middle skin layers is keratinocyte carcinoma, often known as non-melanoma skin cancer. Although it can be aggressive, skin cancer is generally not fatal. This study aims to measure the chemopreventive and oxidative stress effects of terpenoid-rich Canarium odontophyllum Miq.’s leaf extract (TRCO) in the UVB-induced skin carcinogenesis model. The model involving human keratinocytes (HaCaT) was adapted with optimisations with pretreatment of 500 µg/ml TRCO (TRCO500) & 1000 µg/ml TRCO (TRCO1000). The HaCaT oncogenic transformation model's repetitive UVB exposure resulted in altered cell shape, according to our findings. Pretreatment of TRCO1000 significantly reduced tumour protein p53 (TP53) and marker of proliferation KI-67 (KI67) expression in UVB-induced HaCaT. Treatment with TRCO resulted in an overall reduction in oxidative stress. TRCO pretreatment showed reduced lipid peroxides, LPO and significantly reduced protein carbonyls. In conclusion, the promising results of this chemopreventive study using TRCO on this in-vitro skin carcinogenesis model suggested that it is worthwhile to conduct further isolations and assessments of terpenoids from C. odontophyllum Miq. leaf as a possible chemoprevention agent.
Keywords
Canarium odontophyllum Miq.; chemoprevention; Human keratinocytes; in-vitro; skin cancer; terpenoids
Download this article as:| Copy the following to cite this article: Aziz M. W. H. A, Basri D. F, Masre S. F, Ghazali A. R. Chemopreventive Measurements and Oxidative Stress Effects of Terpenoid-rich Canarium odontophyllum Miq. Leaf Extract (TRCO) in Ultraviolet B-Induced In-Vitro Skin Carcinogenesis Model. Biomed Pharmacol J 2023;16(3). |
| Copy the following to cite this URL: Aziz M. W. H. A, Basri D. F, Masre S. F, Ghazali A. R. Chemopreventive Measurements and Oxidative Stress Effects of Terpenoid-rich Canarium odontophyllum Miq. Leaf Extract (TRCO) in Ultraviolet B-Induced In-Vitro Skin Carcinogenesis Model. Biomed Pharmacol J 2023;16(3). Available from: https://bit.ly/3RBmXee |
Introduction
The most frequently occurring cancer in humans is non-melanoma skin cancer, also known as keratinocyte carcinoma. This cancer usually appears on skin areas exposed to the sun, including the head, neck, shoulders, back, and arms. These cancers have recently increased significantly worldwide.1 Solar ultraviolet radiation, especially ultraviolet-B (UVB) is a significant environmental carcinogen and the main culprit for human skin cancer.2 UVB exerts more negative impact than beneficial to living organisms. UVB radiation triggers the skin to produce free radicals or reactive oxygen species (ROS), which have a significant role in the disease’s development. Consecutively, antioxidants are essential for safeguarding our body from free radicals’ damaging effects.3 However, the body’s inherent antioxidant defence mechanism has certain limitations,4 and can be overwhelmed by exposure to excessive ultraviolet (UV) radiation. Thus, taking additional measures to safeguard the skin from damage caused by sunlight and maintaining cellular redox balance is crucial. Applying exogenous antioxidants on the skin’s surface can raise antioxidant levels in the human epidermis, protecting against oxidative damage caused by UVB radiation.5 In plants’ defence system, terpenoid is an example of their photoprotective molecule. Terpenoids which are a wide group of secondary plant metabolites have shown significant potential as chemopreventive and therapeutic agents in cancer treatment.6 Recently, there has been growing attention towards discovering novel external antioxidants from plant sources in mitigating oxidative stress-related ailments that offer photoprotective benefits. Natural compounds are considered safer and more promising substitutes for commonly used synthetic antioxidants.7
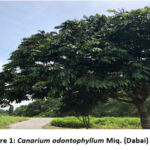 |
Figure 1: Canarium odontophyllum Miq. (Dabai) tree |
Canarium odontophyllum Miq., also recognised as the “dabai” fruit, is particularly rich in antioxidants. The natives in Sarawak, Malaysia, consume C. odontophyllum Miq., as a snack to support their health and vitality.8 The tree (Figure 1) can reach a height of 36 m and a diameter of 85 cm.9 It also has oblong leaves with 3–8 pairs of spirally arranged leaflets, with the terminal leaflets at the end.10 The edible fruits are fondly known as the ‘Sibu olives’. The fruit contains thin, dark, purple-coloured skin (epidermis), thick golden-coloured flesh (mesocarp) and a single seed (endocarp).
To date, there has been limited research on the biological characteristics of Canarium odontophyllum Miq. There have been claims of medicinal use of the C. odontophyllum Miq. leaf by locals in Sarawak. Previous investigations have examined various biological activities of C. odontophyllum Miq. leaf extracts.11 Based on our previous C. odontophyllum leaf phytochemical profiling, we determined the active compounds found in nonpolar organic solvents, particularly hexane, using gas chromatography-mass spectrometry (GC-MS). The extract obtained is rich with terpenoids, including major terpenoids such as spathulenol and phytol, and primary fatty acid (palmitic acid) that might be responsible for their biological activities.12 Fatty acids are recognised for acting as antioxidants and scavenging free radicals.13 Furthermore, terpenoids exhibit several properties, including antimicrobial, antioxidant, anti-inflammatory, anti-malarial, anti-cancer, and anti-fungal activities.14
Hence, our investigation aimed to determine the chemopreventive measurements and oxidative stress effects of terpenoids-rich C. odontophyllum Miq. leaf extract (TRCO) on chronic UVB-induced in-vitro skin damage.
Materials and methods
Studied Plant and TRCO preparation
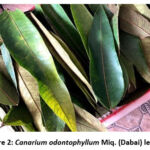 |
Figure 2: Canarium odontophyllum Miq. (Dabai) leaves |
Fresh leaves of C. odontophyllum Miq. (Figure 2) were gathered from Kuching, Sarawak, Malaysia, with permits acquired from the Sarawak Biodiversity Centre (SBC-2020-EP-58-MWH & SBC-2019-RDP-20-MWH). The leaf sample was deposited in the herbarium (Universiti Kebangsaan Malaysia (UKM)) with voucher number ID028/2020. The process to obtain a terpenoid-rich extract yielded 0.499 g (0.624%), and TRCO test concentrations (500 µg/ml TRCO (TRCO500) & 1000 µg/ml TRCO (TRCO1000)) followed the procedure from our previous study.12
UVB-induced Immortalized Human Keratinocytes (HaCaT)
Prolonged UVB Irradiation
UVB source was produced from UVB Lamps (Analytikjena USA), and the intensity was measured using a UVX digital radiometer (Analytikjena USA). The lamps were switched on for at least 5 minutes before the dose rate of UVB, which was 30 mJ/cm2, was measured.15
Immortalized HaCaT
The HaCaT cell line vial (EP-CL-0090) was purchased from Elabscience (USA). The cell revival, subculture and calculation followed the detailed procedures in the previous study.12 The 6-well cell culture plates were used to culture the cells. The wells in plates were first added with 2 ml of DMEM media. Then, cells were seeded in 6-well plates at a density of 4 x 10⁵ cells per well. The media was changed every 48 hrs and were checked for 80% confluency.
HaCaT oncogenic transformation model
In-vitro UVB-induced skin carcinogenesis model from a previous study15 was adapted with optimisations. Upon reaching 80% cell confluency during passage (P) 5 (P5), media was removed from wells in the 6-well plates. Cells were then given two PBS washes and added 1 ml of media into each well. Following that, the plates containing the cells were incubated for thirty minutes at 37°C with 5% CO2. After incubation, The UVB-induced HaCaT group was exposed to 30 mJ/cm2 UVB radiation. The non-UVB-induced group was devoid of UVB exposure. Following receiving UVB radiation, the cells were given a new medium, and they were then incubated at 37°C with 5% CO2 until confluent. This method was repeated for the next P6 until P10 (6 passages).
Giemsa Staining
Standard Giemsa staining was done to verify the optimised model of HaCaT transformation. It aided the visualisation to observe the cells’ morphological changes, such as the shape and size of the cells and their nuclei. The adhered cells in 6-well plates (P11) were first fixed for 5 minutes in ethanol and then air-dried. Then, the Giemsa stain solution (Sigma-Aldrich, USA) was added to each well and allowed to sit for 20 minutes. After staining, the wells were washed with water and air-dried before viewing under a microscope.
Cell Lysates Preparation
The oncogenic transformation model was carried out for TRCO groups. TRCO500 and TRCO1000 were added into 1 ml media before UVB radiation from P5-P10. After reaching P11, each of the wells containing HaCaT cells from all treatment groups (non-UVB, UVB-induced, UVB + TRCO500 & UVB + TRCO1000) was added 150 µl of ice-cold RIPA lysis solution, which afterwards incubated for five minutes on ice. Each well was gently scraped after incubation using a cell scraper to remove and lyse cells. The cells were then put into cool micro-centrifuge tubes. After that, cells underwent a 30-minute incubation on ice with continual agitation. The cells were centrifuged at 4°C for 10 minutes at 12000 rpm. The supernatant was carefully transferred (prevented the pellet) to a new microcentrifuge tube and then kept at -80°C for total protein count (BSA) (Elabscience, USA, Catalog No. E-BC-K318-M) and further tests.
Chemopreventive Measurements
Human marker of proliferation KI-67 (KI67) Content Assay
The KI67 content in treatment groups was determined following the human MKI67 (Antigen KI-67) ELISA kit (Catalog No. EH0684) from the FineTest, China. Samples (n=9) and standards were prepped per the manufacturer’s manual in the kit. 100 µL of diluted samples were added to 96 well plates for assay procedures, and OD 450 nm was measured using a microplate reader (Multiskan Go, Thermo Scientific, USA). The examined samples’ KI67 was then determined using the standard curve obtained.
Human Tumour Protein p53 (TP53) Content Assay
The TP53 content in treatment groups was determined following the human total TP53 ELISA kit (Catalog No. EH3898) from FineTest, China. Samples (n=9) and standards were prepped per the manufacturer’s manual in the kit. 100 µL of diluted samples were added to 96-well plates for assay procedures and then measured at OD 450 nm using a microplate reader (Multiskan Go, Thermo Scientific, USA). The TP53 in the tested samples was then calculated using the established standard curve.
Determination of Biochemical Markers for Oxidative Stress Effects
Total Superoxide Dismutase (T-SOD) Activity
According to the T-SOD activity test kit (Catalog No. E-BC-K020-M) from Elabscience, USA, the T-SOD activity in treatment groups was measured. Samples (n=9) were prepared following the kit’s manufacturer’s protocol. The enzyme working solution and the samples, each 20 µl in volume, were put into a 96-well plate. Each well was then filled with 200 µl of the substrate application solution and properly mixed. Once the plate had been incubated at 37°C for 20 minutes, the OD values at 450 nm were measured using a microplate reader (Multiskan Go, Thermo Scientific, USA). The T-SOD activity in the samples was then determined using the formula below:

where,
i : Inhibition ratio of SOD (%)
V1: The total volume of the reaction, 240 µl
V2: The volume of sample added to the reaction, 20 µl
f : Dilution factor of the sample before tested
Cpr : Protein concentration of sample, mgprot/ml
T-SOD activity for each treatment group and controls were calculated and recorded as mean ± SEM.
Catalase (CAT) Activity Assay
The CAT activity in treatment groups was measured following the CAT activity assay kit (Catalog No. E-BC-K031-S) from Elabscience, USA. Samples (n=9) were prepared per the manufacturer’s manual in the kit. Then, 100 µl of samples were transferred to 96-well plates for OD 405 nm measurement with a microplate reader (Multiskan Go, Thermo Scientific, USA). The following formula was used to determine the quantity of catalase present in the tested samples:

where,
32.5: reciprocal of the slope
1: reaction time
DA: Absolute OD (ODControl – ODSample)
V: Volume of sample, ml
f : Dilution factor of the sample before the test
Cpr: Concentration of protein in the sample, gprot/L
CAT activity for each treatment group and controls were calculated and recorded as mean ± SEM.
Glutathione peroxidases (GSH-Px) Activity
GSH-Px activity in treatment groups was measured following the GSH-Px activity assay kit (Catalog No. E-BC-K096-S) from Elabscience, USA. Samples (n=9) were prepared per the manufacturer’s protocol in the kit. Two sets of reactions (enzymatic and non-enzymatic) were prepared for each treatment group. A glutathione (GSH) standard was prepared. The GSH-Px activity determination assay involved two sections; i) enzymatic reaction and ii) chromogenic reaction, carried out per the kit’s protocol. Then, 100 µl of samples were added to 96-well plates for OD measurement at 412 nm using a microplate reader (Multiskan Go, Thermo Scientific, USA). GSH-Px activity in samples was then calculated according to the formula below:

where,
𝜟A1: OD non-enzyme tube – OD enzyme tube
𝜟A2: OD Standard – OD Blank
c: concentration of standard, 20 µmol/L
d: the optical path of 96 well plates, 0.28cm
V: volume of sample added to the reaction system, ml
f: dilution factor of the sample before the test
f2: dilution factor of cell culture in enzymatic reaction, 5 times
Cpr: Concentration of protein in the sample
GSH-Px activity for each treatment group and controls were calculated and recorded as mean ± SEM.
Glutathione-S-transferase (GST) Activity
GST activity in treatment groups was determined following the GST activity assay kit (Catalog No. E-BC-K278-S) from Elabscience, USA. Reagents and samples (n=9) were prepared, and the assay was carried out per the manufacturer’s protocol in the kit. Then, 100 µl of samples were added to 96-well plates. Next, OD measurements were obtained at two specific times: i) 20 s and ii) 320 s at 340 nm using a microplate reader (Multiskan Go, Thermo Scientific, USA). The following formula was used to determine the GST activity in the samples:

where,
𝜟A : OD sample – OD blank
Σ : molar extinction coefficient of the product, 9.6 X 10³ L/mol/cm
d: the optical path of 96 well plates, 0.28cm
106: 1 mol= 106 µmol
V1: total volume of the reaction system, 1.1ml
V2: volume of sample added to the reaction system, 0.1ml
t: reaction time, 5 min
f: dilution factor of the sample before the test
Cpr: Concentration of protein in the sample
GST activity for each treatment group and controls were calculated and recorded as mean ± SEM.
Lipid peroxide (LPO) Content
The LPO content determination in the treatment groups was done following the manufacturer’s instruction by using LPO colourimetric assay kit (Catalog No: E-BC-K176-M) from Elabscience, USA. Firstly, a standard curve of different concentrations ranging from 0, 5, 10, 20, 30, 40, 50, and 80 µmol/L was prepared using 100 µmol/L standard solutions in the kit. The linear equation y=ax+b is obtained by plotting a standard curve using the OD value of standards (y-axis) and its matching concentration (x-axis). Next, 200 µl of each sample (n=9) was prepared following the kit’s instructions. Then, the colourimetric changes in samples indicating the presence of LPO were measured using a microplate reader (Multiskan Go, Thermo Scientific, USA) at OD 562 nm. The concentration of LPO in the tested samples was then calculated using the formula below based on the plotted standard curve:

where,
ΔA562: OD sample- OD Blank
a: slope of the standard curve
b: intercept of the standard curve
f: dilution factor of the sample before the test
Cpr: Concentration of protein in the sample
The LPO content for each treatment group and control was calculated and recorded as mean ± SEM.
Protein carbonyl (PC) Content
According to the PC colourimetric assay kit (Catalog No. E-BC-K117-S from Elabscience, USA), the protein carbonyl concentration of treatment groups was measured. Samples (n=9) were prepped per the manufacturer’s manual in the kit. Then, 100 µL of samples were transferred to 96-well plates for measurement of OD at 370 nm using a microplate reader (Multiskan Go, Thermo Scientific, USA). The formula provided below was utilised to calculate the concentration of PC in the tested samples:

where,
A1: OD value of the sample
A2: OD value of control
Σ : molar extinction coefficient of carbonyl, 22000 L/mol/cm
d: the optical path of 96 well plates, 0.28cm
V1: total volume of the reaction system, 1.25ml
V2: total volume of sample added to the reaction system, 0.1ml
106: unit conversion, 1 mol= 109 nmol
f: dilution factor of the sample before the test
Cpr: Concentration of protein in the sample
PC content for each treatment group and controls were calculated and recorded as mean ± SEM.
Statistical Analysis
GraphPad Prism Version 9.3.1 was employed for statistical analysis. All experiments were done in triplicate (n=3), and the findings were presented as means ± standard error of mean (SEM). The means of several treatment groups were compared using a one-way ANOVA test with post-hoc analysis. A significance level of 0.05 has been established, meaning that results with a p-value less than 0.05 (p<0.05) will be deemed statistically significant.
Results and Discussion
In-vitro UVB-induced HaCaT Oncogenic Transformation
 |
Figure 3: Morphology of HaCaT cells (a) non-UVB induced (b) UVB induced (30 mJ/cm2 x 6 passages (P5-P10)) on magnifications 10x & 40x. Giemsa. PM: Pleomorphism |
Giemsa-stained cells appeared to be pink to purple, while the nuclei appeared blue to purple. Results showed observable oncogenic transformation in cell morphology caused by repeated UVB radiation. Non-UVB-induced HaCaT cells showed normal morphology of small, uniformly shaped nuclei and conformity in cell size and shape (Figure 3(a)); meanwhile, UVB-induced HaCaT cells showed pleomorphism and disorganised arrangement (Figure 3(b)). Previous studies that have been published claim that a minimal erythemal dose of UVB of about 40 mJ/cm2 16 results in DNA damage and substantial apoptosis in radiated keratinocytes.17 Hence, to depict a realistic scenario of recurring DNA damage and repair, we selected a sub-erythemal dose of UVB (30 mJ/cm2), which enabled HaCaT to be exposed to it repeatedly.
Chemopreventive Measurements
Human KI67 Content
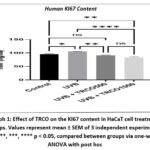 |
Graph 1: Effect of TRCO on the KI67 content in HaCaT cell treatment groups. Values represent mean ± SEM of 3 independent experiments. |
Pretreated groups TRCO500 & TRCO1000 significantly reduced the expression of KI67 in cells (91.54 ± 1.32 ng/ml and 83.75 ± 2.55 ng/ml, respectively) compared to UVB induced group (105.31 ± 0.92 ng/ml) (Graph 1). KI67 protein was a marker found in cells and was highly linked to cell proliferation. The KI67 antigen existed solely in the nucleus of cells during the interphase stage, but during mitosis, a significant portion of the protein moved to the chromosomal surface. The KI67 protein can be found in the cell cycle’s active stages, which include G1, S, G2, and mitosis. However, the protein was absent in inactive or quiescent cells (G0).18 A study found that the quantity of KI67 protein in cells increased as they progressed through the cell cycle’s S phase.19 Based on the findings, it was shown that the TRCO has some role in regulating KI67. Terpenoids such as spathulenol, which can be found in abundance in TRCO might contribute as an anti-proliferative agent, which spathulenol has been reported previously to have anti-proliferative properties.20
Human TP53 Content
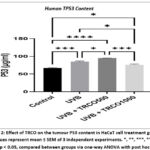 |
Graph 2: Effect of TRCO on the tumour P53 content in HaCaT cell treatment groups. Values represent mean ± SEM of 3 independent experiments. |
Our findings showed the pretreated group TRCO1000 (76.09 ± 2.11 ug/ml) significantly reduced TP53 expression compared to the UVB-induced group (84.68 ± 2.34 ug/ml) (Graph 2). However, the pretreated group with TRCO500 showed no decrease in TP53 expression. This result might be due to more proliferated cells than the TRCO1000 group, as stated in Figure 4. The functionality of the p53 gene was compromised by a genetic mutation, resulting in the loss of its ability to promote tumour suppression and thereby initiate tumorigenesis. Whenever there is genotoxic stress, P53 protein levels are increased. DNA damage, hypoxia, and mitogenic oncogenes are a few biological stresses that can activate the p53 gene.21
Determination of Biochemical Biomarkers of TRCO on UVB-induced HaCaT Carcinogenesis Model
T-SOD Activity
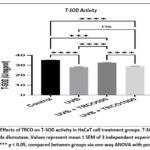 |
Graph 3: Effects of TRCO on T-SOD activity in HaCaT cell treatment groups. T-SOD: total superoxide dismutase. Values represent mean ± SEM of 3 independent experiments. |
Our study demonstrated that HaCaT cells experienced a reduction in T-SOD (total superoxide dismutase) activity due to repeated exposure to UVB (Graph 3). Our results are consistent with the previous research, which has also shown that UVB exposure can result in T-SOD deficiency.22 Pretreatment of 500 µg/ml TRCO (TRCO500) effectively shielded cells from UVB radiation’s harmful effects and considerably raised the SOD activity to 32.73 ± 0.16 U/mgprot. However, for the 1000 µg/ml TRCO (TRCO1000) group, there was no significant increase in SOD activity (28.79 ± 0.21 U/mgprot) compared to the UVB-induced group (27.99 ± 0.32 U/mgprot). The lack of a significant increase in SOD activity at the higher concentration of TRCO may be due to the combination of UVB exposure and higher cytotoxicity, as shown in the MTT assay reported previously.12 Overall, our results indicate that TRCO may be able to guard skin cells against the damaging effects of persistent UVB exposure.
CAT Activity
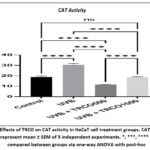 |
Graph 4: Effects of TRCO on CAT activity in HaCaT cell treatment groups. CAT: catalase. Values represent mean ± SEM of 3 independent experiments. |
UVB exposure significantly increased catalase activity (Graph 4). Pre-treatment of TRCO500 and TRCO1000 seemed to significantly reduce catalase enzyme activity (11.63 ± 0.05 U/mgprot and 18.68 ± 0.25 U/mgprot, respectively) in UVB-induced HaCaT and the trend was similar to T-SOD where TRCO500 showed higher potency than TRCO1000. The ROS generation was shown to be increased in the UVB-induced keratinocytes that overexpressed catalase significantly. Catalase absorbed UVB radiation and converts it into reactive chemical intermediates, which can neutralise the antioxidant enzymes available inside the cell.23 However, excessive ROS accumulation due to catalase activity can result in oxidative stress and DNA damage, potentially leading to skin cancer.24 TRCO successfully inhibited the production of ROS and reduced ROS accumulation in the cells.
GSH-Px Activity
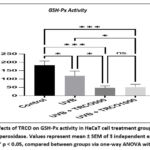 |
Graph 5: Effects of TRCO on GSH-Px activity in HaCaT cell treatment groups. GSH-Px: glutathione peroxidase. Values represent mean ± SEM of 3 independent experiments. |
TRCO500 and TRCO1000 groups exhibited pro-oxidative activity (46.88 ± 7.04 U/mgprot and 51.29 ± 10.03 U/mgprot, respectively) compared to the control group (182.79 ± 14.12 U/mgprot). However, the UVB exposure significantly depleted the GSH-Px activity (Graph 5). Depletion in GSH-Px was caused by the exhaustion of the said enzyme and its substrate GSH to neutralise and reduce UVB-induced free radicals, and GSH-Px activity was not unlimited.25 Depletion in GSH by the UVB & TRCO may lead to a reduced GSH-Px activity.
GST Activity
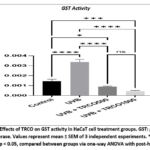 |
Graph 6: Effects of TRCO on GST activity in HaCaT cell treatment groups. GST: glutathione s-transferase. Values represent mean ± SEM of 3 independent experiments. |
The UVB exposure significantly increased GST activity (Graph 6). High GST activity in the UVB group could indicate that the enzyme was triggered due to an increase in free radical production. Pretreatment of TRCO500 and TRCO1000, with high antioxidative capacity, resulted in an overall reduction (0.00088 ± 0.000047 U/mgprot and 0.00044 ± 0.000045 U/mgprot respectively) in oxidative stress compared to UVB-induced group (0.00338 ± 0.000112 U/mgprot). Our findings may conclude that TRCO acted as antioxidants which helped eliminate free radicals and did not necessitate induction of high GST activity. The primary function of GST was to eliminate electrophiles (free radicals) through conjugation with reduced glutathione (GSH) and can also detoxify lipid peroxidation (LPO).26
Determination of oxidative damage markers of TRCO on Chronic UVB-induced HaCaT
LPO Level
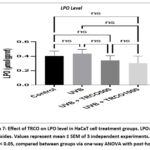 |
Graph 7: Effect of TRCO on LPO level in HaCaT cell treatment groups. LPO: lipid peroxides. Values represent mean ± SEM of 3 independent experiments. |
TRCO500 and TRCO1000 groups showed a decreased LPO formation caused by UVB-induced free radicals (0.34 ± 0.04 µmol/gprot and 0.30 ± 0.06 µmol/gprot respectively) but not statistically significant compared to UVB-induced group (0.44 ± 0.04 µmol/gprot) (Graph 7). The epidermis layer of skin was composed of a myriad of lipids which were targets of free radicals leading to lipid peroxidation.27 UVB exposure induced LPO formation.28,29 Exogenous antioxidants directly scavenge free radicals, thus, reducing the lipid peroxidation process.30 Exogenous antioxidants directly scavenge free radicals, thus, reducing the lipid peroxidation.
PC Level
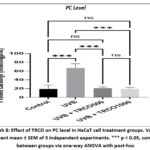 |
Graph 8: Effect of TRCO on PC level in HaCaT cell treatment groups. Values represent mean ± SEM of 3 independent experiments. |
In this study, we found that groups pretreated with TRCO500 and TRCO1000 significantly reduced the formation of protein carbonyls compared to the UVB-induced group (Graph 8). The level of protein carbonyls in both TRCO pretreated groups was measured at 20.95 ± 1.73 nmol/mgprot and 19.24 ± 1.92 nmol/mgprot, respectively, while the level in the UVB-induced group was much higher at 67.24 ± 5.47 nmol/mgprot. Exposure to UVB rays generates ROS that triggers protein oxidation with a substantial rise in protein carbonyls, an indicator of protein oxidation, due to UVB exposure.31 This means that TRCO could potentially prevent the oxidation of proteins caused by UVB radiation by decreasing the generation of protein carbonyls.
Conclusion
Our study adapted the in-vitro skin carcinogenesis model to evaluate the chemopreventive measurements of TRCO. Our research findings suggest that TRCO has potential benefits in the chemoprevention of skin cancer induced by UVB radiation. Specifically, TRCO demonstrated chemopreventive effects by acting as an anti-proliferative agent through the KI67 pathway and suppressing the TP53. TRCO also helped reduce oxidative stress in HaCaT cells caused by repeated UVB radiation. In conclusion, TRCO has the potential to be studied further with isolations of its terpenoids as a possible therapeutic remedy for skin cancer prevention. These findings emphasise the possible advantages of utilising natural plant extracts for preventing and treating skin cancer and lay the foundation for additional research in this domain.
Acknowledgement
We would like to acknowledge Sarawak Biodiversity Centre for the C. odontophyllum Miq research permit, Universiti Malaysia Sarawak for the emolument and Faculty of Health Sciences, Universiti Kebangsaan Malaysia for the lab facilities throughout the study.
Conflict of Interest
All authors declare that there is no conflict of interest.
Funding Source
This project was funded by Universiti Kebangsaan Malaysia under a research code grant (DIP-2018-034).
References
- Perry DM, Barton V, Alberg AJ. Epidemiology of Keratinocyte Carcinoma. Curr Dermatol Rep. 6(3):161-168 (2017).
CrossRef - Xu X, Chen J, Cai S, et al. A Real-Time Wearable UV-Radiation Monitor based on a High-Performance p-CuZnS/n-TiO2 Photodetector. Advanced Materials. 30(43):1803165 (2018).
CrossRef - Nimse SB, Pal D. Free radicals, natural antioxidants, and their reaction mechanisms. RSC Advances. 5(35):27986-28006 (2015).
CrossRef - Sies H. Hydrogen peroxide as a central redox signaling molecule in physiological oxidative stress: Oxidative eustress. Redox Biology. 11(613-619 (2017).
CrossRef - Kim KH, Park SJ, Lee YJ, et al. Inhibition of UVB-Induced Skin Damage by Exopolymers from Aureobasidium pullulans SM-2001 in Hairless Mice. Basic & Clinical Pharmacology & Toxicology. 116(2):73-86 (2015).
CrossRef - Kamran S, Sinniah A, Abdulghani MAM, Alshawsh MA. Therapeutic Potential of Certain Terpenoids as Anticancer Agents: A Scoping Review. Cancers. 14(5):1100 (2022).
CrossRef - Bećić ASaC, R. and Kusur, A. and Junuzović, H. and Brčina, T. Comparative Analysis Of the Antioxidant Capacity Of Some Natural And Synthetic Antioxidants Added To Palm Oil. Technologica Acta. 15(2):19-23 (2023).
CrossRef - Latiff A, Faridah-Hanum, I. and Zakri, A.H. The importance of biodiversity conservation research and collaboration in the ASEAN : A view from Asean scientists. In Proceedings of the First Scientific Planning conference & Report of the Second Scientific Experts Meeting (SEC) Meeting of ARCBC p 24 Kuala Lumpur. (2000).
- Saari SM, Basri DF, Budin SB, Warif NM. Effects of Canarium odontophyllum leaves on plasma glucose and T lymphocyte population in streptozotocin-induced diabetic rats. Saudi J Biol Sci. 24(2):320-323 (2017).
CrossRef - Ding P, Tee YK. Physicochemical characteristics of dabai (Canarium odontophyllum Miq.) fruit. Fruits. 66(1):47-52 (2011).
CrossRef - Basri DF, Heng KY, Meng CK, Ghazali AR. Screening of antioxidant phytoextracts of Canarium odontophyllum (Miq.) leaves in vitro. J Pharm. 4(12):1-6 (2014).
- Abdul Aziz MWH, Basri DF, Masre SF, Ghazali AR. Fatty Acids and Terpenoids from Canarium odontophyllum Miq. Leaf and Their Antioxidant and Cytotoxic Effects on UVB-Induced Immortalized Human Keratinocyes Cells (HaCaT). Malaysian Applied Biology. 51(3):79-87 (2022).
CrossRef - Nengroo ZR, Rauf A. Fatty acid composition and antioxidant activities of five medicinal plants from Kashmir. Industrial Crops and Products. 140(111596 (2019).
CrossRef - Yang W, Chen X, Li Y, Guo S, Wang Z, Yu X. Advances in Pharmacological Activities of Terpenoids. Natural Product Communications. 15(3):1934578X20903555 (2020).
CrossRef - Tyagi N, Bhardwaj A, Srivastava SK, et al. Development and Characterization of a Novel in vitro Progression Model for UVB-Induced Skin Carcinogenesis. Sci Rep. 5(13894 (2015).
CrossRef - Lisby S, Gniadecki R, Wulf HC. UV-induced DNA damage in human keratinocytes: Quantitation and correlation with long-term survival. Experimental Dermatology. 14(5):349-355 (2005).
CrossRef - Arora S, Tyagi N, Bhardwaj A, et al. Silver nanoparticles protect human keratinocytes against UVB radiation-induced DNA damage and apoptosis: potential for prevention of skin carcinogenesis. Nanomedicine: Nanotechnology, Biology and Medicine. 11(5):1265-1275 (2015).
CrossRef - Miller I, Min M, Yang C, et al. Ki67 is a Graded Rather than a Binary Marker of Proliferation versus Quiescence. Cell Rep. 24(5):1105-1112.e5 (2018).
CrossRef - Darzynkiewicz Z, Zhao H, Zhang S, Lee MY, Lee EY, Zhang Z. Initiation and termination of DNA replication during S phase in relation to cyclins D1, E and A, p21WAF1, Cdt1 and the p12 subunit of DNA polymerase δ revealed in individual cells by cytometry. Oncotarget. 6(14):11735-50 (2015).
CrossRef - El-Beltagi HS, Dhawi F, Aly AA, El-Ansary AE. Chemical compositions and biological activities of the essential oils from gamma irradiated celery (Apium graveolens L.) seeds. Notulae Botanicae Horti Agrobotanici Cluj-Napoca. 48(4):2114-2133 (2020).
CrossRef - Aubrey BJ, Kelly GL, Janic A, Herold MJ, Strasser A. How does p53 induce apoptosis and how does this relate to p53-mediated tumour suppression? Cell Death Differ. 25(1):104-113 (2018).
CrossRef - Khanam NS, Agarwal A, Khan R. Antioxidant Enzyme and MDA Level in The Skin of Albino Rat Under The Stress of Artificial UVB Radiation. Journal of Experimental Biology and Agricultural Sciences. 7(6):574-578 (2019).
CrossRef - Sies H. Oxidative stress: a concept in redox biology and medicine. Redox Biol. 4(180-3 (2015).
CrossRef - Xian D, Lai R, Song J, Xiong X, Zhong J. Emerging Perspective: Role of Increased ROS and Redox Imbalance in Skin Carcinogenesis. Oxid Med Cell Longev. 2019(8127362 (2019).
CrossRef - Martinez RM, Pinho-Ribeiro FA, Steffen VS, et al. Topical Formulation Containing Naringenin: Efficacy against Ultraviolet B Irradiation-Induced Skin Inflammation and Oxidative Stress in Mice. PLoS One. 11(1):e0146296 (2016).
CrossRef - Singhal SS, Singh SP, Singhal P, Horne D, Singhal J, Awasthi S. Antioxidant role of glutathione S-transferases: 4-Hydroxynonenal, a key molecule in stress-mediated signaling. Toxicol Appl Pharmacol. 289(3):361-70 (2015).
CrossRef - Nicolaou A, Harwood JL. Skin lipids in health and disease. Lipid Technology. 28(2):36-39 (2016).
CrossRef - Luangpraditkun K, Charoensit P, Grandmottet F, Viennet C, Viyoch J. Photoprotective Potential of the Natural Artocarpin against In Vitro UVB-Induced Apoptosis. Oxidative Medicine and Cellular Longevity. 2020(1042451 (2020).
CrossRef - Wang Y, Li W, Xu S, et al. Protective skin aging effects of cherry blossom extract (Prunus Yedoensis) on oxidative stress and apoptosis in UVB-irradiated HaCaT cells. Cytotechnology. 71(2):475-487 (2019).
CrossRef - Kurutas EB. The importance of antioxidants which play the role in cellular response against oxidative/nitrosative stress: current state. Nutr J. 15(1):71 (2016).
CrossRef - Karapetsas A, Voulgaridou G-P, Konialis M, et al. Propolis Extracts Inhibit UV-Induced Photodamage in Human Experimental In Vitro Skin Models. Antioxidants. 8(5):125 (2019).
CrossRef

