
Manuscript accepted on :26-09-2023
Published online on: 01-10-2023
Plagiarism Check: Yes
Reviewed by: Dr. Nicolas Padilla
Second Review by: Dr. Rajat Goyal
Final Approval by: Dr, Patorn Promchai
Thiri Wai Linn2 , Chaw Su Hlaing3, Ma Saung Oo4, Zakaria AR4, Khin Than Yee5, Thin Thin Aung6, Aniruddha Bhattacharjee1, Minn Han7, Mya Thanda Sein8and Mya Mya Thwin1*
1Physiology Unit, International Medical School, Management and Science University, Shah Alam, Selengor, 40100, Malaysia
2Department of Physiology, Chiang Mai University, Chiang Mai 50200, Thailand.
3University of Medicine 2, Yangon, Myanmar.
4Obstetrics and Gynecology Unit, University Sultan Zainal Abidin, Kuala Terengganu 20400, Malaysia.
5Pharmacology Society, Myanmar.
6Anatomy Unit, International Medical School, Management and Science University, Selangor 40100, Malaysia.
7Dental Association, Myanmar.
8Department of Physiology, University of Medicine 1, Yangon, Myanmar.
Corresponding Author E-mail: drmyamyathwin2011@gmai.com
DOI : https://dx.doi.org/10.13005/bpj/2764
Abstract
Central adiposity presents an important risk factor for advancing insulin insensitivity and type 2 diabetes mellitus. Betatrophin, a liver or adipocyte-derived hormone, was assumed to improve islet insulin secretion and compensate insulin resistance but its level during obesity is still conflicted. This study aimed to explore serum betatrophin level in centrally-obese middle-aged men with diabetic potentials compared with age-matched non-obese ones. Sixty-eight male subjects of 40-60 years of age, residing in North Okkalapa Township, Yangon, Myanmar, were recruited and classified into centrally-obese group (n=34) and non-obese group (n=34). Fasting blood samples were obtained to quantify plasma glucose by glucose oxidase method, and serum insulin and betatrophin levels by ELISA. Plasma glucose levels were comparable between the two groups, while insulin concentration of obese group was significantly greater than that of non-obese group. Therefore, HOMA-IR was markedly increased in obese subjects when compared to non-obese ones (4.87±0.28 vs 1.90±0.14, p<0.001) and so did HOMA-β (310.88±26.58 vs 149.00±11.83, p<0.001). Interestingly, betatrophin hormone level was significantly reduced in obese group than non-obese group (1.72±0.21 vs 2.72±0.26 ng/ml, p<0.01). Moreover, betatrophin had a strong negative correlation with glucose and insulin levels (p<0.05) as well as with the indicator of central adiposity, waist circumference (p<0.05), among the subjects. However, significant correlation between betatrophin and HOMA-IR and HOMA-β was not observed in both groups (p=0.14 and 0.20 respectively). Taken together, betatrophin hormone has been found to decrease in adult central obesity, which is noticeably associated with insulin resistance and compensatory beta-cell hyperfunction. Betatrophin, previously regarded as beta-cell mitogen, has been denied in this study, owing to lack of correlation with HOMA indexes of diabetes.
Keywords
Betatrophin; Central Obesity; HOMA; Insulin Resistance; Type 2 Diabetes
Download this article as:| Copy the following to cite this article: Linn T. W, Hlaing C. S, Oo M. S, Zakaria A. R, Yee K. T, Aung T. T, Bhattacharjee A, Han M, Sein. M. T, Thwin M. M. Central Obesity Diminishes Circulating Betatrophin Level in Middle-aged Male Subjects. Biomed Pharmacol J 2023;16(3). |
| Copy the following to cite this URL: Linn T. W, Hlaing C. S, Oo M. S, Zakaria A. R, Yee K. T, Aung T. T, Bhattacharjee A, Han M, Sein. M. T, Thwin M. M. Central Obesity Diminishes Circulating Betatrophin Level in Middle-aged Male Subjects. Biomed Pharmacol J 2023;16(3). Available from: https://bit.ly/45aJmlP |
Introduction
Obesity is a major burden to people and to health care systems. The prevalence of obesity has been increasing throughout the world. Obesity is linked to a range of metabolic disorders including diabetes mellitus, atherosclerosis, gout, hypertension, ischemic heart disease, premature aging and untimely death1. Central obesity, which is characterized by intra-abdominal visceral fat accumulation, is more prone to insulin resistance and diabetes mellitus than general obesity, an accumulation of fat mainly in the subdermis2.
About 40% of overweight but otherwise healthy subjects with no metabolic disorders are found to be insulin resistant. Ectopic fat accumulation and chronic low-grade inflammation can result in reduced sensitivity to insulin, which is known as insulin resistance, in the body tissues such as skeletal muscles, adipose tissues, liver or even in pancreatic islet cells3. Under these conditions, pancreatic beta-cells respond by enhancing secretory capacity and number of cells. If this condition persists, failure of beta-cells to counteract insulin resistance can lead to uncontrolled hyperglycemia and type 2 diabetes4. Several pre-clinical investigations have identified effective beta-cell mitogens including insulin-like growth factor I, hepatocyte growth factor, incretins (glucagon-like peptide-1), glucose-dependent insulinotropic polypeptide and many others, which benefit either type 1 or type 2 diabetes5.
The discovery of betatrophin as a hormone capable of boosting beta-cell proliferation in insulin-resistance state has been addressed as a significant scientific advancement targeting to augment or replace insulin injection in clinical practice6. It is a protein hormone, made up of 198 amino acids which involves in regulation of lipid and glucose metabolism. It has been named as lipasin, angiopoietin-like protein 8 (ANGPTL8), or refeeding-induced fat and liver protein (RIFL)7. Betatrophin is produced in the liver and adipocytes that are two crucial tissues involved in insulin signaling pathways. The abnormal buildup of fat tissue not only leads to insulin resistance but also disrupts the production of betatrophin8.
Lately, there has been a growing interest in exploration of the connection between betatrophin and obesity. Rodent studies demonstrated increased levels of betatrophin in obesity, which could potentially play a role in promoting beta-cell’s growth and insulin production9,10. Moreover, a large cohort study showed a positive correlation of betatrophin to BMI, and to waist-hip ratio in people without diabetes9. Elevated betatrophin levels were observed in cases of impaired glucose tolerance and type 2 diabetes as compared to healthy subjects11. Conversely, some studies have shown that betatrophin was diminished in diabetic subjects12. Also, betatrophin levels were lower in new cases of type 2 diabetes and impaired glucose tolerance in young individuals13.
In brief, betatrophin hormone has been indicated to possess a trophic action on pancreatic beta-cells in the various states of insulin resistance with the purpose to develop an effective anti-diabetic therapy. However, the relationship between betatrophin and obesity, insulin resistance and various metabolic disorders was still a controversial situation. Physiological action of betatrophin in glucose metabolism is not still well comprehended. Accordingly, this study was designed to explore the relationship between betatrophin and central obesity in middle-aged population, who is high-risk group for developing metabolic syndrome.
Materials and Methods
This research was designed as a cross-sectional analytical (comparative) study conducted with healthy middle-aged male subjects with the age between 40-60 years. The participants were recruited from seven community wards of North Okkalapa Township, by convenient sampling method, till the required sample size was fulfilled. The subjects were distinguished according to selection criteria: non-obese subjects with waist circumference less than or equal 90cm and centrally obese subjects with waist circumference more than 90cm. Individuals who had acute illnesses, a prior history of diabetes mellitus, cardiovascular issues, or liver disease, those with a family background of diabetes mellitus, those with fasting plasma glucose level more than or equal to 126 mg/dL, smokers or chronic alcoholics were excluded in this study.
Operational definitions are as follows: Centrally-obese subject is defined as those with waist circumference more than 90cm in male and more than 80cm in female (WHO, Australia, 2000). Middle-aged subjects are those with age between 40-60 years. Chronic alcoholic is a person who drinks distilled spirits (such as vodka, whiskey, rum or gin with 40% alcohol) with an average amount of 140 ml per day for 5 years14. A smoker is one who currently smokes at least 5-10 cigarettes per day continuously for at least one year15.
Waist circumference (WC) in centimeter was gauged to the nearest 0.5 cm at the level of the mid-point between the lower margin of the lowest rib and the iliac crest in the mid-axillary plane. Participants were measured without clothing, ensuring that the tape was comfortably fitted but not exerting pressure on the skin. The measurement was taken at the end of regular breath-out, while standing position with relaxed arms beside. Hip circumference (HC) was measured in centimeter by taking the average of two readings of the narrowest circumference around the buttocks and symphysis pubis, over light clothing. Waist-hip ratio (WHR) was calculated by dividing the waist circumference by the hip circumference1. Body weight was measured in kilogram to the nearest one decimal place using a balanced beam scale. Body Mass Index (BMI) was calculated by dividing the weight in kilograms by the square of the height in meters.
After taking written informed consent, all subjects were overnight-fasted and their blood samples were collected for biochemical tests. Plasma glucose was measured by GOD-PAP (Glucose oxidase, phenol, 4-aminophenazone) method (enzymatic colorimetric test) using Glucose Liquicolor kit and serum insulin level was measured by DRG® Insulin ELISA (EIA-2935) (DRG International, Inc. NJ, USA) using sandwich enzyme-linked immunosorbent assay (ELISA). Serum betatrophin level was measured by Human Betatrophin (Total) ELISA kit (Catalog no. SK00528-08) (Aviscera Bioscience, Inc. CA, USA) using quantitative sandwich ELISA method. HOMA indices were calculated as follows. HOMA-IR value more than 2.58 was assumed as insulin resistance16.
HOMA-IR = Fasting insulin (µIU/ml) x Fasting glucose (mg/dL) / 405.1
HOMA-β = [360 × Fasting insulin (μIU/ml)] / [Fasting glucose (mg/dL) − 63]
The statistical data analysis was performed using IBM SPSS Statistics 20 software. All data were showed as mean ± standard error of the mean (SEM). A Student’s two-sample “t” test was utilized to compare the mean values between different groups. Pearson’s correlation coefficient was employed to calculate bivariate correlations between variables. Statistical significance was considered for p-values below 0.05.
This study was done according to guidelines of Protocol Board. The sampling procedure was started after approval of Research and Ethical Committee of Myanmar Medical Universities. The subjects were invited to participate in the research and their participation was voluntary. Informed consent was obtained before any study procedure. The subjects had rights to decline participation and to withdraw from the research at any time without any negative consequences or loss of any entitlements they would otherwise have received.
Results
In the present study, 68 middle-aged male subjects (34 centrally obese and 34 non-obese subjects) had participated. The overall characteristics of the subjects were showcased in Table 1. No age difference was found between two groups. Obviously, obese group was composed of individuals with significantly higher body weight and BMI than non-obese group. Their WC, HC and WHR were also greater than non-obese subjects and therefore they were considered as centrally obese ones.
Table 1: General characteristics of obese group and non-obese group.
|
Parameters |
Obese group (n=34) |
Non-obese group (n=34) |
|
Age (yr) |
48.91 ± 1.07 |
49.29 ± 0.90 |
|
Body weight (kg) |
74.38 ± 1.63 |
52.82 ± 1.54 * |
|
Height (cm) |
166.26 ± 0.94 |
163.48 ± 1.08 |
|
BMI (kg/m2) |
26.83 ± 0.42 |
19.71 ± 0.48 * |
|
Waist circumference, WC (cm) |
98.15 ± 1.08 |
76.03 ± 1.34 * |
|
Hip circumference, HC (cm) |
100.01 ± 0.97 |
86.25 ± 0.98 * |
|
Waist-hip ratio, WHR |
0.98 ± 0.01 |
0.88 ± 0.01 * |
Data are mean ± SEM (n=34/group). Unpaired “t” test was used to compare mean values. *p<0.05 between two groups.
Figure 1 illustrated glucose metabolic parameters of two subject groups. Fasting plasma glucose levels of both groups were not significantly different. However, obese subjects had considerably higher plasma insulin level (p<0.001) compared with the non-obese. From the calculations, HOMA index showing insulin resistance (HOMA-IR) and that showing pancreatic beta-cell function (HOMA-β) were notably increased in subjects with central obesity. On the other hand, centrally-obese individuals coupled with markedly lower serum betatrophin level than non-obese males.
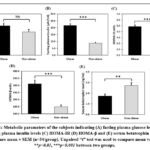 |
Figure 1: Metabolic parameters of the subjects indicating (A) fasting plasma glucose levels (B) fasting plasma insulin levels (C) HOMA-IR (D) HOMA-β and (E) serum betatrophin levels. |
Next, we investigated if there was any correlation between serum betatrophin concentration and glucose or insulin levels in all subjects including obese and normal ones (Figure 2A-B) after removing some outliners. Fasting plasma glucose as well as insulin concentration were negatively correlated with betatrophin level.
Moreover, Pearson’s correlation test showed that betatrophin level was of negative correlation with HOMA-IR and HOMA-β values but this did not show statistically significant correlation (Figure 2C-D). Interestingly, we observed that waist circumference had a significantly negative correlation with betatrophin level in the calculation (Figure 2E).
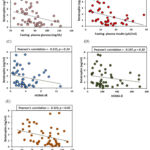 |
Figure 2: Correlation between serum betatrophin level and (A) fasting plasma glucose (B) fasting plasma insulin levels (C) HOMA-IR (D) HOMA-β. |
Discussion
To our understanding, this is the first study conducted in Myanmar which showed a correlation between hepatic hormone, betatrophin, and central obesity among middle-aged men. One of the important findings was the significant reduction in betatrophin levels in individuals with central obesity. Additionally, the obese group exhibited significantly higher insulin resistance, and beta-cell hyperfunction as compared with non-obese group. There was no significant relationship of serum betatrophin level with HOMA-IR and HOMA-β. However, a strong negative correlation was uncovered between betatrophin level and fasting glucose level and fasting insulin level.
The current study strictly limited the age of participants because age-related changes in adipose tissue can impact insulin sensitivity17, and hence, only male subjects within the 40 to 60-year age range were included in our research. Furthermore, the key criterion to allocate two groups of subjects, those with central obesity and those without, was waist circumference. BMI, which is the most widely used weight-for-height index, generally correlates well with adiposity although it can occasionally misclassify as total body fat contents. Moreover, BMI may lead to misinterpretation in cases of highly muscular athletes or individuals with extreme heights. Therefore, BMI does not accurately reflect true obesity. The important factor that determines risks of cardiovascular, cerebrovascular, metabolic disorders is the distribution of fat, not just the amount of fat. Intra-abdominal or visceral fat specifically poses a higher risk of metabolic syndromes. Although magnetic resonance imaging (MRI), computed tomography (CT), and dual-energy X-ray absorptiometry (DEXA) can measure this, they are expensive and not readily accessible1. The ratio of waist to hip circumferences (WHR) serves as a useful measure of abdominal fat accumulation, yet waist circumference (WC) is a more reliable surrogate marker of visceral obesity, as hip circumference can be prone to inaccuracies in translation. And WC measurement is recommended in evaluating patients for obesity-related disease risk1. In our study, male participants with a waist circumference exceeding 90cm were classified as centrally obese.
Plasma glucose level is greatly variable with age, sex or nutritional status. In the present study, age-matched male subjects without diabetes mellitus were chosen to participate and hence no difference in fasting glucose level was observed. Consistent with our study, non-diabetic individuals showed no significant difference in fasting blood glucose among different BMI groups while higher fasting insulin level was found in overweight/obese group18,19. Unlike our study, fasting glucose level was markedly higher in overweight/obese group than non-obese group in the study involving adult men and women9,12 as well as in the study including children of 5-14 years of age20. Actually, blood glucose homeostatic mechanism of young individuals is effective though it may be impaired in advanced age. Whether fasting glucose differs or not, fasting insulin was greatly increased in obese people compared with lean people in those reports.
This suggested that normal fasting plasma glucose level was maintained by compensatory hyperinsulinemia. Initially, pancreatic beta-cells compensate for the insulin resistance associated with obesity by secreting more insulin to maintain normal glucose levels in centrally-obese individuals21. Clinical and experimental study reports suggested that hyperinsulinemia comes before and contributes to the development of both obesity and insulin resistance. This is because insulin stimulates adipocyte differentiation, hyperplasia, or hypertrophy, leading to weight gain. Additionally, chronic obesity can result in the fat accumulation in non-adipose tissues, along with generation of proinflammatory cytokines, which promotes insulin resistance22. During the early state of insulin resistance, glucose level is maintained to be normal by increasing insulin production from beta-cells to counterbalance. Later, beta-cells become exhausted since elevated blood glucose level further stimulates insulin secretion. In summary, obesity and hyperinsulinemia appear to be closely interlinked23.
Although Hyper-insulinemic Euglycemic Clamp (HIEC) was widely accepted as the “gold standard” for evaluating insulin sensitivity, HOMA-IR) value above 2.9 units can be considered a simple indicator of insulin resistance. This is because the former method is time-consuming, expensive, and technically complex24. Moreover, HOMA-IR results were considerably correlated with the euglycemic clamp, fasting insulin concentration and hyperglycemic clamp16,25. Researchers suggested that fasting sample-derived indices were more reliable in non-diabetic subjects than type 2 diabetic ones26. The participants in the present study were literally non-diabetic individuals.
The possible causes of insulin resistance include abnormal beta-cell secretion, circulating insulin antagonists, down-regulation of insulin-responsive glucose transporter GLUT-4, and defects in mechanisms of insulin action22. Insulin sensitivity was significantly decreased in overweight/obese individuals when compared with age-matched normal weight persons9,12,18 and it was also significantly lower in older age than BMI-matched young adults27. It can be concluded that insulin sensitivity was markedly decreased in central obesity. In the pathogenesis of obesity-associated insulin resistance, adipocytes become a source of many adipokines including leptin, TNF-α, resistin, adiponectin, and so on28. Our study did not exclude dyslipidemia and hypertension which may be associated with insulin resistance.
Liver was accepted as a critical source of beta-cell growth factors in insulin-resistance state. Betatrophin, formally known as ANGPTL8, a member of Angiopoietin-like protein family, have been detected in mammalian liver, and white or brown adipose tissues7,29. Nowadays, there has been a number of studies exploring the functions of betatrophin in glucose metabolism, lipid metabolism, insulin resistance, and metabolic syndromes. Undoubtedly, betatrophin is nutritionally regulated and its hepatic expression was increased after feeding. There might be discrepancies in circulating levels of betatrophin unless the nutritional status was strictly controlled10. Therefore, only fasting blood samples were collected to determine serum betatrophin concentration in our study.
Betatrophin is secreted from the liver as well as from white adipose tissues in humans, therefore, its level might be elevated in obesity. It was proved that obesity was associated with increased level of betatrophin10. Additionally, previous study of found that circulating betatrophin level was greater in centrally obese persons than non-obese ones and decreased significantly after three-month exercise training in obese persons9. A cross-sectional study reported that normal glucose tolerant people exhibited an increase in the circulating betatrophin concentration as visceral fat expanded, while it decreased with lower limb fat. There was no notable association between betatrophin and body fat distribution in the impaired-glucose tolerant group30. These results were in contradiction to our own findings. On the other hand, it had significantly inverse correlation between waist circumference, HOMA-IR and fasting and two-hour postprandial glucose12,13,31. Betatrophin level was significantly decreased in morbid obesity but increased in anorexic women when compared with normal-weighted healthy women32. Besides, some research showed that betatrophin level had no significant difference between obese and lean subjects19. That body weight and body fat distribution are the main factors in considering circulating betatrophin concentration, has verified in the 6-month randomized control trial study with dietary modification and lifestyle intervention33.
Nevertheless, our present study reported a significant reduction of betatrophin level in obese group. The reduced levels of circulating betatrophin in obesity might be explained by the impaired ability of adipose tissue to secrete this hormone. This is because the capacity of white adipose tissue to secrete betatrophin can be impaired in the presence of obesity32. Moreover, betatrophin level may be affected by numerous uncontrollable obesity-associated changes that occur in adipose tissue and liver. The degree of inflammation, dyslipidemia or liver damage might have an impact on betatrophin secretion19. In the present study, inflammatory cytokines, lipid profiles, serological markers that indicate liver damage were not measured. Discrepancies in relation between betatrophin and obesity might be affected by ethnic variations, age difference and different kit used.
Researchers emphasized upon the positive or negative correlation between betatrophin hormone and glucose metabolism since the interest about betatrophin has raised assuming it as a favorable hormone in beta-cell replication, insulin secretion and glucose homeostasis. There has been demonstrated that betatrophin had negative correlation with fasting plasma glucose in our study consistently with the previous studies10 and it was significantly associated with two-hour post-prandial glucose13,19,34. It pointed out betatrophin would be involved in glucose homeostasis.
Previous reports demonstrated that betatrophin was significantly increased in the state of glucose intolerance34, insulin resistance10,19,35, polycystic ovarian syndrome36, type 2 diabetes37, and gestational diabetes38 in comparison to normal people. They suggested that betatrophin was a potential biomarker in insulin resistance state and diabetes mellitus. Conversely, in some reports betatrophin was reduced in diabetic subjects12,13. Due to these conflicting results, it was not clear that boosted betatrophin expression serves as a compensatory reaction or simply acts as a marker of insulin resistance. In the present study, centrally-obese group consisted of only two obese persons (BMI more than 30kg/m2) and all subjects were non-diabetic. That betatrophin was not correlated with insulin resistance might be as a result of only a few participations of subjects with extreme BMI and no involvement of diabetic subjects.
In the present study, centrally-obese group had significantly higher HOMA-β value than non-obese group. Thus, pancreatic beta-cells in central obesity may compensate the condition of peripheral insulin resistance. Beyond the compensated state, beta-cells would be exhausted and diabetes mellitus might develop. Not a significant correlation was found between beta-cell function (as indicated as HOMA-β) and serum betatrophin level. Therefore, serum betatrophin level was not associated with beta-cell’s compensation ability and might not be responsible hormone to beta-cell proliferation. Supporting to it, in the study of mice lacking betatrophin, normal glucose homeostasis was found39 and normal beta-cell mass was exhibited40. Elevated hepatic betatrophin expression was showed to increase mice beta-cell mass but not human beta-cells transplanted into mice41. These animal studies verified that betatrophin was not recommended to be beta-cell mitogen. On the other hand, in human study, increased serum betatrophin was noted in individuals with deprived beta-cell function, serving as a compensated hormone. Likewise, betatrophin levels were found to be elevated in cases of type 2 diabetes characterized by diminished beta-cell function as opposed to normal or impaired glucose tolerance but better beta-cell function34. Therefore, the role of betatrophin in glucose homeostasis and insulin secretion remains complicated.
Limitations
The present study was cross-sectional analytical study, and it focused only on the relationship of betatrophin and glucose metabolic parameters. Thus, it cannot establish a cause-effect relationship between betatrophin hormone and obesity-related metabolic diseases. Due to the conflicting findings in various studies, including the current one, the mechanism of betatrophin in glucose metabolism remains unclear. Further advanced research is recommended to investigate and confirm the regulation, function, and clinical significance of the betatrophin hormone.
Conclusion
To conclude, the current study showed that central obesity was associated with insulin resistance, hyperinsulinemia without hyperglycemia, beta-cell hyperfunction, plus significant reduction in betatrophin hormone. It was also observed that betatrophin was appreciably reduced in central obesity and strongly concomitant with lower blood glucose and insulin levels. These findings suggest that the primary reason for the lower levels of serum betatrophin in central obesity is likely the diminished capacity of adipose tissues to form betatrophin. Another significant observation is that betatrophin did not demonstrate an ability to enhance beta-cell function and might not involve in compensatory mechanism to insulin resistance in central obesity. Therefore, our study did not support the previous assumption that betatrophin acts as a mitogen for human beta-cells.
Acknowledgement
We would like to acknowledge the valuable guidance and support of our supervisors. We declare that this work was done by the authors named in this article and all liabilities pertaining to claims relating to the content of this article will be borne by the authors.
Conflict of Interest
The authors declare that there are no conflicts of interest regarding the publication of this paper.
References
- World Health Organization. Regional Office for the Western Pacific. The Asia-Pacific perspective: redefining obesity and its treatment. Sydney: Health Communications Australia. 2000:1-56. https://apps.who.int/iris/handle/10665/206936
- Tchernof A, Després JP. Pathophysiology of human visceral obesity: an update. Physiol Rev. 2013;93(1):359-404. doi:10.1152/physrev.00033.2011
- Muniyappa R, Lee S, Chen H, Quon MJ. Current approaches for assessing insulin sensitivity and resistance in vivo: advantages, limitations, and appropriate usage. Am J Physiol Endocrinol Metab. 2008;294(1):E15-E26. doi:10.1152/ajpendo.00645.2007
- Kulkarni RN, Mizrachi EB, Ocana AG, Stewart AF. Human β-cell proliferation and intracellular signaling: driving in the dark without a road map. Diabetes. 2012;61(9):2205-2213. doi:10.2337/db12-0018
- Shcheglova E, Blaszczyk K, Borowiak M. Mitogen Synergy: An Emerging Route to Boosting Human Beta Cell Proliferation. Front Cell Dev Biol. 2022;9:734597. doi:10.3389/fcell.2021.734597
- Kugelberg E. Diabetes: Betatrophin–inducing β-cell expansion to treat diabetes mellitus? Nat Rev Endocrinol. 2013;9(7):379. doi:10.1038/nrendo.2013.98
- Ren G, Kim JY, Smas CM. Identification of RIFL, a novel adipocyte-enriched insulin target gene with a role in lipid metabolism. Am J Physiol Endocrinol Metab. 2012;303(3):E334-E351. doi:10.1152/ajpendo.00084.2012
- Abu-Farha M, Abubaker J, Tuomilehto J. ANGPTL8 (betatrophin) role in diabetes and metabolic diseases. Diabetes Metab Res Rev. 2017;33(8):10.1002/dmrr.2919. doi:10.1002/dmrr.2919
- Abu-Farha M, Abubaker J, Al-Khairi I, et al. Higher plasma betatrophin/ANGPTL8 level in Type 2 Diabetes subjects does not correlate with blood glucose or insulin resistance. Sci Rep. 2015;5:10949. Published 2015 Jun 16. doi:10.1038/srep10949
- Fu Z, Yao F, Abou-Samra AB, Zhang R. Lipasin, thermoregulated in brown fat, is a novel but atypical member of the angiopoietin-like protein family. Biochem Biophys Res Commun. 2013;430(3):1126-1131. doi:10.1016/j.bbrc.2012.12.025
- Chen CC, Susanto H, Chuang WH, Liu TY, Wang CH. Higher serum betatrophin level in type 2 diabetes subjects is associated with urinary albumin excretion and renal function [published correction appears in Cardiovasc Diabetol. 2017 Apr 26;16(1):58]. Cardiovasc Diabetol. 2016;15:3. Published 2016 Jan 7. doi:10.1186/s12933-015-0326-9
- Gómez-Ambrosi J, Pascual E, Catalán V, et al. Circulating betatrophin concentrations are decreased in human obesity and type 2 diabetes. J Clin Endocrinol Metab. 2014;99(10):E2004-E2009. doi:10.1210/jc.2014-1568
- Gokulakrishnan K, Manokaran K, Pandey GK, et al. Relationship of betatrophin with youth onset type 2 diabetes among Asian Indians. Diabetes Res Clin Pract. 2015;109(1):71-76. doi:10.1016/j.diabres.2015.04.028
- Lecomte E, Herbeth B, Pirollet P, et al. Effect of alcohol consumption on blood antioxidant nutrients and oxidative stress indicators. Am J Clin Nutr. 1994;60(2):255-261. doi:10.1093/ajcn/60.2.255
- Bloomer RJ. Decreased blood antioxidant capacity and increased lipid peroxidation in young cigarette smokers compared to nonsmokers: Impact of dietary intake. Nutr J. 2007;6:39. Published 2007 Nov 8. doi:10.1186/1475-2891-6-39
- Matthews DR, Hosker JP, Rudenski AS, Naylor BA, Treacher DF, Turner RC. Homeostasis model assessment: insulin resistance and beta-cell function from fasting plasma glucose and insulin concentrations in man. Diabetologia. 1985;28(7):412-419. doi:10.1007/BF00280883
- Ou MY, Zhang H, Tan PC, Zhou SB, Li QF. Adipose tissue aging: mechanisms and therapeutic implications. Cell Death Dis. 2022;13(4):300. Published 2022 Apr 4. doi:10.1038/s41419-022-04752-6
- Segal KR, Landt M, Klein S. Relationship between insulin sensitivity and plasma leptin concentration in lean and obese men. Diabetes. 1996;45(7):988-991. doi:10.2337/diab.45.7.988
- Guo K, Lu J, Yu H, et al. Serum betatrophin concentrations are significantly increased in overweight but not in obese or type 2 diabetic individuals. Obesity (Silver Spring). 2015;23(4):793-797. doi:10.1002/oby.21038
- Wu S, Gao H, Ma Y, Fu L, Zhang C, Luo X. Characterisation of betatrophin concentrations in childhood and adolescent obesity and insulin resistance. Pediatr Diabetes. 2016;17(1):53-60. doi:10.1111/pedi.12233
- Shanik MH, Xu Y, Skrha J, Dankner R, Zick Y, Roth J. Insulin resistance and hyperinsulinemia: is hyperinsulinemia the cart or the horse? Diabetes Care. 2008;31Suppl 2:S262-S268. doi:10.2337/dc08-s264
- Yaribeygi H, Farrokhi FR, Butler AE, Sahebkar A. Insulin resistance: Review of the underlying molecular mechanisms. J Cell Physiol. 2019;234(6):8152-8161. doi:10.1002/jcp.27603
- Saltiel AR, Kahn CR. Insulin signalling and the regulation of glucose and lipid metabolism. Nature. 2001;414(6865):799-806. doi:10.1038/414799a
- DeFronzo RA, Tobin JD, Andres R. Glucose clamp technique: a method for quantifying insulin secretion and resistance. Am J Physiol. 1979;237(3):E214-E223. doi:10.1152/ajpendo.1979.237.3.E214
- Bonora E, Kiechl S, Willeit J, et al. Prevalence of insulin resistance in metabolic disorders: the Bruneck Study. Diabetes. 1998;47(10):1643-1649. doi:10.2337/diabetes.47.10.1643
- Borai A, Livingstone C, Kaddam I, Ferns G. Selection of the appropriate method for the assessment of insulin resistance. BMC Med Res Methodol. 2011;11:158. Published 2011 Nov 23. doi:10.1186/1471-2288-11-158
- Cnop M, Havel PJ, Utzschneider KM, et al. Relationship of adiponectin to body fat distribution, insulin sensitivity and plasma lipoproteins: evidence for independent roles of age and sex. Diabetologia. 2003;46(4):459-469. doi:10.1007/s00125-003-1074-z
- Shepherd PR, Kahn BB. Glucose transporters and insulin action–implications for insulin resistance and diabetes mellitus. N Engl J Med. 1999;341(4):248-257. doi:10.1056/NEJM199907223410406
- Zhang R. Lipasin, a novel nutritionally-regulated liver-enriched factor that regulates serum triglyceride levels. Biochem Biophys Res Commun. 2012;424(4):786-792. doi:10.1016/j.bbrc.2012.07.038
- Zheng J, Liu J, Hong BS, Ke W, Huang M, Li Y. Circulating betatrophin/ANGPTL8 levels correlate with body fat distribution in individuals with normal glucose tolerance but not those with glucose disorders. BMC Endocr Disord. 2020;20(1):51. Published 2020 Apr 16. doi:10.1186/s12902-020-0531-8
- Tuhan H, Abacı A, Anık A, et al. Circulating betatrophin concentration is negatively correlated with insulin resistance in obese children and adolescents. Diabetes Res Clin Pract. 2016;114:37-42. doi:10.1016/j.diabres.2016.02.008
- Barja-Fernández S, Folgueira C, Seoane LM, et al. Circulating Betatrophin Levels Are Increased in Anorexia and Decreased in Morbidly Obese Women. J Clin Endocrinol Metab. 2015;100(9):E1188-E1196. doi:10.1210/JC.2015-1595
- Hu H, Yuan G, Wang X, et al. Effects of a diet with or without physical activity on angiopoietin-like protein 8 concentrations in overweight/obese patients with newly diagnosed type 2 diabetes: a randomized controlled trial. Endocr J. 2019;66(1):89-105. doi:10.1507/endocrj.EJ18-0191
- Gao T, Jin K, Chen P, et al. Circulating Betatrophin Correlates with Triglycerides and Postprandial Glucose among Different Glucose Tolerance Statuses–A Case-Control Study. PLoS One. 2015;10(8):e0133640. Published 2015 Aug 6. doi:10.1371/journal.pone.0133640
- Qu Q, Zhao D, Zhang F, Bao H, Yang Q. Serum betatrophin levels are increased and associated with insulin resistance in patients with polycystic ovary syndrome. J Int Med Res. 2017;45(1):193-202. doi:10.1177/0300060516680441
- Wang H, Du L, Wu T, et al. Circulating betatrophin is associated with insulin resistance in humans: cross-sectional and interventional studies in vivo and in vitro. Oncotarget. 2017;8(57):96604-96614. Published 2017 Oct 16. doi:10.18632/oncotarget.21852
- Tokumoto S, Hamamoto Y, Fujimoto K, et al. Correlation of circulating betatrophin concentrations with insulin secretion capacity, evaluated by glucagon stimulation tests. Diabet Med. 2015;32(5):653-656. doi:10.1111/dme.12696
- Kong FJ, Ma LL, Li G, Chen YX, Zhou JQ. Circulating Betatrophin Levels and Gestational Diabetes Mellitus: A Systematic Review and Meta-Analysis [published correction appears in PLoS One. 2017 Feb 14;12 (2):e0172449]. PLoS One. 2017;12(1):e0169941. Published 2017 Jan 12. doi:10.1371/journal.pone.0169941
- Wang Y, Quagliarini F, Gusarova V, et al. Mice lacking ANGPTL8 (Betatrophin) manifest disrupted triglyceride metabolism without impaired glucose homeostasis. Proc Natl Acad Sci USA. 2013;110(40):16109-16114. doi:10.1073/pnas.1315292110
- Gusarova V, Alexa CA, Na E, et al. ANGPTL8/betatrophin does not control pancreatic beta cell expansion. Cell. 2014;159(3):691-696. doi:10.1016/j.cell.2014.09.027
- Jiao Y, Le Lay J, Yu M, Naji A, Kaestner KH. Elevated mouse hepatic betatrophin expression does not increase human β-cell replication in the transplant setting. Diabetes. 2014;63(4):1283-1288. doi:10.2337/db13-1435

