
Manuscript accepted on :26-12-2022
Published online on: 13-04-2023
Plagiarism Check: Yes
Reviewed by: Dr. Danial Kahrizi
Second Review by: Dr. Pankaj Singh
Final Approval by: Dr. Eman Refaat Youness
Abhishek Sengupta1* , Priyanka Narad1, Romasha Gupta1 , Aayushi Gupta1 and Nagma Abbasi2
1Amity Institute of Biotechnology, Amity University, Noida, India.
2NextGen Lifesciences, New Delhi, India.
Corresponding Author E-mail: asengupta@amity.edu
DOI : https://dx.doi.org/10.13005/bpj/2659
Abstract
Polycystic Ovarian Syndrome (PCOS) is perhaps the most common Metabolic, Endocrine disorder characterized in females before menopause. PCOS majorly elevates Androgen (AR) levels and irregularities in menstrual cycles or can be morphologically seen as multiple cysts in the ovary. Patients with PCOS are more likely to develop obesity, cardiovascular disease, as well as insulin resistance. The etiology of this disease is still not known, but research suggests it can be due to environmental factors, lifestyle, or diet. According to a recent study, the glycolytic enzyme Phosphoglycerate Kinase 1 (PGK1) has an effective role in PCOS patients as it binds with AR, which is high gets expressed in PCOS patients. Thus, it can be a main causable factor for PCOS patients. The granulosa cells of the ovary provide nutrients to oocytes for development. The energy to the oocytes comes via cycle glycolysis. In PCOS patients, these granulosa cells show degradation. As a result, there may be a malfunction in the energy supply via granulosa cells, with Phosphoglycerate Kinase 1(PGK1) being one of the key glycolysis enzymes. And as the high levels of AR remain in proximity with disordered follicle development in PCOS. The actual significance of AR in the fertility of PCOS patients is still not known. Thus, we can have a close look at Androgen binding Receptors (ARs) and the role of PGK1. In this research, we analyzed single-cell RNA sequence data from Gene Expression Omnibus (GEO), including data from control Dihydrotestosterone (DHT) and PGK1-DHT of PCOS patients generated by deep sequencing in triplicate. Further, we explain the transcriptomic dynamics by co-expression network analysis and evaluate the differences between PCA and limmavoom analysis to discover which genes are differentially expressed. By calculating the p-value and performing gene ontology (GO) enrichment analysis, we were able to identify multiple genes with greater expression levels in the PGK1-DHT samples of PCOS patients, including insulin-related, glycolytic, tumor-associated, and apoptotic genes. We also carried out Functional enrichment and gene co-expression network analysis. Its biological, molecular, and cellular domain lies in the intracellular membrane-bound organelle. Gene co-expression network and functional enrichment found significant enrichment and highly differentially expressed genes in the intracellular cellular domain.
Keywords
Deep sequencing; Gene ontology; Glycolysis; Metabolic; Transcriptomic
Download this article as:| Copy the following to cite this article: Sengupta A, Narad P, Gupta R, Gupta A, Abbasi N. Deciphering the Role of Phosphoglycerate Kinase 1 in Polycystic Ovarian Syndrome using Differential Gene Expression Analysis Approach. Biomed Pharmacol J 2023;16(2). |
| Copy the following to cite this URL: Sengupta A, Narad P, Gupta R, Gupta A, Abbasi N. Deciphering the Role of Phosphoglycerate Kinase 1 in Polycystic Ovarian Syndrome using Differential Gene Expression Analysis Approach. Biomed Pharmacol J 2023;16(2). Available from: https://bit.ly/43wdYys |
Introduction
PCOS (Polycystic ovary Syndrome) is described as disordered folliculogenesis. PCOS has affected nearly 5-20 % of females of reproductive age worldwide1, 2. Women diagnosed with PCOS suffers from fertility issues, miscarriage, or reproductive-related issues3. The Granulosa cells that surround these follicles are degraded and dysfunctional. Patients with PCOS have higher levels of insulin resistance and type 2 diabetes mellitus. Increase evidence of cardiovascular disease is also observed in PCOS-affected patients. This condition is morphologically characterized by hirsutism and according to previous studies, high levels of androgens, and ovarian dysfunction are mainly responsible for hirsutism in the younger generation. Researchers have shown that insulin resistance creates a disturbance in reproductive and metabolic parts in women with PCOS by increasing AR levels synergistically with luteinizing hormone (LH)4, which eventually decreases the globulins that bind to the sex hormones. Despite increasing health diseases reported regarding PCOS, there is still no clearance, etiology, clinical reason, association, and treatment for the syndrome. Women suffer from hyperandrogenic ovarian dysfunction, which is Gonadotrophin-dependent, meaning that suppressing Gonadotrophin will also suppress hyperandrogen secretion4. PCOS was then also otherwise explained as a hyperandrogenic disorder, no matter it shows polycystic ovaries or LH elevation. Now, AR appears to be intimately associated with PCOS patients, who, as previously said, have many cysts in their ovaries. The Granulosa cells in the ovary express AR at most of its follicular development. In a study, researchers found that PGK1 connects to AR in the granulosa cells by performing mass spectrometry and testing it on ovarian tissues of a mouse having PCOS by the method of western blotting and q-RT PCR5. PGK1 has a massive part in the aerobic glycolytic pathway. The granulosa cells around follicles need energy from the Glycolysis pathway and as GC relies on Glycolysis for energy supply, we have also seen an abnormality in the glycolysis cycle or mitochondrial function. In Glycolysis PGK1 is responsible for catalyzing reversible transfer from 1,3-bisphosphoglycerate of the phosphate group to ADP, which produces ATP and 3-phosphoglycerate6, PGK is a monomeric protein and PGK1 is the enzyme carried only on X-linked gene. The glycolytic enzyme PGK1 promoted several ovulation-related genes and cell death regulation i.e. apoptosis, when associated with AR by regulating its metabolism. Liu and colleagues identified PGK1 and AR as the sole axis responsible for aberrant folliculogenesis or polycystic ovarian syndrome in a new study published in EBioMedicine. In their study, they also confirmed by inducing diseased mice with PTX paclitaxel, a common therapeutic drug that suppressed the high levels of the PGK1 and AR by performing immunohistochemistry or western blotting. Thus, we see any abnormality in PGK1 associated with AR can also lead to PCOS-related disorder. Despite this enlightenment by researchers, various therapeutical target-specific genes responsible for these high PGK1 levels remain unanswered and need clarification.
We seek to find genes that are linked to the PGK1-AR axis in our analysis that can be exploited as a common therapeutic target to treat disrupted folliculogenesis in the future or as a permanent treatment for PCOS. We did so by analyzing single-celled RNA seq transcriptomic data gleaned from a previous study, which included deep sequencing generated Dihydrotestosterone (DHT) and PGK1-DHT of PCOS patients. We discover the important genes on the PGK1-AR axis using bioinformatics methods and the Limma-voom package, then perform gene ontology (GO) enrichment analysis and co-expression network to determine the primary molecular, cellular domain.
Materials and methods
Data Retrieval
Samples were collected from a study under GEO accession number GSE146856 of NCBI (National Centre for Biotechnology Information). Both the cell lines of Human and tumour cell lines of Granulosa cells KGN were preserved. The Granulosa cells were retrieved out from the ovary’s follicular fluid. The shPGK1 and shCtrl lentiviral vectors were transfected on KGN cell lines5. After using methods such as western blotting and qRT-PCR, the quantities of mRNA and protein were determined. In the western blotting, the cells were lysed, sodium dodecyl sulphate (SDS) was used, and the cell culture was then incubated and preserved. As the lentiviral vectors shRNA PGK1 was treated on tumour cell lines of Granulosa cells (KGN) they were then provoked by DHT. The DHT treated control samples and shRNA PGK1 samples were collected.
Differential gene analysis
The RNA samples under study GSE146856 were gathered and processed with the Illumina RNA-seq library. Raw sequenced reads were mapped to the reference human genome and the reads per kilobase per million (RKPM) were obtained, the values for the expression of each gene were assigned. Various Bioinformatics analysis and Visualization was done on the expression count data. Heat map for the gene that would be the most variable was constructed. The differential most variable genes for shRNA treated PGK1 with DHT and control DHT were identified. The Limma-voom package of R was used to detect differentially expressed genes by employing a mean-variance connection in the data and applying a linear model to voom transformed data. We estimated the associated p-value and modern t-statistics by performing shrinkage of variance on the two groups using function eBayes. To find out significant genes, we cut off on a p-value threshold by discarding small logFC’s and ranking them by p-value. Differential expression followed by gene ontology (GO) enrichment analysis displayed the top set of GO terms which are most enriched using function goana of R.
ChIP-Seq and Data Processing
The R package limma-voom was used to prepare the library and perform the DGE analysis, which started with sequencing the raw data.After mapping to the reference genome, the genes are enumerated and stored as counts, upon which various statistical analysis was done. The Annotation package org.Hs.eg.db was used to annotate all of the genes. The cpm function from edgeR library was used to develop the CPM values and then the lowly expressed counts were filtered. The counts were checked for their good quality. MDSplot is used for visualization and to perform principal component analysis to determine high variance on the data. Multiple Multidimensional Scaling plots were built. The mean-variance was found out and the volcano plot was built. To obtain the hierarchical clustering of the samples, a heatmap was constructed for the 500 most variable genes. To eliminate the composition bias among the libraries TMM normalization was performed. The read counts were transformed to logCPMs using voom function. The mean-variance trend plot identified the correlation between log2 count and standard deviation. We used R’s lmfit function to find gene-wise variance, as well as the cumulative number of genes that were upregulated or downregulated was calculated for each sample, along with their expression value.
Statistical Analysis
The descriptive results of the comparison of two groups are expressed as mean ± SD. The associated moderated t-statistics found out the difference between two groups by performing shrinkage on mean-variance trend. P-value less than 0.05 was considered significant statistically to find out significant differences.
Results and Discussion
Identifying genes that have been upregulated and downregulated
The transcriptome data were extracted and analyzed. The RNA transcriptomes sequenced by technologies Illumina hi seq was used. Count data was collected from the previously published group Liu and colleagues5. As we were interested in finding out which genes were differentially expressed in two groups. We used the limma package to find out differently expressed genes and found that 949 genes are downregulated in control DHT, 1556 did not signalled and 12363 are upregulated in control DHT. In PGK1-DHT induced granulosa cells of PCOS patients we found out 898 genes to be downregulated, 1548 did not signalled at all, and 12422 upregulated [Figure 1]. The PGK1-AR axis displayed more upregulated genes indicating its abundance in human granulosa cells. We also built a contrast or a matrix between control DHT and PGK1-DHT induced we found out 2306 genes were upregulated, 10024 did not signalled and 2538 genes downregulated. The result is depicted in the figure [Figure 2].
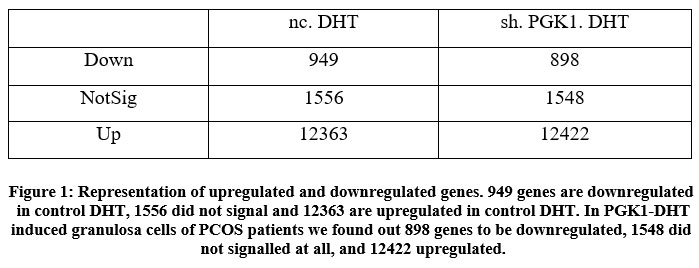 |
Figure 1: Representation of upregulated and downregulated genes. 949 genes are downregulated in control DHT, 1556 did not signal and 12363 are upregulated in control DHT. |
 |
Figure 2: Representation of upregulated and downregulated genes in contrast matrix where 2306 genes were upregulated, 10024 did not signalled and 2538 genes downregulated. |
Statistical Analysis
The transcriptome data were extracted and analyzed. The RNA transcriptomes sequenced by technologies Illumina hi seq was used. The summary of the count data following the reference genome’s mapping is obtained [Figure 3]. RNA-Seq analysis or differential gene expression analysis was performed using Bioconductor/R Packages DESeq R package. The annotation information was added using org.Hs.eg.db package. Genes that interfered with some statistical calculations, approximation and which expressed quite low were removed. Only those genes that expressed above 0.5 at CPM (counts per million) were retained using library edgeR. A plot of the first gene was built using cpm function to check whether our threshold of 0.5 corresponds to a count of 10-15 [Figure 4].
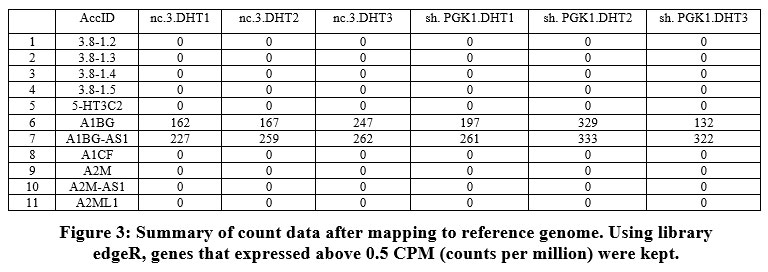 |
Figure 3: Summary of count data after mapping to reference genome. Using library edgeR, genes that expressed above 0.5 CPM (counts per million) were kept. |
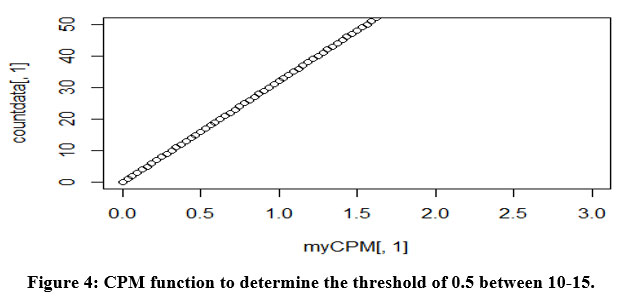 |
Figure 4: CPM function to determine the threshold of 0.5 between 10-15. |
The count data we acquired for the genes was not formally distributed, so we use the box plot on the scale of log2 to check the distribution of our count data. The log2 counts per million are represented on a boxplot [Figure 5].
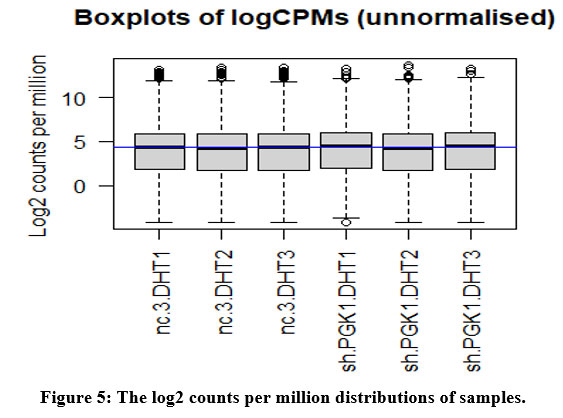 |
Figure 5: The log2 counts per million distributions of samples. |
Principal Component Analysis and MDS Plot
We determined the variation in data by building the MDSplot which is a visualization technique of Principal Component Analysis (PCA), an unsupervised learning method where we do not specify the groups and we perform exploratory analysis of high-quality data. It reduced the dimensionality by creating uncorrelated variables that maximized the variance between the groups. We see the PGK1 induced sample forms a different cluster. Thus, forming a different group [Figure 6], we identified variance in two different groups control DHT and PKG1-DHT induced.
 |
Figure 6: Principal Component Analysis, MDSplot to determine variation in samples. |
To explore the different dimensions in our samples interactively we used Glimma package and built MD-Plot (mean-difference plot) and volcano plot. On the left side of [Figure 7], we have MDS Plot and on the right, each dimension explained the amount of variation in our samples.
 |
Figure 7: MDS Plot to determine the interactive variance in samples. |
Variable genes analysis
Certain visualization-like heatmaps were constructed to hierarchically cluster our samples. We determined the 500 most variable genes in our samples and calculated a matrix from logCPMs for Euclidean distances. The heatmap for the 500 most variable genes is represented in the given figure [Figure 8].
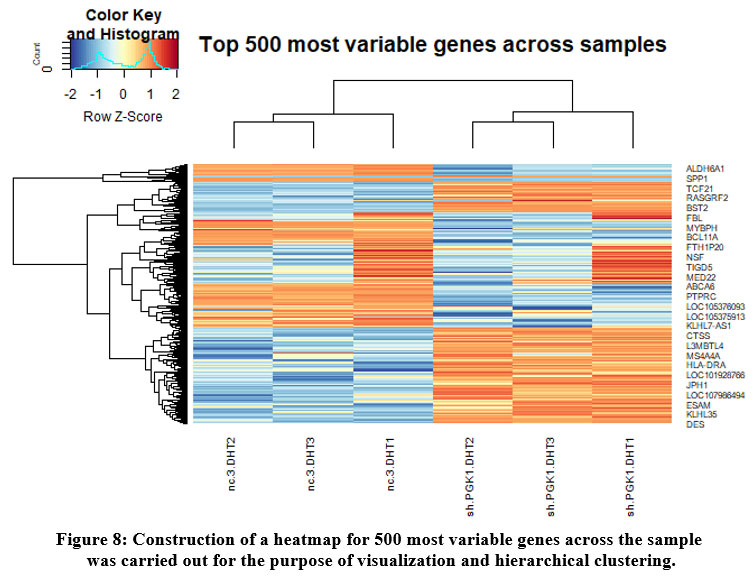 |
Figure 8: Construction of a heatmap for 500 most variable genes across the sample was carried out for the purpose of visualization and hierarchical clustering. |
The MD-Plot indicates the average expression on X-axis against the fold change on Y-axis. We perform normalization biases to eliminate composition biases across libraries. We plot the mean difference plot of the samples having the large normalization factors [Figure 9].
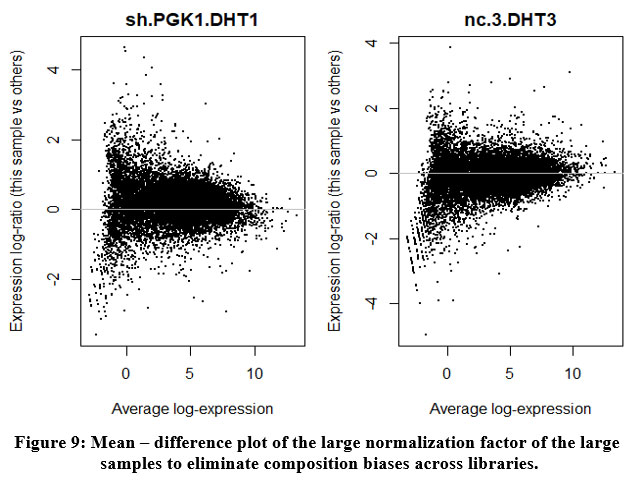 |
Figure 9: Mean – difference plot of the large normalization factor of the large samples to eliminate composition biases across libraries. |
Differential gene analysis
We use differential gene analysis to identify genes that are differentially expressed in PCOS patients and the levels of PGK1, which had shown high levels in granulosa cells of PCOS patients. Both PGK1 and AR levels are raised in PCOS luteinized Granulosa cells, indicating that PGK1 is a unique AR binding partner. We test for differential genes using Limma package and discover the genes that have been upregulated and ones that have been downregulated. As a result, PGK1-DHT has more upregulated genes which means the PGK1-DHT transcript is more enriched related to the other compared sample. Thus, the PGK1-DHT samples are highly expressed.
In our study as we find out the significant genes, we build some genome-wide plots like MD Plots or Volcano plots. We highlight the most relevant genes in PGK1.DHT samples. As illustrated in the figure, the MD plot illustrates the upregulated and downregulated genes on a log fold change basis [Figure 10] and the volcano plot shows the top 100 significant genes, highlighted by using gene symbols [Figure 11].
 |
Figure 10: MD Plot describing average log expression values of the upregulated and downregulated genes of the PGK1.DHT samples and control DHT samples on the log-fold-change. |
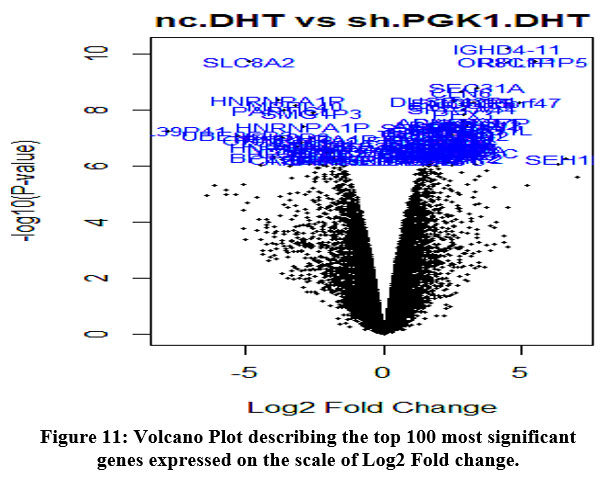 |
Figure 11: Volcano Plot describing the top 100 most significant genes expressed on the scale of Log2 Fold change. |
Treat Analysis
Since we got a lot of differential expressions, we do not cut off on a fold change or p-value to find out the most significant gene. As ranking on just p-value and then discarding genes based on small FC’s often leads to false or wrong discoveries Instead, we perform the TREAT (Testing relative to a threshold) method to perform the analysis and identify the essential genes correctly. Here we consider only those genes that have 1 as the absolute logFC value which eventually corresponds to a fold change of double or half. Using Treat analysis, we rank genes based on logFC and p-value and find out 97 genes to be downregulated, 14640 as not signalled, and 131 as upregulated on the contrast of our samples.
We construct the top table and find INSIG1, SCD, SPP1, PGK1, SMPD3, CA9, IFI6, COL1A2, CEMIP, PLEKHA7 as the most significant genes. The genes highlighted can be seen in MA Plot [Figure 12].
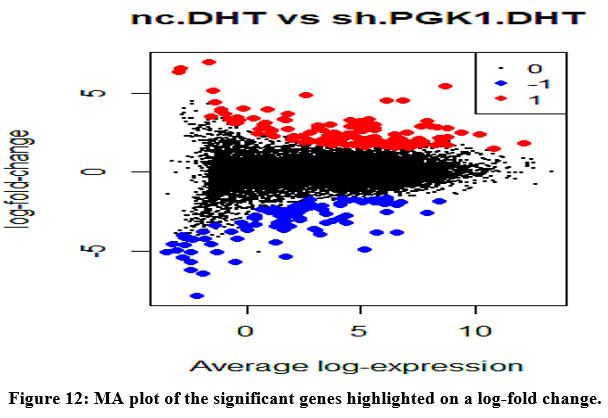 |
Figure 12: MA plot of the significant genes highlighted on a log-fold change. |
Gene set testing
To understand the long listing of significant genes, we come up with a common downstream procedure which is gene set testing. Gene set testing finds out the biological pathway or network of the differentially expressed genes. Using Goana function and performing Gene ontology (GO) enrichment analysis we annotate the genes and find out molecular function or biological process. As a result, in the intracellular cellular compartment, we discovered significant enrichment and highly differentially expressed genes [Figure 13].
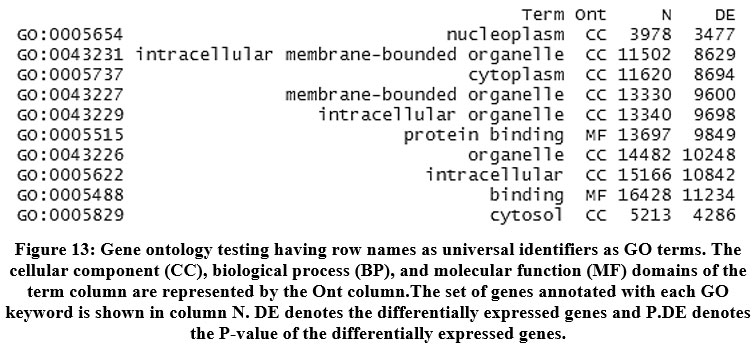 |
Figure 13:Gene ontology testing having row names as universal identifiers as GO terms. The cellular component (CC), biological process (BP), and molecular function (MF) domains of the term column are represented by the Ont column. |
Through RNA seq analysis, we found several genes associated with and expressed by the PGK1-AR axis in this analysis, which could lead to a potential therapeutic for the disorders folliculogenesis and polycystic ovarian syndrome. Although the study of Liu, sun colleagues has enlightened us with this signalling pathway. The sole genes responsible for the therapeutic targeting and future research remain unanswered and need clarification. Liu and colleagues discovered PGK1 and AR as the primary axis responsible for aberrant folliculogenesis in the ovary in a recent study published in EBioMedicine. They determined it by investigating it in its molecular signalling pathway. In ovarian granulosa cells from the patients undergoing in vitro fertilisation, PGK1 was discovered to be a unique AR binding partner. When PCOS-affected mice were given the chemotherapeutic medication paclitaxel, the link between PGK1 and AR was verified (PTX). The drug is commonly used to suppress ovarian cancers7. The PTX treatment in mice suppressed the PGK1-AR levels. Thus, indicating PGK1 is responsible for disordered folliculogenesis through the AR axis signalling pathway. PGK1, an important component of the Glycolysis pathway, regulates glucose metabolism in human ovarian tumour cell lines (KGN). Androgen remains the main regulator of Granulosa cells. Through genomic activities, AR functions primarily as a nuclear receptor8. An important mechanism for androgen-related genes like prostate cancer and androgen abnormality is considered by abnormal splicing of AR, suggesting abnormal AR splicing is indeed the primary reasonfor PCOS in women9. In this study, we perform RNA sequencing to provide the first knowledge on genes regulated on the PGK1-AR axis, and to further find out the cellular domain and highly differentially expressed genes. In addition, we performed gene co-expression network analysis to find out how the PGK1 network contributes to PCOS phenotypes. First, we visualized the samples controlled DHT and PGK1-DHT in PCOS patients and identified the co-regulatory relationship among the samples. The essential feature of PCOS is hyperandrogenism1 and the co-expression network and testing relative to a threshold method identified significant genes by considering 1 as the absolute logFC value. The driver genes discovered during the creation of the Top table were INSIG1, SCD, SPP1, PGK1, SMPD3, CA9, IFI6, COL1A2, CEMIP, and PLEKHA7. The genes significantly expressed were related to insulin production, glycolysis, tumour-associated, apoptosis10. Gene ontology (GO) enrichment analysis indicated biological, molecular, cellular domain lies majorly in the intracellular membrane-bound organelle. Enhanced AR expression in Granulosa cells changes AR recruitment techniques and gene expression levels triggered by androgen via nucleocytoplasmic transport. Thus, interrupting androgen metabolism and folliculogenesis, suggesting that abnormal splicing can lead to hyperandrogenism and disordered folliculogenesis9. On building contrast between two groups in our sample control DHT and PGK1-DHT, we found 97 genes to be downregulated, 14640 as not signalled and 131 as upregulated, implying a considerable degree of expression change among samples and indicating PGK1 and AR may have a crucial role to play on ovulation related disorder. In the previous study, PGK1 was revealed to be dependent on E3 ligase SPK2 to increase the stability of AR and inhibit the ubiquitination of AR5. In our study, the differential expressed genes were also closely related to insulin-induced genes and according to the studies insulin is considered to be the most significant element contributing to PCOS pathology. The homeostasis in metabolism is regulated by insulin and leads to ovarian steroidogenesis11. PCOS-diagnosed women have increased levels of glucose intolerance and syndrome related to metabolism. It’s imperative to remember that excess androgen is found to be a contributing factor to insulin resistance. Underlying PCOS there is a vicious cycle between hyperinsulinemia and hyperandrogenaemia11. SCD, a lipoxygenase enzyme, was shown to be abundantly expressed in omental fat of PCOS patients, contributing to insulin resistance by promoting the oxidation of different fatty acids, further leading to chronic inflammation in PCOS patients. In animals, SPP1 is a crucial regulator in the uterine foetal connection because it is highly expressed. The expression of SPP1 is related to implantation and decidualization. During the period of pregnancy, Spp1 is secreted by glandular epithelial cells. The Spp1 mRNA level is increased by DHEA treatment and expression of the protein in stromal cells of human endometrium while it goes decidualization in vitro. CA9 (carbonic anhydrase gene) is also the one closely related and according to the studies its biological pathway is involved in tumorigenesis or transformation. On the treatment of androgen or DHT on our samples, genes induced by interferon such as IFI6 (Interferon Alpha Inducible Protein 6) were highly upregulated. IFI6 is found to be regulated for the process of apoptosis and is significantly altered on our samples induced by PGK1-DHT. Some fibril-forming collagen genes like COL1A2 (Collagen Type I Alpha 2 Chain) found in connective tissues are also altered while performing differential gene analysis. The gene expression of COL1A2 is highly impacted and in previous studies, COL1A2 has impacted obese and PCOS patients in moderate age group differences12. COL1A2 is the gene in the tissue fibrosis pathway which is TGFβ regulated. There is also an increased level of PLEKHA7 (Pleckstrin homology domain-containing family A member 7). PLEKHA 7 is a proline-histidine-rich nuclear protein that plays a key role in IGF-1’s anti-apoptotic effects (insulin-like growth factor-1)13. As IGF-1 induces PLEKHA 7 and it gets upregulated by insulin receptors in conditions with insulin resistance which is the main feature in PCOS. The high expression of PGK1 enhanced metabolic flux which gets regulated by a signalling pathway as mitogen-activated protein kinase 6 (MAP2K6) which leads to ovulation-related disorders. In a prior mouse study, animals with high PGK levels were given PTX medication and showed normal metabolism and ovulation, implying that the PGK1-AR genes could be a therapeutic target for PCOS treatment5. Along with this out study which finds out the novel genes and other pathways involved in the high level of PGK1 can help in PCOS treatment. PCOS has been a significant disorder affecting women of reproductive ages. Its effects can be seen as miscarriage, hirsutism which through the research is characterized by high levels of androgen, dysfunction in the ovary or multiple cysts on the ovary, and as our genes through RNA expression analysis suggest certain non-reproductive pathways involved such as insulin resistance, metabolic syndrome. Another reason for the ovulatory disorder can be a lack of dominant follicles. The impacts of PGK1 are majorly studied in cancer, specifically the metabolic pathway and post-translational modifications (PTMs). PGK1 synthesize metabolic product in the glycolysis cycle by converting 1,3-bisphosphoglycerate into 3-phosphoglycerate14. We’ve seen in this analysis that DHT-induced PGK1 levels show high expression as compared to the non PCOS DHT induced GC cells which suggest the repercussions of the PGK1-AR axis on PCOS disorder. It is also observed that high levels of PGK1 and AR affect MAPK signalling which in response regulates dysfunction in the ovary. As Granulosa cells play a vital part in the development of oocytes by providing nutrients15, High PGK1 inhibits molecule p38 that controls apoptosis in GC16. Thus, our study concludes on the most essential genes associated with high PGK1-AR levels and how certain pathways like insulin-related and tumour-apoptotic associated genes could help in the therapeutic target for PCOS.
Conclusion
Our finding indicates the significant genes associated with high-level pf PGK1 in GC of PCOS patients, which can help in therapeutical targets for PCOS patients. We found multiple genes and miRNA that are affected in Granulosa cells (GC) of PCOS patients. Our findings demonstrated the unknown aetiology of PCOS. Moreover, molecular interaction networks were linked to the differentially expressed genes and indicated several intracellular, binding genes associated while performing gene ontology (GO) enrichment analysis. The major overly expressed genes from cellular component Cytosol. The results indicated overexpression of associated genes with High levels of PGK1 in GC of PCOS patients which shows the novel meaningful insights in the aetiology of PCOS. The resulting data provides a reference to investigate specific genes involved in PCOS.
Acknowledgement
We would like to express our sincere gratitude to Dr. Ashok K. Chauhan, Founder President of Amity University Uttar Pradesh, for allowing us to undertake research. We would also like to express our gratitude to the Centre for Computational Biology and Bioinformatics, Amity Institute of Biotechnology, Amity University for providing the necessary resources required for this research.
Conflict of Interest
The Author(s) declare(s) that there is no conflict of interest to disclose.
Funding Sources
This research received no specific grant from any funding agency in the public, commercial, or not-for-profit sectors.
References
- Azziz R, Carmina E, Chen Z, et al. Polycystic ovary syndrome. Nat Rev Dis Primers. 2016;2:16057. Published 2016 Aug 11. doi:10.1038/nrdp.2016.57.
CrossRef - Gu HF, Mou M, Liang ZG, Sun C, Ren XY, Xiao YB. The association between paraoxonase 1 gene polymorphisms and polycystic ovarian syndrome. Cell Mol Biol (Noisy-le-grand). 2016;62(14):44-47. Published 2016 Dec 30.
CrossRef - Celik O, Aydin S, Celik N, et al. Molecular role of peptides/proteins in subfertility of polycystic ovarian syndrome. Cell Mol Biol (Noisy-le-grand). 2019;65(3):32-40. Published 2019 Mar 31.
CrossRef - Barthelmess EK, Naz RK. Polycystic ovary syndrome: current status and future perspective. Front Biosci (Elite Ed). 2014;6(1):104-119. Published 2014 Jan 1. doi:10.2741/e695.
CrossRef - Liu X, Sun C, Zou K, et al. Novel PGK1 determines SKP2-dependent AR stability and reprograms granular cell glucose metabolism facilitating ovulation dysfunction. EBioMedicine. 2020;61:103058. doi:10.1016/j.ebiom.2020.103058.
CrossRef - He Y, Luo Y, Zhang D, et al. PGK1-mediated cancer progression and drug resistance. Am J Cancer Res. 2019;9(11):2280-2302. Published 2019 Nov 1.
- Homburg R. What is polycystic ovarian syndrome? A proposal for a consensus on the definition and diagnosis of polycystic ovarian syndrome. Hum Reprod. 2002;17(10):2495-2499. doi:10.1093/humrep/17.10.2495.
CrossRef - Wang F, Pan J, Liu Y, et al. Alternative splicing of the androgen receptor in polycystic ovary syndrome. Proc Natl Acad Sci U S A. 2015;112(15):4743-4748. doi:10.1073/pnas.1418216112.
CrossRef - Dehm SM, Tindall DJ. Alternatively spliced androgen receptor variants. Endocr Relat Cancer. 2011;18(5):R183-R196. Published 2011 Sep 20. doi:10.1530/ERC-11-0141.
CrossRef - Azeez SH, Ismail IB, Darogha SN. The Effect of Interleukin-6 and Tumor Necrosis Factor-Alpha Gene Polymorphism and Hormone Replacement Therapy on Polycystic Ovary Syndrome. Cell Mol Biol (Noisy-le-grand). 2022;67(5):278-285. Published 2022 Feb 4. doi:10.14715/cmb/2021.67.5.38.
CrossRef - Rojas J, Chávez M, Olivar L, et al. Polycystic ovary syndrome, insulin resistance, and obesity: navigating the pathophysiologic labyrinth. Int J Reprod Med. 2014;2014:719050. doi:10.1155/2014/719050.
CrossRef - Stepto NK, Hiam D, Gibson-Helm M, et al. Exercise and insulin resistance in PCOS: muscle insulin signalling and fibrosis. Endocr Connect. 2020;9(4):346-359. doi:10.1530/EC-19-0551.
CrossRef - Pau CT, Mosbruger T, Saxena R, Welt CK. Phenotype and Tissue Expression as a Function of Genetic Risk in Polycystic Ovary Syndrome. PLoS One. 2017;12(1):e0168870. Published 2017 Jan 9. doi:10.1371/journal.pone.0168870.
CrossRef - Nie H, Ju H, Fan J, et al. O-GlcNAcylation of PGK1 coordinates glycolysis and TCA cycle to promote tumor growth. Nat Commun. 2020;11(1):36. Published 2020 Jan 7. doi:10.1038/s41467-019-13601-8.
CrossRef - Celik N, Aydin S, Ugur K, et al. Patatin-like phospholipase domain containing 3-gene (adiponutrin), preptin, kisspeptin and amylin regulates oocyte developmental capacity in PCOS. Cell Mol Biol (Noisy-le-grand). 2018;64(15):7-12. Published 2018 Dec 31.
CrossRef - Gills JJ, Castillo SS, Zhang C, et al. Phosphatidylinositol ether lipid analogues that inhibit AKT also independently activate the stress kinase, p38alpha, through MKK3/6-independent and -dependent mechanisms. J Biol Chem. 2007;282(37):27020-27029. doi:10.1074/jbc.M701108200.
CrossRef

