
Manuscript accepted on :26-05-2023
Published online on: 26-06-2023
Plagiarism Check: Yes
Reviewed by: Dr. Doaa Sayed Rashwan and Dr. Saumya Bipin
Second Review by: Dr. Audrey Jacob
Final Approval by: Dr. Patorn Promchai
Reem Al Mansoori1 , Marwan Ismail1 , Praveen Kumar Kandakurti2, Salma Mohamed1 , Ayman H. Alfeel1, Abdelgadir Alamin Altoum1, Aji Gopakumar 3 and Asaad Ma. Babker 1*
1Department of Medical Laboratory Sciences, College of Health Sciences, Gulf Medical University, Ajman, United Arab Emirates
2Dean College of Health Sciences, Gulf Medical University, Ajman, United Arab Emirates
3Statistical specialist, Research Section, Data and Statistics Department, Emirates Health Services (EHS), Healthcare Sector, Dubai, UAE.
Corresponding Author E-mail: azad.88@hotmail.com
DOI : https://dx.doi.org/10.13005/bpj/2692
Abstract
Objective: This study is designed to evaluate the relationship between the hematological parameter, vitamin D level along with HbA1C level in type 2 diabetic patients. Material and Methods: The current study is a cross-sectional study that included 150 patients with type 2 diabetes mellitus aged 20 to 79 years. Patients were given a questionnaire that included demographic information, family history, duration of diabetes, and the presence of associated complications. During data analysis, the Mann-Whitney U-test, correlation, and descriptive statistics were used. P-values less than 0.05 were considered statistically significant. Results: CBC parameters show low RBC, HCT, and Hgb count and increase in RDW value among T2DM individuals. WBCs and monocytes count were insignificant statistically (P= 0.925, P= 0.084), but showed a weak positive correlation which could be used as an inflammation marker. In addition, most of the T2DM were having vitamin D deficiency (<20 ng/mL) around 72.7% and occurs more in patients suffering from the diabetic disease for more than 5 years. Conclusions: This study highlights that T2DM patients could have one or more diabetes related complications at the time of diagnosis. Anemia was common among T2DM patients, especially patients with poorly controlled HbA1c because of diabetic nephropathy that affects the production of EPO. The study results demonstrated that vitamin D deficiency is common among T2DM patients. Therefore, it is recommended to screen and treat vitamin D deficiency for individuals whose diabetes risk is increased.
Keywords
Diabetes mellitus; glycated hemoglobin A1c; 25-hydroxyvitamin D; Haematological Parameters
Download this article as:| Copy the following to cite this article: Mansoori R. A, Ismail M, Kandakurti P. K. Gopakumar A, Babker A. M. Correlation of Haematological Parameters and Glycated Hemoglobin to Vitamin D level in Type II Diabetes Mellitus Patients Attend Thumbay hospital, Ajman, UAE. Biomed Pharmacol J 2023;16(2). |
| Copy the following to cite this URL: Mansoori R. A, Ismail M, Kandakurti P. K. Gopakumar A, Babker A. M. Correlation of Haematological Parameters and Glycated Hemoglobin to Vitamin D level in Type II Diabetes Mellitus Patients Attend Thumbay hospital, Ajman, UAE. Biomed Pharmacol J 2023;16(2). Available from: https://bit.ly/43Z8axh |
Introduction
Type 2 Diabetes mellitus (T2DM) is a multifactorial chronic disease and constitutes one of the 21st century’s major health challenges that demand urgent attention from shareholders in healthcare globally. Diabetes is a group of metabolic diseases characterized by hyperglycemia caused by defects in insulin secretion, insulin action, or both1. The main pathophysiological factors responsible for this disease are insulin resistance in peripheral tissues and progressive deterioration in beta cells can lead to impaired insulin secretion 2. Consistent hyperglycemia commonly increases risk of microvascular and macrovascular complications. Therefore, analysis of glycated hemoglobin A1c (HbA1c) is recommended for testing and monitoring diabetes type 2. HbA1C is a long‐term biomarker and reflects the glucose levels for the past two to three months 3.
Several studies have shown that haematological parameters such as erythrocytes, leukocytes, hemoglobin (Hgb), hematocrit (Hct), platelet (PLT), and other parameters could be valuable to evaluate and monitor the progression of degenerative complications in T2DM. WBC has been described as a biomarker of chronic inflammation which is associated with microvascular complications in T2DM. They could be actuated by advanced glycation end products, angiotensin II, oxidative stress convinced by hyperglycaemia 4. It was reported that the life span of erythrocytes or red blood cells (RBCs) in T2DM patients might decreased due to increased production of reactive oxygen species (ROS) and nonenzymatic glycosylation of Hgb and RBC membrane proteins can accelerate aging of RBCs 5. Moreover, anemia might be seen among T2DM patients suffering from nephropathy complications that lead to decreased production of erythropoietin (EPO) 6.
Another crucial and contributing factor that has been recently determined in increasing the risk of developing T2DM is vitamin D deficiency 7. Accumulating evidence shows that low plasma concentrations of 25-hydroxyvitamin D (25-OHD) has been implicated in decreased insulin secretion and increased insulin resistance through multiple mechanisms. vitamin D is a fat-soluble steroid hormone and regulator of insulin secretion, Ca2+ level, and survival of the pancreatic β-cells. It can affect glucose hemostasis either directly by binding to vitamin D receptors (VDR) and vitamin D-binding proteins (DBP) in pancreatic tissue or indirectly by promoting the entry of calcium into these cells to stimulate insulin secretion and increase insulin sensitivity 8. Many studies concluded that oral multivitamin supplements can improve the diabetic patient by minimizing the disease complications 9. However, the relationship between haematological profile and vitamin D remains unclear in patients with T2DM.
There was no similar study conducted in the study area to correlate the haematological parameters and glycated hemoglobin to vitamin D level in Type II Diabetes Mellitus Patients. Thus, the main aim of this study was to focus on evaluating the correlation between the hematological parameter and vitamin D level to HbA1C in type II Diabetes Mellitus patients.
Materials and Methods
This research presents analyses of cross-sectional study which performed among type 2 diabetes mellitus, aged between 20–79 years from Thumbay hospital and Thumbay Laboratory. The data collection was conducted between April and June 2022. Following all the rules of the Thumbay laboratory and approved by the Ethical committee of the Gulf Medical University,Ajman,UAE (Ref. no. IRB/COHS/STD/40/Dec-2021), all participants signed a consent form and agreed to be a part of this study. Moreover, A designed questionnaire that included demographic data, family history, duration of diabetes and presence of associated complications was given to the patients. We included all T2DM patients who attended Thumbay hospital and Thumbay Laboratory during the specified period as included in the study. Also, we excluded Patients who do not consent to participate in the study, pregnant women, children and any patients under treatment that can affect the vitamin D and hematological parameters.
Samples forComplete Blood Count (CBC) and HbA1c were collected in an ethylene diamine tetra acetic acid (EDTA) tube. For measuring 25‐hydroxyvitamin D levels, two ml of blood in a lithium heparin tube will be collected. CBC test will be carried out by Beckman Coulter (UniCel DxH- 800/900) automated hematology analyzer that has a five-part auto analyzer able to test 23 parameters per sample. While HbA1c and 25‐hydroxyvitamin D tests will be performed using Beckman Coulter DXC AU 700 analyzer and cobas 6000e/601 analyzer. The data analysed using Statistical Package for Social Science (SPSS) version 27. Mann–Whitney U-test, correlation, and descriptive statistics were used during data analysis. P-value <0.05 was considered as statistically significant.
Results
A total of 150 diabetic patients with HbA1c ³ 6.5 were included in this study. In total, 82 male (54.7%) and 68 females (45.3%), age between 20 and 79 years were included in the study. The majority 112 (74.7%) of study participants were above 50 years, 23 (16%) were between 41-50 years, 10 (6.7%) were between 31-40 years, and only 4 (2.7%) were between 20 – 30 years.
Table (1) also displays the frequencies and percentages of the participants who had diabetes according to family history status: 103 (68.7%) of the diabetic patients have a family history of the disease in a first-degree relative (parents and siblings), while 47 (31%) of the participants without a family history. The diabetes duration was categorized as less or more than 5 years. Among the participants there were 57 (38%) reported less than 5 years of diabetic duration and 93 (62%) from the same group have the disease for more than 5 years. About 60 (40%) of the diabetic patients have not developed any T2DM related complications, while 90 (60%) of them developed some of microvascular and macrovascular complications: 5 (4%) have had cardiovascular disease, 1 (0.7%) have had diabetic foot, 20 (13.3%) hypertension, 30 (20%) kidney disease, 1 (0.7%) neuropathy, and 31 (21.3%) with multiple complications.
The hematological profile of the participants in the current study is summarized in Table (2) that includes the mean, median, minimum, maximum, range and SD values. 72 out of 150 participants with HbA1c between 6.5 to 7.4 were considered as controlled cases by diabetic medication. Whereas 78 participants with HbA1c equal or more than 7.5 were classified as uncontrolled cases even with medication. The vitamin D Mean ±SD (Min – Max) for the controlled diabetic group is 15.70±12.46 (6.30 – 63.0), while it is 19.69 ±9.58 (5.40 – 49.80) for the uncontrolled groups. The P value of vitamin D is 0.007 which shows that there is a significant deficiency of vitamin D in both groups. The median and mean values for the RDW were high in both groups, the respective values were (median 15.15, mean 15.47). As shown in the below table (2), the P value of hematological parameters were not significantly different across the controlled and uncontrolled diabetic group. Furthermore, HB, HCT, WBC, and monocytes were all having weakly positive correlation Fig (5-8).
HbA1c of both groups was compared to the hematological profile. The prevalence of low Hb in the current study among T2DM patients is about 92 (61.33%) which is higher within uncontrolled T2DM patients 48 (52.2%). Low HCT levels were observed slightly more among T2DM patients compared to the patients with normal levels; 80 (53.3%) and 70 (46.7%), respectively. Moreover, RBC count has more abnormal value among both groups of T2DM participants 99 (66%). A high value of RDW among both groups 100 (66.6%). Regarding MCV and MCH levels, it was shown that there is no difference between both T2DM groups. Most of the MCHC, PLT and WBC results were within the normal level for the two groups: 107 (71.33), 128 (85.3%), and 115 (76.6%), respectively. However, around 109 (72.7%) of T2DM patients have vitamin D deficiency, 18 (12%) insufficient level, and only 23 (15.3%) have sufficient amount of the vitamin (Table 4).The test result variable(s): Age, Vitamin D, RBC, RDW, HB, HCT, MCV, MCH, MCHC, PLT, WBC, Neutro % , Lympho %, Mono % , Eosino% , Baso % has at least one tie between the positive actual state group and the negative actual state group (Figure 1)
According to the Thumbay hospital criteria, (25-hydroxyvitamin D) levels below 20 ng/mL were considered as deficient, while levels between 20 and 30 ng/mL were considered as insufficient, and levels more than 30 ng/mL were considered adequate vitamin D. Within the T2DM patients 109 (72.7%) were having vitamin D deficiency and occurs more in patients have the diabetic disease for more than 5 years, 18 (12%) were with insufficient level of vitamin D, and 23 (15.3%) of the patients having a sufficient level. Moreover, the level of vitamin D deficiency is high among both the controlled and uncontrolled diabetic groups (Figure 2 – 4).
ROC curve illustrated in figure (9) is to predict uncontrolled diabetes from the patients’ hematological parameters. AUC (gives degree or measure of separability, this measure saysmodel capability to distinguish between classes ‘normal as normal & abnormal as abnormal”. The higher the AUC, the better the model is at predicting normal classes as normal and abnormal classes as abnormal.All AUC<0.7, the model has the poor capability to predict/separate the controlled diabetic patients from the uncontrolled diabetes. Comparatively, vitamin D and monocytes have a better measure of separability, though the AUC are not statistically significant.
Table 1 : Participants’ demographic profile (n-150).
|
Participants’ demographic profile and professional characteristics (n-150) |
Frequency |
Percent |
|
|
Gender |
Female |
68 |
45.3 |
|
Male |
82 |
54.7 |
|
|
Age |
Age 20-30 years |
4 |
2.7 |
|
Age 31-40 years |
10 |
6.7 |
|
|
Age 41-50 years |
24 |
16.0 |
|
|
Age>50 years |
112 |
74.7 |
|
|
Diabetic Duration |
Less than 5 years |
57 |
38.0 |
|
More than 5 years |
93 |
62.0 |
|
|
Type II Diabetes Complications |
Yes |
90 |
60 |
|
No |
60 |
40 |
|
|
Type of Complications |
None |
60 |
40.0 |
|
Cardiovascular disease |
6 |
4.0 |
|
|
Diabetic foot |
1 |
0.7 |
|
|
Hypertension |
20 |
13.3 |
|
|
Kidney disease |
30 |
20.0 |
|
|
Neuropathy |
1 |
0.7 |
|
|
Multiple complications |
32 |
21.3 |
|
|
Family history of Type II Diabetes |
No |
47 |
31.3 |
|
Yes |
103 |
68.7 |
|
Table 2: Haematological parameters among both categories of T2DM.
|
HbA1c |
Vit D |
RBC |
RDW |
HB |
HCT |
MCV |
MCH |
MCHC |
PLT |
WBC |
|
|
Controlled with medication (6.5-7.4) |
Median |
15.70 |
4.64 |
15.15 |
11.65 |
37.00 |
83.00 |
26.90 |
32.00 |
239.0 |
7.95 |
|
Minimum |
6.30 |
2.60 |
3.50 |
7.10 |
22.00 |
62.70 |
19.50 |
28.30 |
53.00 |
2.50 |
|
|
Maximum |
63.00 |
13.70 |
30.10 |
16.80 |
50.40 |
103.00 |
32.90 |
34.50 |
542.0 |
19.20 |
|
|
Range |
56.70 |
11.10 |
26.60 |
9.70 |
28.40 |
40.30 |
13.40 |
6.20 |
489.0 |
16.70 |
|
|
Mean |
19.15 |
4.73 |
15.47 |
11.83 |
36.83 |
83.13 |
26.65 |
32.02 |
249.04 |
8.37 |
|
|
Std. Deviation |
12.46 |
1.71 |
3.29 |
2.50 |
6.93 |
8.46 |
3.21 |
1.36 |
93.15 |
3.41 |
|
|
N |
72 |
72 |
72 |
72 |
72 |
72 |
72 |
72 |
72 |
72 |
|
|
Uncontrolled with medication (>=7.5) |
Median |
17.80 |
4.70 |
14.50 |
11.90 |
36.40 |
83.65 |
27.00 |
32.40 |
227.0 |
7.65 |
|
Minimum |
5.40 |
2.40 |
11.90 |
7.00 |
21.10 |
61.00 |
18.00 |
22.60 |
35.00 |
3.00 |
|
|
Maximum |
49.80 |
6.80 |
32.5 |
16.70 |
49.80 |
98.00 |
32.60 |
35.50 |
457.0 |
17.10 |
|
|
Range |
44.40 |
4.40 |
313.10 |
9.70 |
28.70 |
37.00 |
14.60 |
12.90 |
422.0 |
14.10 |
|
|
Mean |
19.69 |
4.47 |
19.69 |
11.73 |
36.31 |
82.20 |
26.60 |
32.13 |
238.45 |
8.21 |
|
|
Std. Deviation |
9.58 |
1.00 |
35.18 |
2.52 |
7.33 |
8.53 |
3.33 |
1.84 |
87.83 |
2.73 |
|
|
N |
78 |
78 |
78 |
78 |
78 |
78 |
78 |
78 |
78 |
78 |
|
|
P value |
0.007 |
0.732 |
0.931 |
0.810 |
0.807 |
0.630 |
0.965 |
0.235 |
0.498 |
0.925 |
|
 |
Figure 1: Descriptive statistics of abnormal Hematological profile across 2 groups of T2DM |
 |
Figure 2: Vitamin D levels among T2DM participants (n-150). |
 |
Figure 3: Comparison of vitamin D deficiency and diabetic duration. |
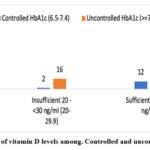 |
Figure 4: Comparison of vitamin D levels among. Controlled and uncontrolled HbA1c groups |
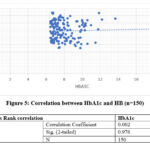 |
Figure 5: Correlation between HbA1c and HB (n=150). |
 |
Figure 6: Correlation between HbA1c and HCT (n=150). |
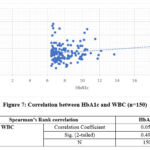 |
Figure 7: Correlation between HbA1c and WBC (n=150). |
 |
Figure 8: Correlation between HbA1c and Monocytes (n=150). |
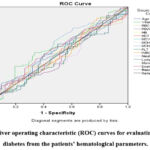 |
Figure 9: Receiver operating characteristic (ROC) curves for evaluating uncontrolled diabetes from the patients’ hematological parameters. |
Table 3: Receiver operating characteristic (ROC) Table for evaluating Age, VitaminD, RBC, RDW, HB, HCT, MCV, MCH, MCHC, PLT, WBC, Neutro % , Lympho %, Mono % , Eosino% , Baso among uncontrolled diabetes.
|
Test Result Variable(s) |
Area |
Std. Errora |
Asymptotic Sig.b |
Asymptotic 95% Confidence Interval |
|
|
Lower Bound |
Upper Bound |
||||
|
Age |
.537 |
.047 |
.435 |
.444 |
.629 |
|
Vitamin D |
.562 |
.047 |
.192 |
.469 |
.655 |
|
RBC |
.484 |
.047 |
.732 |
.391 |
.577 |
|
RDW |
.504 |
.048 |
.931 |
.410 |
.598 |
|
HB |
.489 |
.047 |
.810 |
.396 |
.581 |
|
HCT |
.488 |
.047 |
.807 |
.395 |
.581 |
|
MCV |
.477 |
.047 |
.630 |
.384 |
.570 |
|
MCH |
.498 |
.047 |
.965 |
.405 |
.591 |
|
MCHC |
.556 |
.048 |
.235 |
.463 |
.649 |
|
PLT |
.468 |
.047 |
.498 |
.375 |
.561 |
|
WBC |
.504 |
.048 |
.925 |
.411 |
.598 |
|
Neutro % |
.474 |
.048 |
.578 |
.380 |
.567 |
|
Lympho % |
.494 |
.048 |
.907 |
.401 |
.588 |
|
Mono % |
.582 |
.046 |
.084 |
.491 |
.673 |
|
Eosino% |
.528 |
.047 |
.550 |
.435 |
.621 |
|
Baso % |
.499 |
.047 |
.983 |
.406 |
.592 |
The test result variable(s): Age, VitaminD, RBC, RDW, HB, HCT, MCV, MCH, MCHC, PLT, WBC, Neutro % , Lympho %, Mono % , Eosino% , Baso % has at least one tie between the positive actual state group and the negative actual state group.
a. Under the nonparametric assumption
b. Null hypothesis: true area = 0.5
Discussion
Raising in blood sugar is a common effect of uncontrolled diabetes and over time leads to severe damage and affects many body systems especially the nerves, cardiovascular and blood vessels 10,11.In the current study, we evaluate the relationship between the hematological parameter, vitamin D level along with HbA1C level in type 2 diabetic patients. A total of 150 diabetic cases included 78 individuals who were poorly controlling HbA1c level with medications and 72 individuals who had controlled HbA1c results. The previously published studies have investigated and evaluated changes in hematological parameters to be used as prognosticators of diabetic related complications. However, CBC tests are not routinely determined as clinical biomarkers to monitor these complications. From the data obtained, the results revealed that most of the diabetic patients suffer from multiple complications, specifically renal disease. The finding of this study agreed with previous research by Khaled Alswa 12.
One risk factor for the development of diabetic nephropathy is inadequate glycaemic control. Various prospective studies have demonstrated that a decrease in the Hb and HCT levels is positively correlated with T2DM. In our study, a weakly positive correlation was demonstrated. However, the main reasons for this drop in the blood is not fully explored, but it was mentioned as the possible mechanism due to a reduction in RBC survival. Regarding RDW, we observed that RDW values were higher among patients. This result is in harmony with the findings of a previous study conducted by Farah Jabeen 13. High RDW can be an indicator for heterogeneity among circulating RBCs which is related to the degeneration of RBCs and impairment of EPO. RDW is considered one of the inflammatory markers as it has been shown to be associated with diabetic nephropathy and anemia. T2DM is known to cause oxidative stress and chronic inflammation that are known to reduce the lifespan of the RBCs, size variations, and reduction of RBC count. On the other hand, there was no significant difference of MCV, MCH, and MCHC values among both groups of diabetic individuals. However, previous research conducted by Suzana Tihić-Kapidžić shows a significant decrease among T2DM groups compared to non-diabetic group 14. Regarding WBC indices, measuring WBC is one of several inflammatory markers that is a routinely available test and easy to perform in any clinical laboratory. Leukocytes including neutrophilia, eosinophilia and lymphocytosis are associated with micro vascular complications in T2DM patients. WBC are activated by AGEs, oxidative stress, and cytokines in a hyperglycaemic state, which raise the state of inflammations 15. An evolution in WBC count among T2DM patients could be linked by a subclinical inflammation in the vessel wall due to arterial stiffness which reflects adverse structural and functional changes in the arterial walls and result in endothelial dysfunction. Another possible mechanism by which T2DM leads to an inflammatory state is disturbance in insulin signaling in the liver by inflammatory molecules such as IL-6, a proinflammatory effect on insulin, or insulin resistance 16.
The study by Jung Hee et., al reported that an increase of total and differential WBC counts was significantly related to higher risk of cardiovascular disease (CVD) 17. However, the study results indicated that levels of WBCs and differential leukocyte counts including neutrophils, lymphocytes, eosinophils, monocytes, and basophils were abnormal for about 23.3% only in T2DM patients. WBC counts, especially monocytes have a better measure of separability, though the AUC are not statistically significant. Monocytes differentiate into macrophages which develop an inflammatory state 18.
The current study showed that the means and standard deviation of vitamin D is lower among uncontrolled diabetic groups compared to the controlled group. Also, most of the T2DM were having vitamin D deficiency (<20 ng/mL) which is around 72.7%. This means, vitamin D deficiency is significantly high in T2DM patients and occurs more in patients who have the diabetic disease for more than 5 years. Our data are consistent with a study conducted by Salih et al that found a high prevalence of hypo-avitaminosis D among patients with type-2 diabetes, particularly among patients with poor glycaemic control and in those with longer diabetes durations 19.
Conclusion
This study highlights that T2DM patients could have one or more diabetes related complications at the time of diagnosis. Anemia was common among T2DM patients, especially patients with poorly controlled HbA1c because of diabetic nephropathy that affects the production of EPO. The study results demonstrated that vitamin D deficiency is common among T2DM patients. Therefore, it is recommended to screen and treat vitamin D deficiency for individuals with increased risk of developing diabetes.
Acknowledgment
We would like to thank all participants involved in the study and especially thanks to the Thumbay labs in Gulf Medical University, Ajman, UAE for their support and cooperation.
Conflict of interest
The authors declare that there is no conflict of interests.
References
- Abd Elgadir AA, Osman AL, Babker AM (2019) Impact of body mass index in malondialdehyde, antioxidant vitamins A, E, C and plasma zinc among type 2 diabetic patients. Kuwait Medical Journal 51(1): 16–20.
- Kharroubi, A.T. and Darwish, H.M. Diabetes mellitus: The epidemic of the century, World journal of diabetes. Baishideng Publishing Group Inc. 25 Jun 2015; 6(6): 850–867. doi: 10.4239/wjd.v6.i6.850.
CrossRef - Banday M.Z, Sameer A.S, Nissar S. Pathophysiology of diabetes: An overview. Avicenna Journal of Medicine. 2020 Oct 13;10(4): 178-188. DOI: 10.4103/ajm.ajm_53_20.
CrossRef - Alaboud, A.F, Tourkmani, A.M, Alharbi, T.J. Microvascular and macrovascular complications of type 2 diabetic mellitus in Central, Kingdom of Saudi Arabia. Saudi Medical Journal. 2016 Dec;37(12): 1408–1411. DOI: 10.15537/smj.2016.12.17062
CrossRef - Li, G. et al. Evaluation of ada hba1c criteria in the diagnosis of pre-diabetes and diabetes in a population of Chinese adolescents and young adults at high risk for diabetes: A cross-sectional study. 2018 Aug 8; 8(8): e020665. doi: 10.1136/bmjopen-2017-020665
CrossRef - AlDallal S, Jena N. Prevalence of Anemia in Type 2 Diabetic Patients. Journal Of Hematology. 2018 May; 7(2): 57-61. DOI: https://doi.org/10.14740/jh411w
CrossRef - Aljack HA, Abdalla MK, Idris OF, Ismail AM. Vitamin D deficiency increases risk of nephropathy and cardiovascular diseases in Type 2 diabetes mellitus patients. J Res Med Sci. 2019 May 22;24:47. doi: 10.4103/jrms.JRMS_303_18. PMID: 31160914; PMCID: PMC6540771.
CrossRef - Contreras-Bolívar V, García-Fontana B, García-Fontana C, Muñoz-Torres M. Mechanisms Involved in the Relationship between Vitamin D and Insulin Resistance: Impact on Clinical Practice. Nutrients. 2021 Oct 1;13(10):3491. doi: 10.3390/nu13103491. PMID: 34684492; PMCID: PMC8539968
CrossRef - Altoum AEA, Abbas MY, Osman AL, Ahmed S, Babker AM. The Influence of Oral Multivitamins Supplementation on Selected Oxidative Stress Parameters and Lipid Profiles among Sudanese Patients with Type-2 Diabetes. Open Access Maced J Med Sci. 2019 Feb 25;7(5):775-778. doi: 10.3889/oamjms.2019.137. PMID: 30962837; PMCID: PMC6447348.
CrossRef - Altoum AE, Osman AL, Babker AM. Comparative study of levels of selective oxidative stress markers (malondialdehyde, zinc, and antioxidant vitamins A, E, and C) in ischemic and non-ischemic heart disease patients suffering from type-2 diabetes. Asian J Pharm Clin Res. 2018;11(8):508-10.
CrossRef - Mohamed, Hatem, Anass M. Abbas, Mohammed Ayed Huneif, Seham M. Alqahtani, Awad Mohamed Ahmed, Asaad MA Babker, Ehab AM Elagab, and Parvez I. Haris. “Influence of Ramadan Fasting on Hemoglobin A1C, Lipid Profile, and Body Mass Index among Type 2 Diabetic Patients in Najran City, Saudi Arabia.” Open Access Macedonian Journal of Medical Sciences 9, no. B (2021): 318-325.
CrossRef - Alswat K. Type 2 diabetes control and complications and their relation to serum magnesium level. Arch Med Sci. 2021 Mar 18;18(2):307-313. doi: 10.5114/aoms/102443.
CrossRef - Farah Jabeen, Husan Afroz Rizvi, Farha Aziz, Afshan Zeeshan Wasti; Hyperglycemic induced variations in Hematological Indices in Type 2 Diabetics Int. J. of Adv. Res, 2013 Oct; 1(8): 322-334. ISSN 2320-5407
- Biadgo B, Melku M, Abebe SM, Abebe M. Hematological indices and their correlation with fasting blood glucose level and anthropometric measurements in type 2 diabetes mellitus patients in Gondar, Northwest Ethiopia. Diabetes Metab Syndr Obes. 2016 Mar 17; 9:91-9. doi: 10.2147/DMSO.S97563.
CrossRef - Tihić-Kapidžić S, Čaušević A, Fočo-Solak J, Malenica M, Dujić T, Hasanbegović S, Babić N, Begović E. Assessment of hematologic indices and their correlation to hemoglobin A1c among Bosnian children with type 1 diabetes mellitus and their healthy peers. J Med Biochem. 2021 Mar 12;40(2):181-192. doi: 10.5937/jomb0-25315. PMID: 33776568; PMCID: PMC7982283.
CrossRef - Oguntibeju OO. Type 2 diabetes mellitus, oxidative stress and inflammation: examining the links. Int J Physiol Pathophysiol Pharmacol. 2019 Jun 15;11(3):45-63. PMID: 31333808; PMCID: PMC6628012.
- Liu Y, Lai X, Guo W, Ma L, Li W, Fang Q, Yang H, Cai Y, Liu M, Zhang X, Yang L. Total White Blood Cell Count Mediated the Association Between Increased Arterial Stiffness and Risk of Type 2 Diabetes Mellitus in Chinese Adults. Arterioscler Thromb Vasc Biol. 2020 Apr;40(4):1009-1015.
CrossRef - Kim JH, Lim S, Park KS, Jang HC, Choi SH. Total and differential WBC counts are related with coronary artery atherosclerosis and increase the risk for cardiovascular disease in Koreans. PLoS One. 2017 Jul 28;12(7):e0180332. doi: 10.1371/journal.pone.0180332. PMID: 28753607; PMCID: PMC5533311.
CrossRef - Salih YA, Rasool MT, Ahmed IH, Mohammed AA. Impact of vitamin D level on glycemic control in diabetes mellitus type 2 in Duhok. Ann Med Surg (Lond). 2021 Mar 5;64:102208. doi: 10.1016/j.amsu.2021. 102208. PMID: 33786167; PMCID: PMC7988274.
CrossRef

