
Manuscript accepted on :25-11-2022
Published online on: 10-01-2023
Plagiarism Check: Yes
Reviewed by: Dr. Ahmed Salah
Second Review by: Dr.T Karthikeyan
Final Approval by: Dr. Eman Refaat Youness
M. Vimala1 and P. Ranjith Kumar2
Department of ECE, P.S.R Engineering College, Sivakasi, Tamil Nadu- 626 140, India.
Corresponding Author E-mail: vimala@psr.edu.in
DOI : https://dx.doi.org/10.13005/bpj/2612
Abstract
Classification and Prediction of brain tumors towards survival prediction has been well studied. There exist different schemes around the problem but struggle with poor performance in survival prediction and classification. To overcome the deficiency in classification, a real-time multi-fractal ensemble analysis CNN model (RMFEA-CNN) is presented in this article. The method not just considers basic low-level features like gray, texture, and binary features but also considers Coverage, Mass Index, and Intensity Fraction features. By preprocessing the image with the histogram equalization technique, the image quality has been increased. Further, the above-said features are extracted and trained by generating a multi-fractal ensemble towards various classes using a convolution neural network. The intermediate layers apply a support vector machine toward the classification of an ensemble. The neurons of the intermediate layer apply a support vector machine in estimating Ensemble Centric Coverage Support Measure (ECCSM), Ensemble Centric Mass Support Measure (ECMSM), and Ensemble centric Intensity Support Measure (ECISM) towards various classes. Disease Attraction Weight (DAW), which is measured by the support vector machine using a variety of support metrics, is computed using the estimated values by the method and produced at the output layer. The method carry out disease prediction and estimates survival stage support (SSS) measures to perform survival prediction, as determined by the DAW value. The proposed method improves disease prognostication performance and introduces a lower false ratio.
Keywords
Brain Tumor Classification; CNN; Medical Imaging; Survival Prediction; SVM; RMFEA-CNN
Download this article as:| Copy the following to cite this article: Vimala M, Kumar P. R. Real-time Multi Fractal Ensemble Analysis CNN Model for Optimizing Brain Tumor Classification and Survival Prediction Using SVM. Biomed Pharmacol J 2023;16(1). |
| Copy the following to cite this URL: Vimala M, Kumar P. R. Real-time Multi Fractal Ensemble Analysis CNN Model for Optimizing Brain Tumor Classification and Survival Prediction Using SVM. Biomed Pharmacol J 2023;16(1). Available from: https://bit.ly/3QI7tD3 |
Introduction
The most deadly disease currently being studied in medicine is a brain tumor, which affects human life to a different extent. Sometimes, the disease would claim the life of the person. However, diagnosing the presence of disease at the earlier stage would increase the span of life. The presence of a tumor in the brain has been diagnosed with the support of a brain image captured in form of an MRI (Multiple Resonance Image). The diagnosis is performed in several ways either with a medical practitioner or with a support system. The result of diagnosis by a medical practitioner has human errors which are not acceptable. So most medical solutions depend on decisive support systems. The decisive support systems are capable of producing accurate results in different medical problems.
Image processing algorithms are greatly used in several medical problems. Also, they have been used in different security problems like face recognition and fingerprint recognition. Similarly, image processing algorithms are used in different medical problems like tumor classification, mammogram classification, and so on. Brain tumors are classified using support vector machines (SVM), Genetic Algorithms, Principle Component Analysis (PCA), Neural Networks, K means clustering and other machine learning algorithms. However, the classification of brain tumors does not perform as expected. The existing approaches suffer to achieve higher classification accuracy with a higher false ratio.
Decisive support systems are designed for the support of medical practitioners in many situations. By enforcing decisive support systems with brain tumor classification, classification accuracy can be improved. The decisive systems take the brain image as input and extract features from it. According to the features extracted, the system would measure the similarity among various features extracted from different samples. According to the similarity measure, the class of image has been identified. There exist numerous decisive systems available to support brain image classification, however, the accuracy of the algorithm is greatly depending on the feature being used and the similarity measured. The problem of brain tumor classification is performed using various features like gray, texture, shape, and so on. However, the methods fail to perform better in classification.
The neurons could be designed to compute support values on various features toward various disease classes of brain tumors to make use of a Convolutional Neural Network and Support Vector Machine. By considering this, and handling the inaccuracy issues of existing schemes, a novel multi-fractal ensemble analysis CNN model (RMFEA-CNN) is presented in this section.
However, there are a number of methods for classifying the brain tumors. The CNN has the beauty of convolving the features of the brain images and supports the classification to be performed in a short period with higher accuracy. By adapting CNN with the model, the high dimensional data can be handled easily with less time and higher accuracy. Also, the method enforces classification with CNN and optimizes the classification problem with a support vector machine algorithm. The proposed RMFEA-CNN model is intended to generate multiple ensembles, with the method calculating the various ensemble support values for each. The method would calculate the attraction weight based on various ensemble support values. Based on the disease attraction weight, the classification would be performed.
The proposed model has been optimized with the genetic algorithm which generates various ensembles to which the CNN model would compute support values using the support vector machine algorithm. The disease attraction weight value is measured toward classification based on the support values. The detailed method is discussed in the following sections.
Related Works
The methods of brain tumor classification are described by various researchers in the literature. This section points out some of the most efficient approaches which are described in the recent trend.
In [1], the author performs a comparative analysis of various CNN transfer learning models in classifying brain images. In [2], an automatic tumor segmentation model that uses the local independent projection-based classification (LIPC) approach classifying the voxels into various classes is presented for classification of brain image. For effective classification, a regularized extreme learning machine (RELM)-based feature extraction scheme is presented in [3]. The method performs normalization with a min-max algorithm tumor classification approach. In order to effectively classify brain tumors, a multi-level feature extraction method is presented in [4] extracts features from a pre-trained Inception-v3 model and concatenate the features. In [5], a transfer learning-based method for classifying brain images is presented. This method uses Support Vector Machine (SVM), Softmax, and K-Nearest Neighbor (K-NN) to extract features and classify the images. A random forest and active contour model-based approach are presented in [6], which segments the images using the random forest to extract structural information where the active contour model is used towards classification. A data augmentation model with a pairwise Generative Adversarial Network (GAN) is presented in [7] that combines results from majority voting on slice-level glioma sub type classification. A deep learning model is presented for classification in [8], which uses CNN towards classifying meningioma, glioma, and pituitary tumors. The convolutional neural network structure based on complex networks (CNNBCN) is generated by randomly generated graph algorithms in [9]. A brain tumor diagnostic system is developed using well-known deep learning architectures in [10], which presents a transfer learning-based classification scheme.
Towards classifying brain tumors a cumulative variance method (CVM) is presented in [11], which uses the CVM in feature extraction to support the classification with KNN and other approaches. In [12], a hybrid machine learning strategy for classifying brain images makes use of shape, texture, and intensity features in clustering samples. For clustered sample classification, the random forest classifier is used. A multi-view dynamic fusion framework is presented in [13], the multi-view deep neural network architecture is used in integrating different segmentation results to improve performance. A representation-based radiomics (SRR) is presented in [14], which extracts the features using a dictionary-based approach and multi-feature collaborative sparse representation classification is used. A Bayesian CapsNet framework is presented in [15], which handles the uncertainty in classification. An automated segmentation model is presented in [16], for brain image classification, which uses a learning-based approach, and segmenting the tumor is what the Bat Algorithm with Fuzzy C-Ordered Means (BAFCOM) has recommended. In [17], an algorithm for segmentation of brain tumor with missing modalities is presented. In order to perform effective classification, the model of correlation converts all of the individual representations into the latent multi-source correlation representations.
A mutual information-accelerated singular value decomposition (MI-ASVD) model is presented in [18], which generates texture, color intensity, and a grey-level run-length matrix (GLRLM) for use in a neural network-based classification. A Gaussian Convolutional Neural Network (GCNN) based approach is presented in [19], which handles different grades of tumors. In [20], a Support Vector Machine-Based Fully Automatic Heterogeneous Segmentation (FAHS-SVM) has been proposed which uses structural, morphological, and relaxometry details in classification. Edge-enhanced dominant valley and discrete Tchebichef (EDV-DT) method for faster and more accurate image partitioning is proposed in [21]. Discrete Tchebichef moment feature extraction is used for segmented images to decrease the dimensionality of the segmented texture image. This helps to increase the rate of feature extraction in turn. Multi-Feature Frequency Similarity Multi-Layer Perceptron Neural Network (MFFS-MLPNN) is proposed in [22]. The iterative shearlet filter based on contrast curvature is used to preprocess the MRI brain image, and the image is enhanced using the histogram equalization method. The cross-multilinear local embedding technique is used to extract the tumor.
All of the methods previously mentioned suffer to improve cognitive performance in brain image classification.
Real-time Multi Fractal Ensemble Analysis CNN-Based Brain Tumor Classification with SVM
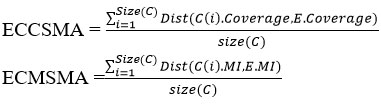
The proposed RMFEA-CNN model maintains the classified brain images. From the images, the method applies the histogram equalization technique which improves the quality of the image initially. With the preprocessed image, the method extracts different features like gray, texture, binary features, Coverage, Mass Index, and Intensity Fraction features. The method creates an ensemble and trains the convolution neural network using the extracted features after the features have been extracted. The CNN has four layers and the first layer is the input layer which takes the features extracted. The output layer returns different support values on various factors. At the test phase, the neurons at the intermediate layer neurons apply a support vector machine to compute the value of Ensemble Centric Coverage Support Measure (ECCSM), Ensemble Centric Mass Support Measure (ECMSM), and Ensemble centric Intensity Support Measure (ECISM) towards various classes. This has been iterated by generating different ensembles on the feature vector given. For each of them, the method would compute the above-mentioned ECCSM, ECMSM, and ECISM values. Based on these values the method evaluate DAW value to perform classification. Similarly, for survival prediction, the method evaluate the Survival Stage Support value based on the values of Ensemble Centric Coverage Support Measure (ECCSM) and Ensemble Centric Mass Support Measure (ECMSM) (SSS). The method performs survival prediction and classifies the survival class on the basis of the SSS value. This section details the approach and functionalities in detail.
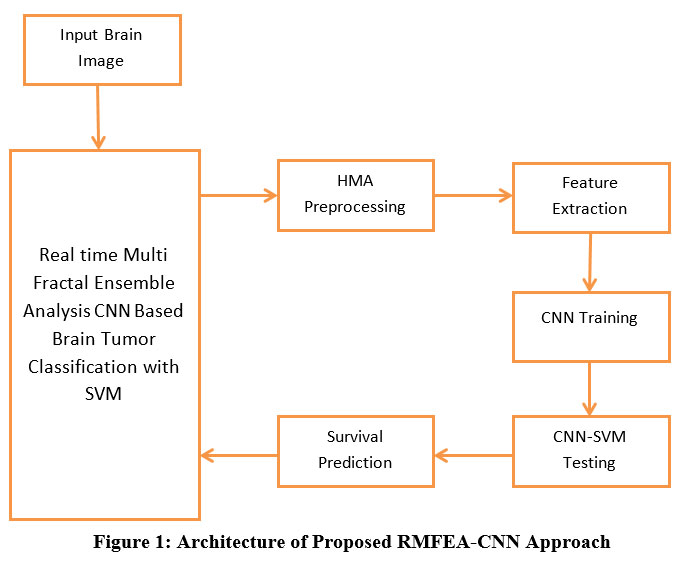 |
Figure 1: Architecture of Proposed RMFEA-CNN Approach |
The proposed RMFEA-CNN-based architecture brain image classification with a genetic algorithm has been presented in Figure 1, where each functional stage has been discussed in detail in this section.
HMA (Histogram Mean Approximation) Preprocessing
The input brain image given would contain several noisy features. It is necessary to eliminate such noisy features to support the effective classification of images. To handle this, a gray-level histogram approximation technique is used. The method first generates the gray histogram at the window level. The method splits the image into several blocks, and for each block, a histogram has been generated. According to the gray histogram, the method optimizes the minimum gray value with the least number of pixels. Based on the selected least appearance pixel, the method identifies the noisy pixels and adjusts the pixel with the mean average value measured with the two-hop neighbor gray value. The preprocessed image was used for the classification of the brain image.
Algorithm:
Given: Brain Image B
Obtain: Preprocessed image Pri.
Start
Read B.
For each window image wi

Compute two hop mean Thm = Mean( Σ twohopneighbors(wi(k)==lhs))
Adjust the noisy pixel.
For each noisy pixel p
Wi(p) = Thm
End
End
Pri = B.
Stop
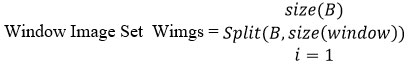
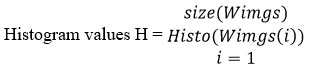
The preprocessing algorithm generates the window images and for each of them, it generates the gray histogram. According to the histogram value, a set of noisy pixels are identified and each has been adjusted by computing the mean histogram value. The preprocessed image has been used to perform brain image classification.
 |
Figure 2: Input Image |
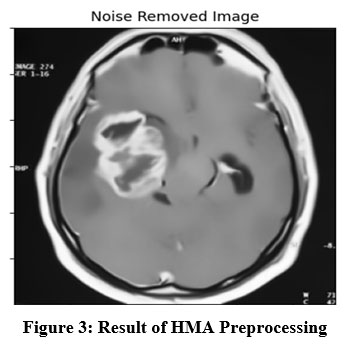 |
Figure 3: Result of HMA Preprocessing |
The original image given for the analysis is given in Figure 2, which has been applied with the HMA algorithm towards quality enhancement. The result of HMA preprocessing is presented in Figure 3, which removes the noise and enhances the quality of the image according to the histogram mean approximation scheme.
Feature Extraction
The preprocessed image has been used in extracting features like gray, texture, and binary to measure Coverage, Mass Index, and Intensity Fraction features. To extract the features first, the method generates the grayscale image and extracts gray, and texture, and extracts binary features by generating the binary image. Using the texture feature extracted, the method measures the coverage value as follows:
![]()
Where T is the texture extracted and Image is the input image.
Similarly, the method extracts the mass index value according to the grayscale value. It has been measured as follows:

Finally, the intensity fraction is measured according to the grayscale values of the image pixel. It represents the closeness of the image to a specific class of image. It has been measured as follows:
![]()
Such features extracted are converted into a multi-fractal ensemble to support the classification.
CNN-SVM Training
The extracted features are used to train the convolution neural network in the proposed method.. The amount of neurons generated at the layer of input is proportional to the amount of samples in the data set. The computed measures and extracted features have been used to initialize each neuron. At the convolution layer, the neurons convert or reduce the size of features into reduced dimensions. The binary pattern generated has been reduced to a small size and the texture feature has been convolved to a minimum dimension. The convolved features are assigned to different classes of brain tumors like malignant and benign.
CNN-GA Testing
Preprocessing has been applied to the input test image during the testing phase, and features like gray and texture are extracted. The method measures the coverage feature, mass index feature, and intensity fraction feature in addition to the gray and texture features before generating the local binary pattern LBP. Such features extracted are converted into an ensemble and tested with the network trained. With the ensemble generated, the method generates several possible ensembles according to the range values of coverage, mass index, and intensity factor to different values of tolerance in the range of +-10. Such combinatory samples are tested with the CNN where the intermediate layer convolves the LBP generated to the least dimension and in the RELU layer, the neuron uses a support vector machine algorithm in estimating Ensemble Centric Coverage Support Measure (ECCSM), Ensemble Centric Mass Support Measure (ECMSM) and Ensemble Centric Intensity Support Measure (ECISM) towards various classes. The output layer returns a set of values of ECCSM, ECMSM, and ECISM according to the number of mutations generated. With the set of values obtained, for each class, the method calculate the value of disease attraction weight. Based on the disease attraction weight, the class of brain image is identified by the method.
Algorithm
Given: CNN, Brain Image Bmg
Obtain: Class C
Start
Read CNN and Bmg.
Pimg = Preprocessing (Bmg)
Ensemble[LBP,CF,MI,IF] = Feature_Extraction (Pimg)
For each possible value of {CF,MI,IF}

Add to Ensemble Set Es = (Σ Ensembles∈ Es) U E
End
For each ensemble E
Apply SVM in Estimating ECCSM, ECMSM, ECISM.

End
For each class C

End
Class C = Choose the class and grade with maximum DAW.
Perform survival prediction according to the grade identified.
Stop
The above classification algorithm reads the input brain image and extracts the features concerned. With the features extracted the method test with the CNN by generating a combination of ensembles according to the range values of various features constructed with an ensemble, and optimizes the classification by computing the disease attraction weight. Based on the DAW value, a class with a higher DAW is identified as the target class. The method performs survival prediction according to the grade of the tumor class identified.
Survival Prediction
Survival prediction is the process of predicting the survival rate of the patient according to the measures returned by the proposed model for the given brain image. Accordingly, values obtained in the output layer of CNN at the test phase have been used in predicting the survival rate of the patient considered. The method obtains the values of Ensemble Centric Coverage Support Measure (ECCSM) and Ensemble Centric Mass Support Measure (ECMSM). The value of ECCSM represents how far the tumor is grown and ECMSM represents how badly the tumor has occupied the cells of the brain. Using these two values, the method computes the value of Survival Stage Support (SSS) towards each stage maintained. As the model maintains different survival classes, the method extracts the relevant features from each sample in the trained class of survival. With each feature extracted belonging to a specific survival class, the method computes the value of SSS. Based on the value of SSS, Survival Class of individual is identified, using the value of SSS.
Algorithm:
Given: Survival Class Set Scs, ECCSM, ECMSM, Brain Image Bmg
Obtain: Survival Class SC
Start
Read Scs, ECCSM, ECMSM, Bmg
Pimg = Preprocessing (Bmg)
Ensemble[LBP,CF,MI,IF] = Feature_Extraction (Pimg)
For each class s
For each ensemble E
End
Compute cumulative ensemble similarity CES.
![]()
Compute SSS = Dist((ECCSM×ECMSM),CES)
End
Class C = Choose the survival class with maximum SSS.
Stop
The survival prediction algorithm estimates SSS values towards various survival classes and based on the approach selects a class with the maximum SSS value as the result.
Results and Discussion
The proposed real-time CNN-based real-fractal ensemble analysis brain image classification algorithm with SVM has been implemented and its performance has been evaluated using the BRATS 18 data set. Obtained results are compared with the results of other approaches. A detailed analysis is given in this section.
Table 1: Details of Evaluation
|
Constraint |
Value |
| Tool Used | Python |
| Data set | Brats 2018 |
| Number of Classes | 2 |
| Number of Instances | 10000 |
Table 1 displays the constraints taken into account for the performance evaluation, which has been used to analyze the performance under various parameters. The results obtained are presented in this section.
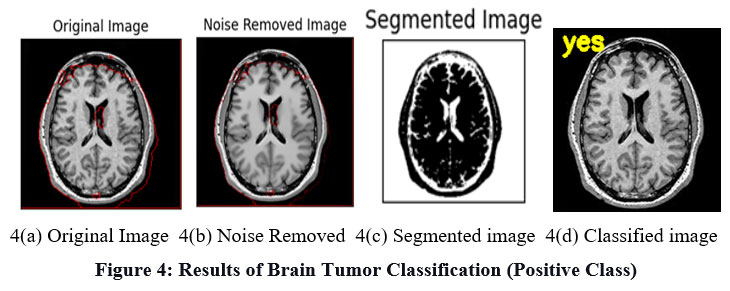 |
Figure 4: Results of Brain Tumor Classification (Positive Class). |
The result of preprocessing, segmentation, and classification produced by the proposed approach as shown in Figure 4. Figure 4(a) shows the input image submitted and 4(b) shows the noise-removed image produced by HMA preprocessing. Similarly, Figure 4(c) shows the segmentation result and the classification result is shown in Figure 4(d).
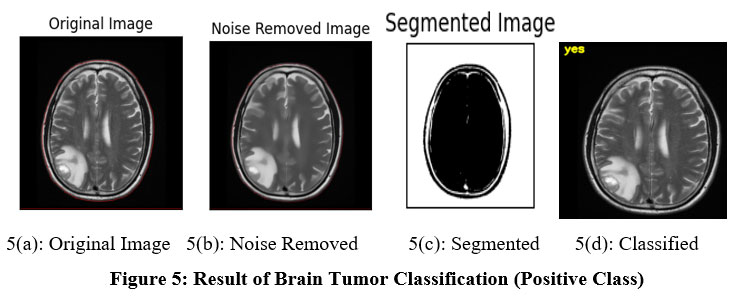 |
Figure 5: Result of Brain Tumor Classification (Positive Class). |
Figure 5 shows the result of preprocessing, segmentation, and classification produced by the proposed approach. Figure 5(a) shows the input image submitted and 5(b) shows the noise-removed image produced by HMA preprocessing. Similarly, Figure 5(c) shows the segmentation result and the classification result is shown in Figure 5(d).
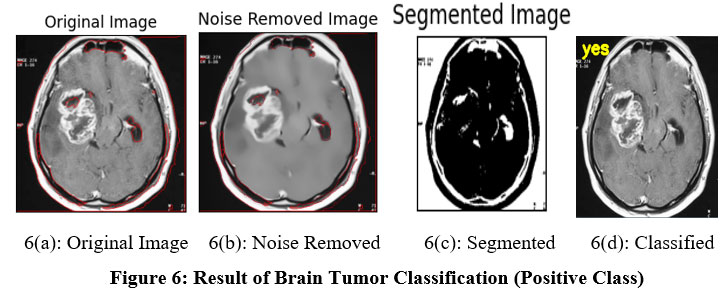 |
Figure 6: Result of Brain Tumor Classification (Positive Class) |
Figure 6 shows the result of preprocessing, segmentation, and classification produced by the proposed approach. Figure 6(a) shows the input image submitted and 6(b) shows the noise-removed image produced by HMA preprocessing. Similarly, Figure 6(c) shows the segmentation result and the classification result is shown in Figure 6(d).
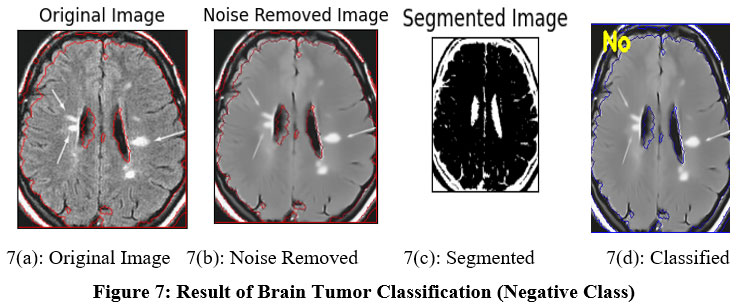 |
Figure 7: Result of Brain Tumor Classification (Negative Class). |
Figure 7 shows the result of preprocessing, segmentation, and classification produced by the proposed approach. Figure 7(a) shows the input image submitted and 7(b) shows the noise-removed image produced by HMA preprocessing. Similarly, Figure 7(c) shows the segmentation result and the classification result is shown in Figure 7(d).
 |
Figure 8: Result of Brain Tumor Classification (Negative Class). |
Figure 8 shows the result of preprocessing, segmentation, and classification produced by the proposed approach. Figure 8(a) shows the input image submitted and 8(b) shows the noise-removed image produced by HMA preprocessing. Similarly, Figure 8(c) shows the segmentation result and the classification result is shown in Figure 8(d).
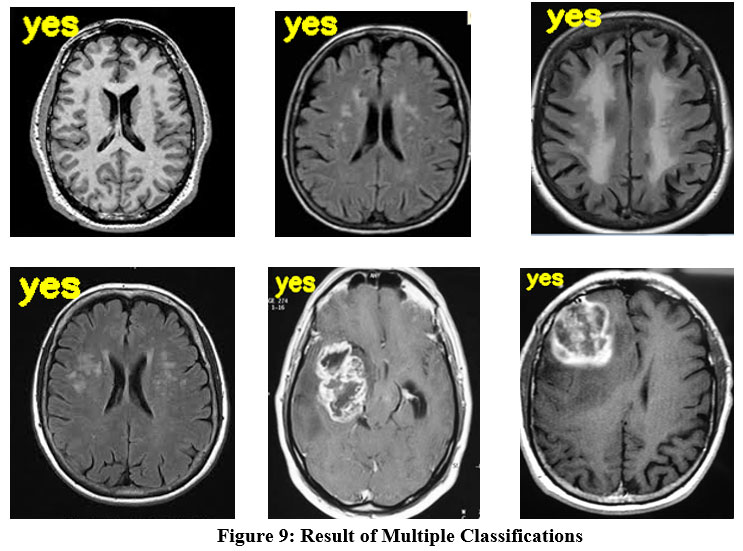 |
Figure 9: Result of Multiple Classifications |
The results produced by the proposed approach to classification have been presented in Figure 9. Each test sample has been classified and the result of classification is marked at the left corner of the image given.
Table 2: Analysis of Classification Accuracy
| Classification Accuracy in % vs No. of Samples | |||
| 3000 samples | 5000 samples | 10000 samples | |
| REPC | 73 | 77 | 81 |
| LINM | 76 | 79 | 85 |
| CNNBCN | 79 | 83 | 88 |
| RMFEA-CNN | 84 | 89 | 98 |
Table 2 shows how different approaches perform in terms of classification accuracy. In all of the test cases, the proposed RMFEA-CNN method achieved higher classification accuracy.
 |
Figure 10: Performance in Classification Accuracy. |
The performance of different methods of classifying brain images has been measured with the presence of a different number of samples. Obtained results are compared in Figure 10, which denotes the proposed RMFEA-CNN has produced higher accuracy than other approaches.
Table 3: Analysis of False Classification Ratio
| False Ratio in Classification % vs No of Samples | |||
| 3000 samples | 5000 samples | 10000 samples | |
| REPC | 27 | 23 | 19 |
| LINM | 24 | 21 | 15 |
| CNNBCN | 21 | 17 | 12 |
| RMFEA-CNN | 16 | 11 | 2 |
Table 3 displays the measured and calculated false ratio used in brain image classification. When compared to other approaches, the proposed RMFEA-CNN method has produced a lower false ratio.
 |
Figure 11: Performance on False Classification Ratio |
For various method, the false classification ratio is measured by the amount of samples in the dataset. The proposed RMFEA-CNN has produced a lower false ratio than other methods in figure 11.
Table 4: Time Complexity Analysis
| Time Complexity in Classification Seconds vs No of Samples | |||
| 3000 samples | 5000 samples | 10000 samples | |
| REPC | 53 | 62 | 89 |
| LINM | 44 | 53 | 78 |
| CNNBCN | 41 | 47 | 72 |
| RMFEA-CNN | 21 | 28 | 33 |
Table 4 measures and displays the time complexity value introduced by various methods. When compared to other approaches, the proposed RMFEA-CNN has produced lower time complexity.
 |
Figure 12: Performance on Time complexity |
In Figure 12, the value of time complexity is measured , where the proposed RMFEA-CNN has produced less time complexity than other approaches.
Table 5: Analysis of Survival Prediction Accuracy
| Survival Prediction Accuracy in % vs No of Samples | |||
| 3000 samples | 5000 samples | 10000 samples | |
| REPC | 74 | 78 | 82 |
| LINM | 77 | 80 | 84 |
| CNNBCN | 79 | 83 | 88 |
| RMFEA-CNN | 86 | 90 | 97 |
Table 5 shows how methods perform in terms of survival prediction accuracy. In all of the test cases, the proposed RMFEA-CNN method produced higher survival prediction accuracy.
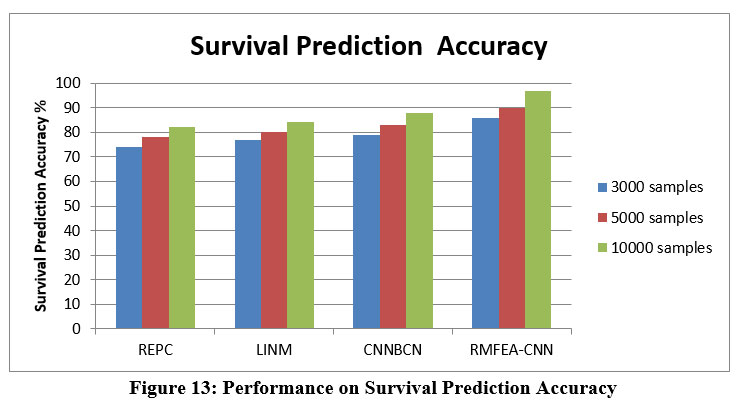 |
Figure 13: Performance on Survival Prediction Accuracy |
The performance of different methods of survival prediction has been measured with the presence of a different number of samples. Obtained results are compared in Figure 13, which denotes the proposed RMFEA-CNN has produced higher accuracy than other approaches.
Conclusion
This article presented a novel real-time multi-fractal ensemble analysis CNN model for classification of brain image with SVM. The proposed method preprocesses the image by applying a histogram mean approximation scheme which removes the noise and extracts gray, binary, and texture features to compute the coverage, mass index, and intensity factors. At the test phase, the method extracts the features and tests them using the CNN-trained features that were extracted. The intermediate layer performs convolution to reduce the feature size and estimates different support measures on coverage, mass index, and intensity factor. Using the support measures, the method evaluate the DAW value to perform classification. Here support vector machine algorithm is used in optimizing the classification problem which estimates support measures for different features towards the various classes of brain tumors according to tolerance. The method performs survival prediction by computing SSS (Survival Stage Support) values toward various classes of survival grades. Based on the value of SSS, a specific class is identified. The proposed approach improves the performance of classification by up to 98% and reduces the time complexity by up to 21 seconds. In future this method can be implemented for Satellite Image classification.
Conflicts of Interest
There is no conflicts of interest.
Funding Sources
The authors received no specific funding for this work.
Reference
- Arora and M. Sharma. Deep Learning for Brain Tumor Classification from MRI Images. Sixth International Conference on Image Information Processing (ICIIP), 2021; 409-412. doi: 10.1109/ICIIP53038.2021.9702609.
CrossRef - Huang, W. Yang, Y. Wu, J. Jiang, W. Chen and Q. Feng. Brain Tumor Segmentation Based on Local Independent Projection-Based Classification. IEEE Transactions on Biomedical Engineering. 2014: 61-10, 2633-2645. doi: 10.1109/TBME.2014.2325410.
CrossRef - A Gumaei, M. M. Hassan, M. R. Hassan, A. Alelaiwi and G. Fortino A. Hybrid Feature Extraction Method With Regularized Extreme Learning Machine for Brain Tumor Classification. IEEE Access. 2019 : 7, 36266-36273. doi: 10.1109/ACCESS.2019.2904145.
CrossRef - Noreen, S. Palaniappan, A. Qayyum, I. Ahmad, M. Imran and M. Shoaib A. Deep Learning Model Based on Concatenation Approach for the Diagnosis of Brain Tumor. IEEE Access. 2020: 8, 55135-55144. doi: 10.1109/ACCESS.2020.2978629.
CrossRef - A Sekhar, S. Biswas, R. Hazra, A. K. Sunaniya, A. Mukherjee and L. Yang. Brain Tumor Classification Using Fine-Tuned GoogLeNet Features and Machine Learning Algorithms: IoMT Enabled CAD System. IEEE Journal of Biomedical and Health Informatics. 2022: 26 – 3, 983-991. doi: 10.1109/JBHI.2021.3100758.
CrossRef - A Ma, G. Luo and K. Wang. Concatenated and Connected Random Forests With Multiscale Patch Driven Active Contour Model for Automated Brain Tumor Segmentation of MR Images. IEEE Transactions on Medical Imaging. 2018: 37- 8, 1943-1954. doi: 10.1109/TMI.2018.2805821.
CrossRef - A Ge, I. Y. -H. Gu, A. S. Jakola and J. Yang. Enlarged Training Dataset by Pairwise GANs for Molecular-Based Brain Tumor Classification. IEEE Access. 2020: 8, 22560-22570. doi: 10.1109/ACCESS. 2020. 2969805.
CrossRef - H. Sultan, N. M. Salem and W. Al-Atabany. Multi-Classification of Brain Tumor Images Using Deep Neural Network. IEEE Access. 2019: 7, 69215-69225. doi: 10.1109/ACCESS.2019.2919122.
CrossRef - Huang and xiaohao du. Convolutional Neural Network Based on Complex Networks for Brain Tumor Image Classification With a Modified Activation Function. IEEE Access. 2020: 8, 89281-89290. doi: 10.1109/ACCESS.2020.2993618.
CrossRef - Asif, W. Yi, Q. U. Ain, J. Hou, T. Yi and J. Si. Improving Effectiveness of Different Deep Transfer Learning-Based Models for Detecting Brain Tumors From MR Images. IEEE Access. 2022: 10, 34716-34730 doi: 10.1109/ACCESS.2022.3153306.
CrossRef - A Vidyarthi, R. Agarwal, D. Gupta, R. Sharma, D. Draheim and P. Tiwari. Machine Learning Assisted Methodology for Multiclass Classification of Malignant Brain Tumors. IEEE Access. 2022: 10, 50624-50640, doi: 10.1109/ACCESS.2022.3172303.
CrossRef - A Deepa, M. Murugappan, M. G. Sumithra, M. Mahmud and M. S. Al-Rakhami. Pattern Descriptors Orientation and MAP Firefly Algorithm Based Brain Pathology Classification Using Hybridized Machine Learning Algorithm. IEEE Access. 2021: 10, 3848-3863. doi: 10.1109/ACCESS.2021.3100549.
CrossRef - Ding, Wei Zheng, Ji Geng, Zhen Qin, Kim-Kwang Raymond Choo, Zhiguang Qin, Xiaolin Hou. MVFusFra: A Multi-View Dynamic Fusion Framework for Multimodal Brain Tumor Segmentation. IEEE Journal of Biomedical and Health Informatics, 2021: 26, 4, 1570-1581. doi: 10.1109/JBHI.2021.3122328.
CrossRef - Wu et al., Sparse Representation-Based Radiomics for the Diagnosis of Brain Tumors, IEEE Transactions on Medical Imaging. 2018: 37, 4, 893-905. doi: 10.1109/TMI.2017.2776967.
CrossRef - Afshar, A. Mohammadi and K. N. Plataniotis. BayesCap: A Bayesian Approach to Brain Tumor Classification Using Capsule Networks. IEEE Signal Processing Letters. 2020: 27, 2024-2028. doi: 10.1109/LSP.2020.3034858.
CrossRef - A M. Alhassan and W. M. N. W. Zainon. BAT Algorithm With fuzzy C-Ordered Means (BAFCOM) Clustering Segmentation and Enhanced Capsule Networks (ECN) for Brain Cancer MRI Images Classification. IEEE Access, 2020: 8, 201741-201751, doi: 10.1109/ACCESS.2020.3035803.
CrossRef - Zhou, S. Canu, P. Vera and S. Ruan. Latent Correlation Representation Learning for Brain Tumor Segmentation With Missing MRI Modalities. IEEE Transactions on Image Processing. 2021; 4263-4274. doi: 10.1109/TIP.2021.3070752.
CrossRef - A. Al-Saffar and T. Yildirim. A Novel Approach to Improving Brain Image Classification Using Mutual Information-Accelerated Singular Value Decomposition. IEEE Access. 2020: 8, 52575-52587. doi: 10.1109/ACCESS.2020.2980728.
CrossRef - Rizwan, A. Shabbir, A. R. Javed, M. Shabbir, T. Baker and D. Al-Jumeily Obe, Brain Tumor and Glioma Grade Classification Using Gaussian Convolutional Neural Network. IEEE Access. 2022: 10, 29731-29740. doi: 10.1109/ACCESS.2022.3153108.
CrossRef - Jia and D. Chen. Brain Tumor Identification and Classification of MRI images using deep learning techniques. IEEE Access. 2020. doi: 10.1109/ACCESS.2020.3016319.
CrossRef - Ramalakshmi K, Srinivasa Raghavan V. Soft computing-based edge-enhanced dominant peak and discrete Tchebichef extraction for image segmentation and classification using DCML-IC. Soft Comput. 2021 25, 2635–2646. doi: 10.1007/s00500-020-05306-8.
CrossRef - Vimala, P.Ranjith Kumar, Novel Brain Tumor Classi¯cation Model with MLPNN Using UNET, Journal of Circuits, Systems, and Computers, 13, 14, 2022: 2250425. doi: 10.1142/S0218126622502450
CrossRef

