
Manuscript accepted on :03-02-2023
Published online on: 20-02-2023
Plagiarism Check: Yes
Reviewed by: Dr. Randa Salah Gomez
Second Review by: Dr. Sudhanshu Kumar Bharti
Final Approval by: Dr. Eman Refaat Youness
Syamihah Mardhiah A-Razak¹,²* , Fathimah Mohamad ², Rosemawati Arifin ³, Arjoanna Farra Azizi ², Chen Xin Wee ² and Nadzimah Mohd Nasir ²
1Department of Pathology (Chemical pathology), Faculty of Medicine, Universiti Sultan Zainal Abidin (UniSZA), Medical Campus, 20400 Jalan Sultan Mahmud, Kuala Terengganu, Terengganu, Malaysia.
2Faculty of Medicine Universiti Teknologi MARA, Sungai Buloh Campus, 47000 Sungai Buloh, Selangor, Malaysia
3Department of Pathology, Hospital Sultanah Nur Zahirah, 20400 Kuala Terengganu, Terengganu, Malaysia
Corresponding Author E-mail: imahmohd80@gmail.com
DOI : https://dx.doi.org/10.13005/bpj/2632
Abstract
Objective: The Malaysian Ministry of Health Clinical Practice Guideline 2018 recommends the clinical use of the CKD-EPI equation instead of the MDRD equations. This study aims to examine mean eGFR and prevalence of chronic kidney disease (CKD) using both equations based on different age groups and to ascertain inter-rater agreement between both equations, particularly in the elderly in a tertiary hospital in Terengganu, Malaysia. Method: Serum creatinine results were extracted from the lab information system (LIS) for a 1-year duration in a patient more than and equal to 18 years old (≥18 years old). The first creatinine results from 69,329 people were used to estimate GFR using both equations. The mean eGFR, prevalence of the CKD and agreement between those two equations were compared. Result: In comparison with the MDRD equation, CKD-EPI revealed lower mean eGFR (82.63 vs 85.42 mL/min/1.73m², p<0.001) and reduce in the prevalence of the chronic kidney disease (CKD) (25.7% vs 28.4%). When subdivided by age, the prevalence of CKD reduced in the age group 18-79 years but increased in the elderly age >80 years. The numerical agreement of eGFR was excellent (ICC = 0.883), and the categorical agreement of CKD was almost perfect in all age groups. (ƙ= 0.932). Conclusion: CKD-EPI equation reduces the prevalence of CKD in young people and increases prevalence in the elderly (>80 years old). However, the CKD-EPI equation is an appropriate alternative to the MDRD equation for all age groups, including the elderly. Further validation studies involving a large multiethnic and adequate elderly population in Malaysia are much needed.
Keywords
CKD-EPI; eGFR; Kidney function test; MDRD
Download this article as:| Copy the following to cite this article: A-Razak S. M, Mohamad F, Arifin R, Azizi A. F, Wee C. X, Nasir N. M. Glomerular Filtration Rate: Comparison of Chronic Kidney Disease Epidemiology Collaboration (CKD-EPI) and Modification of Diet in Renal Disease (MDRD) Equations with the Effect of Age in a Tertiary Hospital in Terengganu, Malaysia. Biomed Pharmacol J 2023;16(1) |
| Copy the following to cite this URL: A-Razak S. M, Mohamad F, Arifin R, Azizi A. F, Wee C. X, Nasir N. M. Glomerular Filtration Rate: Comparison of Chronic Kidney Disease Epidemiology Collaboration (CKD-EPI) and Modification of Diet in Renal Disease (MDRD) Equations with the Effect of Age in a Tertiary Hospital in Terengganu, Malaysia. Biomed Pharmacol J 2023;16(1) Available from: https://bit.ly/3Z5RHoc |
Introduction
A common test for diagnosing chronic kidney disease (CKD) is the glomerular filtration rate (GFR). For the assessment of kidney function, measured GFR using exogenous filtration markers such as inulin, iothalamate, iohexol, and 51Cr-EDTA is still regarded as the gold standard. However, due to the procedure’s intricacy, it is difficult to be performed in routine practice. It is known to be associated with toxicity and adverse reaction issues which limit its utilization. Alternately, it is also preferred to use endogenous filtration markers such as creatinine and cystatin C, albeit these do not accurately represent the genuine GFR due to their characteristics1.
To calculate creatinine clearance, the Cockcroft-Gault equation was developed in 1976. It has been noted that this equation developed using a non-standardized creatinine test and overestimates the true GFR, especially in older populations2. The Modification of Diet in Renal Disease (MDRD) research equation was created in response to this restriction. Patients with impaired kidney function who were Caucasian and African American made up the population used in the development of this equation3. Even though it provided greater accuracy, it displayed imprecision and understated predicted GFR at levels greater than 60 mL/min/1.73 m², which overestimated the prevalence of CKD4. Aware of this pitfall, the researcher has developed the Chronic Kidney Disease Epidemiology Collaboration (CKD-EPI) equation, which involved a larger Caucasian and African American population of both with and without kidney disease. CKD-EPI offers superior accuracy than the popular MDRD equations, especially at eGFR >60 mL/min/1.73m², according to numerous validation experiments5.
The 2018 Clinical Practice Guideline by the Malaysia Ministry of Health Malaysia also recommends the clinical application of the CKD-EPI equation in daily practice6. As the Asian population was not sufficiently represented in either equation, it is unknown whether the CKD- EPI equation can be applied to the Malaysian population or used to populations of different ages. Currently, there is a paucity of evidence evaluating how effectively the CKD-EPI equation performs in diagnosing CKD in Malaysian populations, particularly in older people. The elderly population was also underrepresented because the average age of the patients in the MDRD and CKD-EPI studies was 52 and 47 years, respectively4. Furthermore, physiological changes brought on by aging impact the determination of eGFR in the elderly. As a result, there is no reliable approach to evaluate renal function in the elderly (age > 70 years old). Therefore, the optimal formula for this age group in our population must be the subject of further research.
As the elderly and Asian populations were underrepresented in previous studies and there is still little information on the impact of introducing the CKD-EPI equation in a large multiracial Malaysian population specifically looking at the effect of age, our goal in this study is to assess the effect of age between the CKD-EPI and MDRD equations and determine the inter-rater agreement between both equations in Terengganu population using large, representative samples of adult patients presenting in a tertiary hospital with various clinical background within one year.
Material and methods
Research design and sample collection
This cross-sectional study was carried out at Hospital Sultanah Nur Zahirah (HSNZ), a tertiary care facility in Terengganu. All serum creatinine results obtained from patients with a wide range of clinical diagnoses between January 2019 to December 2019 (12 months period) were extracted from the laboratory information system (LIS). Inclusion criteria included adults older than 18 with the first serum creatinine measurement over 12 months. Those with missing demographic (i.e., age and gender) necessary to estimate GFR and those with multiple repeats of serum creatinine within that period were excluded.
Sampling design and sample size
The sampling design used was universal sampling. The sample size calculator (web)7 was used to estimate the sample size. Two mean hypothesis testing, two proportion hypothesis testing and the Kappa coefficient were applied to calculate the sample size. The largest predetermined sample size was 22,844.
Study variables
Estimated GFR was calculated from the serum creatinine measurement using the CKD-EPI equation, and compared with the MDRD equation [Table 1]. The stages and definition of CKD were defined according to Kidney Disease Improving Global Outcome (KDIGO) 2012 Clinical Practice Guideline for the Evaluation and Management of CKD8.
Table 1: Estimated glomerular filtration rate (eGFR) equations
| Estimated glomerular filtration rate (eGFR) equation (mL/min/1.73 m2) | |
| CKD-EPI creatinine equation (2009) |
141 x min (SCr/κ, 1) α x max (SCr /κ, 1)-1.209 x 0.993Age x 1.018 [if female] x 1.159 [if Black]
SCr (standardized serum creatinine) = mg/dL κ = 0.7 (females) or 0.9 (males) α = -0.329 (females) or -0.411 (males) min = indicates the minimum of SCr/κ or 1 max = indicates the maximum of SCr/κ or 1 age = years |
| 4 variable MDRD equation (KDIGO 2002)
|
175 x (SCr)-1.154 x (age)-0.203 x 0.742 [if female] x 1.212 [if Black]
SCr (standardized serum creatinine) = mg/dL
|
Estimation of serum creatinine
A kinetic modification of the Jaffe technique, in which creatinine interacts with picric acid at an alkaline pH to generate a bright orange complex, was used to measure serum creatinine using a Beckman Coulter AU5800 analyzer. The absorbance change rate at 530 and 800 nm is proportional to the sample’s creatinine concentration. The serum calibrator creatinine value is traceable to the Isotope Dilution Mass Spectroscopy (IDMS) method via the National Institute of Standards and Technology (NIST) Standard Reference Material (SRM) 967. The reference range for serum creatinine for males was 59-104 µmol/l while for females, it was 45-84 µmol/l.
Statistical analysis
The data was analyzed using the Analyse-it (Analyse-it TM Software, Ltd, Leeds, UK) and the Statistical Package for Social Science (SPSS) version 26 software (IBM SPSS Statistics 26). Descriptive statistics were tabulated, in which the numerical data was presented in mean (standard deviation, SD) and categorical data were presented in frequency (n) and percentage (%). The mean eGFR estimated using CKD-EPI and MDRD equations were compared using a paired t-test. The intraclass correlation coefficient (ICC), which is defined in accordance with Rosner, defines 0.40 as poor agreement, 0.40 to 0.5 as fair agreement, 0.60 to 0.74 as good agreement, and 0.75 to 1.00 as excellent agreement9 used to show the numerical agreement analysis for eGFR. The Landis and Koch classification was used to interpret the categorical agreement analysis for CKD staging, which was presented in Cohen’s kappa statistic (ƙ): (i) 0.21-0.40 is considered fair agreement, (ii) 0.41-0.60 moderate agreement, (iii) 0.61-0.80 substantial agreement, and (iv) 0.81-1.00 almost perfect agreement 10.
Ethical consideration
Medical Research & Ethics Committee Ministry of Health Malaysia (NMRR-19-3572-52114 (IIR)) and Medical Research Ethics Committee (MREC) Universiti Teknologi MARA (REC/03/2020(MR/58)) both authorized this work.
Results
This study involved 69,329 patients with different comorbidities treated in a tertiary hospital. 37,117 (54%) were women, and 32,212 (46%) were men. The elderly population aged more than 70 years old involved in this study were 9,652 (13.9%) patients.
The patients’ mean (SD) age was 51 (17) years, and the maximum age was 105 years old. The overall mean (SD) eGFR obtained using the CKD-EPI equation was 82.62 (37.33) mL/min/1.73m², and the overall mean (SD) eGFR derived using the MDRD equation was 85.42 (48.47) mL/min/1.73m². Table 2 showed a considerably lower mean eGFR obtained using the CKD-EPI equation compared to the MDRD equation, which is contrary to what was anticipated. These results held true across all age groups.
Table 2: Mean (SD) eGFR measurement (mL/min/1.73m2) calculated from the CKD-EPI and the MDRD equations, in overall and by age group (n=69 329).
| Age group | Mean (SD) (mL/min/1.73m²) | Mean difference
(95% CI)
|
t (df)a | p- value b | |
| CKD-EPI | MDRD | ||||
| All | 82.63 (37.33) | 85.42 (48.47) | -2.79 (-2.94 to 2.63) | -35.41 | <0.001 |
| 18-29 | 110.18 (36.35) | 113.19 (52.98) | -3.02 (-3.52 to 2.51) | -11.69 | <0.001 |
| 30-39 | 99.75 (34.93) | 101.33 (48.69) | -1.58 (-2.00 to 1.15) | -7.31 | <0.001 |
| 40-49 | 87.85 (34.65) | 88.80 (45.88) | -0.95 (-1.35 to 0.56) | -4.73 | <0.001 |
| 50-59 | 76.56 (33.63) | 78.72 (44.90) | -2.16 (-2.48 to 1.83) | -13.1 | <0.001 |
| 60-69 | 67.44 (31.45) | 70.69 (41.47) | -3.26 (-3.54 to 2.98) | -22.69 | <0.001 |
| 70-79 | 61.30 (28.83) | 66.91 (41.12) | -5.60 (-6.03 to 5.18) | -25.92 | <0.001 |
| 80-89 | 57.05 (26.44) | 64.84 (39.94) | -7.78 (-8.64 to 6.93) | -17.87 | <0.001 |
| 90-105 | 52.16 (23.22) | 59.99 (32.49) | -7.82 (-10.21 to 5.43) | -6.48 | <0.001 |
a Statistical test: paired t-test
b Level of significance, α set at 0.05.
The discrepancies in CKD staging based on the GFR estimated using CKD-EPI and MDRD equations are shown in figure 1. When GFR was estimated using the CKD-EPI equation, the prevalence of participants with stages 2-5 was generally lower [figure 1(A)], and a similar pattern of prevalence was observed in individuals <70 years old when stratified by age group [figure 1(B)]. However, in individuals >70 years, the prevalence of participants with stage 2 was higher and slightly higher in stages 4 and 5 when eGFR was derived using the CKD-EPI equation [figure 1(C)].
 |
Figure 1A: Differences in CKD stages in all individuals. |
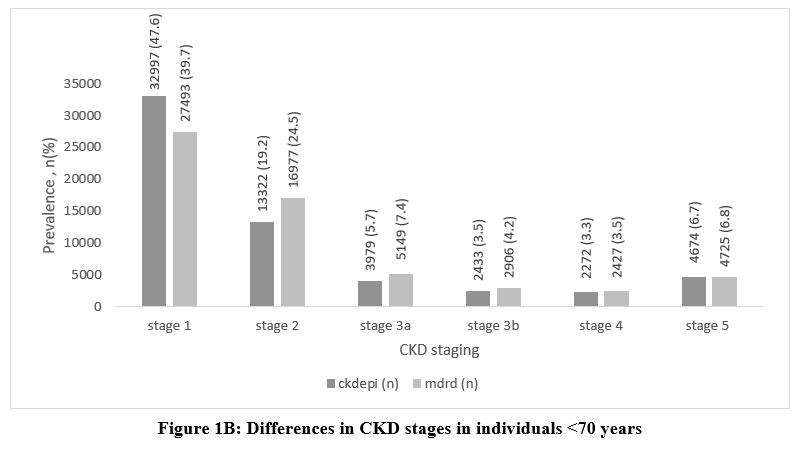 |
Figure 1B: Differences in CKD stages in individuals <70 years. |
 |
Figure 1C: Differences in CKD stages in individuals >70 years. |
Tables 3,4 and 5 illustrate how age affected both eGFR equations. In comparison to the MDRD equation, the CKD-EPI equation indicated a lower prevalence (%) of CKD (eGFR <60 mL/min/1.73m²) in the age category of 18-79, except for age >80 years old, when a slightly greater prevalence of CKD was calculated. The age range of 60 to 69 years had the highest frequency of CKD patients. Categorical agreement between GFR categories (CKD vs NON-CKD) using MDRD and CKD-EPI equations showed almost perfect agreement (ƙ= 0.932). Numerical agreement revealed excellent agreement (ICC = 0.883) in all age groups. The strength of agreement was better in younger people (<70 years ICC = 0.883 vs >70 years ICC = 0.843) [ Table 5].
Table 3: Prevalence of CKD (eGFR <60 mL/min/1.73m2) by age groups.
| Age | CKD (eGFR <60 mL/min/1.73m2) | |
| CKD-EPI
% (95% CI) |
MDRD
% (95% CI) |
|
| ALL |
25.7 (25.4 – 26.1) |
28.4 (28.1 – 28.8) |
| 18-29 |
1.5 (1.4 – 1.6) |
1.8 (1.7 – 1.9) |
| 30-39 |
2.1 (2.0 – 2.2) |
2.6 (2.5 – 2.7) |
| 40-49 |
2.7 (2.5 – 2.8) |
3.1 (3.0 – 3.3) |
| 50-59 |
5.5 (5.4 – 5.7) |
6.2 (6.1 – 6.4) |
| 60-69 |
7.4 (7.2 – 7.6) |
8.1 (7.9 – 8.3) |
| 70-79 |
4.9 (4.8 – 5.1) |
5.0 (4.9 – 5.2) |
| 80-89 |
1.4 (1.3 – 1.5) |
1.3 (1.2-1.5) |
| 90-105 |
0.2 (0.1 – 0.3) |
0.1 (0.1 – 0.1) |
Reduced prevalence of CKD estimated by CKD-EPI equation compared to MDRD equation except for the age >80 years old where slightly higher percentage of CKD estimated by CKD-EPI equation.
Table 4: Differences in prevalence of eGFR categories (mL/min/1.73m²) within population by age groups using MDRD and CKD-EPI equations.
| Age
group
|
Percent prevalence of CKD-EPI eGFR – percent prevalence of MDRD eGFR
(y-x) |
||||||
| >90
(stage 1) |
60-89
(stage 2) |
45-59
(stage 3a) |
30-44
(stage 3b) |
15-29
(stage 4) |
<15
(stage 5) |
||
| 18-29 | 1.3 | -1 | -0.2 | -0.1 | 0 | 0 | |
| 30-39 | 1.9 | -1.4 | -0.3 | -0.1 | 0 | 0 | |
| 40-49 | 1.7 | -1.2 | -0.3 | -0.1 | 0 | 0 | |
| 50-59 | 2 | -1.3 | -0.4 | -0.2 | -0.1 | 0 | |
| 60-69 | 1.1 | -0.4 | -0.4 | -0.2 | -0.1 | 0 | |
| 70-79 | -0.7 | 0.7 | -0.1 | 0 | 0 | 0 | |
| 80-89 | -0.3 | 0.3 | 0 | 0 | 0 | 0 | |
| 90-105 | 0 | 0 | 0 | 0 | 0 | 0 | |
Table 5: Agreement between CKD-EPI and MDRD, overall and by age group (n = 69 329)
| Age group | n | Cohen’s Kappa (95% CI) | ICC (95% CI) |
| All | 69329 | 0.932 (0.929-0.935) | 0.883 (0.878-0.888) |
| 18-29 | 10133 | 0.901 (0.888-0.915) | 0.835 (0.827-0.842) |
| 30-39 | 11000 | 0.876 (0.864-0.889) | 0.857 (0.852-0.862) |
| 40-49 | 9866 | 0.892 (0.881-0.903) | 0.879 (0.874-0.883) |
| 50-59 | 14412 | 0.914 (0.906-0.921) | 0.875 (0.869-0.880) |
| 60-69 | 14266 | 0.933 (0.927-0.939) | 0.888 (0.877-0.898) |
| 70-79 | 7628 | 0.984 (0.980-0.988) | 0.848 (0.814-0.874) |
| 80-89 | 1900 | 0.966 (0.955-0.978) | 0.821 (0.794-0.869) |
| 90-105 | 124 | 0.901 (0.825-0.978) | 0.855 (0.694-0.921) |
Note: CI, Confidence Interval; ICC, Intraclass correlation coefficient
Discussion
The data indicate that, in contrast to the MDRD equation, implementation of the CKD-EPI equation resulted in (i) the mean eGFR derived being significantly lower, (ii) the overall prevalence of CKD was reduced (iii) the prevalence of CKD in age groups 18-79 years was reduced but increased in elderly >80 years (iv) the numerical agreement of eGFR was excellent, and the categorical agreement of CKD was almost perfect in all age groups.
As far as we can tell, our study is the largest study conducted in Malaysia to evaluate how well the CKD-EPI and MDRD equations perform in our population, as well as being the only study to focus specifically on the influence of age in the elderly. Knowledge of the most accurate and reliable assessment of renal function in this age group is vital considering the expanding elderly population in Malaysia (age > 65)11. In addition, statistics from a recent study showed that the prevalence of CKD in the elderly population in Malaysia had increased tremendously12. In the present study, the mean GFR estimated by the CKD-EPI equation is lower than the mean GFR estimated by the MDRD equation in all age groups. This finding was in contrast with other studies5, 13 that suggested the mean GFR estimated by CKD-EPI was higher than the mean GFR estimated by the MDRD equation. Nevertheless, this finding is in accordance with the prior study involving the Malaysian population, even though the study only included a limited number of CKD patients14. The overestimation of eGFR by the MDRD equation for eGFR >120 mL/min/1.73m² may be the reason why the mean GFR calculated by CKD-EPI is lower than the MDRD. Neither MDRD nor CKD-EPI have been verified in this normal eGFR range, reflecting the insufficiency of both equations to predict eGFR in this range15. In addition, the difference across laboratories in blood creatinine test calibration is known to have a greater influence at higher GFR levels. Significantly more biological and measurement variability was also observed at higher GFR levels16. Additionally, we recalculated the mean eGFR by removing individuals with eGFR greater than 120 mL/min/1.73m2. We discovered that the mean GFR estimated by the CKD-EPI equation was higher than that determined by the MDRD equation at ages 18-69 but lower beyond that age.
The prevalence of CKD is strongly dependent on which equation was used for estimating the renal function17 hence it is worth mentioning that prevalence in our study was calculated to demonstrate the relationship between the two eGFR equations used rather than for population screening. The CKD- EPI equation has been used in previous screening studies for the Malaysian population, and the report showed that the prevalence of CKD in Malaysia increased from 9.07% in 201118 to 15.48% in 201819. Therefore, after considering the implications of the eGFR equation used, the main factors for this upward trend are the increasing prevalence of non-communicable diseases and changes in population demographics (increase in the elderly population).
In this study, 28.4% (19,709) of all patients were classified as having CKD (eGFR <60 mL/min/1.73m²) when the MDRD equation was used, but this number fell to 25.7% (17,837) when the CKD-EPI formula was applied. This is parallel to studies in other populations 13, 14, 20. Reduced prevalence of CKD will reduce referral to nephrologists; hence more attention and better care can be given to CKD patients with higher comorbidities.
From this study, we also discovered that the CKD-EPI equation lowered CKD prevalence, particularly among the 18–79-year age group but increased CKD prevalence in the elderly aged >80. This finding is consistent with previous research in the United Kingdom 21 where the age threshold at which this becomes significant was 85 years (women) and 80 years (men). In another British population 22 and a Dutch population, the age threshold was slightly lower, > 75 years (women) and > 70 years (men)23. Similar results were also found in the American (NHANES)5 and Australian populations 13 even though different ethnicity may affect the eGFR. The physiological aging process and rising rates of CKD risk factors in the elderly including diabetes, hypertension and cardiovascular disease (CVD) 17 were some of the causes contributing to the rise in CKD prevalence in the elderly.
As opposed to the MDRD equation, the CKD-EPI equation classified eGFR to a better stage. This finding gives strong implications for clinical practice as reduction of stage 3 and above will not only avoid unnecessary referral to nephrologist or physician, but also reduce anxiety in patients, reduce the frequency in renal profile and other biochemical investigations monitoring such as serum hemoglobin, serum calcium, serum phosphate and serum alkaline phosphatase. Therefore, less work is required to care for these patients and the funding for primary care facilities can also be reduced.
From this study, both numerical and categorical agreement was excellent. Surprisingly the intraclass correlation coefficient (numerical agreement) was improved in the younger people (<70 years ICC = 0.883 vs >70 years ICC = 0.843). The possible reason for the improved agreement in the younger population as compared to the elderly could be due to smaller mean differences of eGFR in the <70 years old population [Table 5]. As for the Kappa value (categorical agreement), the finding was correlated with the UK study21 where the agreement was increased in the elderly. This is explained by the increased prevalence of CKD patients in the elderly population. Good agreement between the MDRD and CKD-EPI equations was also found in studies of 600 elderly people in Spain (older than 85 years) 24 and Italy (average age 80 years) 25 with a kappa value of 0.958 and 0.82-0.87, respectively, which is in agreement with our results, although our study population includes > 18-year-olds. Thus, it can be said that both eGFR equations are interchangeable, especially in the elderly.
We acknowledge that there were some limitations in our study. Ideally, we should measure true GFR in order to compare it with our estimated GFR. But measured GFR is complex, costly and difficult to conduct in large-scale studies. Therefore, no conclusion can be made regarding the relative accuracy of the two equations in our population. In this study, estimated GFR was based on a single creatinine result only. Hence, this will not reflect the true CKD and will likely increase the estimated prevalence observed.
In conclusion, CKD-EPI is not a panacea to reduce the prevalence of CKD because it identifies more older patients with the disease. However, it could be argued that both equations are interchangeable because of their high concordance, especially in older adults.
Conclusion
In this study, we conclude that our results are consistent with those of studies conducted in other countries, which demonstrated that the application of the CKD-EPI equation lowers the prevalence of CKD in younger patients (18-79 years old) but raises it in older patients >80 years old. Our work showed that the CKD-EPI equation is an appropriate alternative for the MDRD equation in all age groups, including the elderly, due to the excellent agreement between the two equations. Further validation studies involving a large multiethnic ethnic population in Malaysia are needed to determine the best GFR estimating equation for our elderly population.
Acknowledgements
Special thanks to the dedicated staff in the chemical pathology lab and IT Unit of Hospital Sultanah Nur Zahirah for their assistance in data collecting for this study.
Conflicts of Interest
The authors declare that there are no conflicts of interest regarding the publication of this paper.
Funding sources
This research received no specific grant from any funding agency in the public, commercial, or not-for-profit sectors.
References
- Boele-Schutte, E. & Gansevoort, R. T. Measured GFR: Not a gold, but a gold-plated standard. Nephrology Dialysis Transplantation 32, ii180–ii184 (2017).
CrossRef - Cockroft 1976.
- Levey, A. S. et al. Annals of Internal Medicine A More Accurate Method To Estimate Glomerular Filtration Rate from Serum Creatinine: A New Prediction Equation. vol. 130 http://www.acponline.org. (1999).
CrossRef - Levey, A. S. et al. Using Standardized Serum Creatinine Values in the Modification of Diet in Renal Disease Study Equation for Estimating Glomerular Filtration Rate. www.annals.org (2006).
CrossRef - Levey, A. S. et al. A New Equation to Estimate Glomerular Filtration Rate. www.annals.org (2009).
CrossRef - MOH. CPG Management of Chronic Kidney Disease (Second Edition). (2018).
CrossRef - Arifin, W. N. A Web-based Sample Size Calculator for Reliability Studies. Education in Medicine Journal 10, 67–76 (2018).
CrossRef - Official Journal Of the internatiOnal SOciety Of nephrOlOgy KDIGO 2012 Clinical Practice Guideline for the Evaluation and Management of Chronic Kidney Disease. www.publicationethics.org.
- B. Rosner. Fundamentals of Biostatics. (Duxbury Press, 2005).
- Landis, J. R. & Koch, G. G. The Measurement of Observer Agreement for Categorical Data. vol. 33 https://about.jstor.org/terms (1977).
CrossRef - Department of Statistic Malaysia. Age structure 2022. (2022).
- Saminathan, T. A. et al. Prevalence of chronic kidney disease and its associated factors in Malaysia; Findings from a nationwide population-based cross-sectional study. BMC Nephrol 21, (2020).
CrossRef - White, S. L., Polkinghorne, K. R., Atkins, R. C. & Chadban, S. J. Comparison of the Prevalence and Mortality Risk of CKD in Australia Using the CKD Epidemiology Collaboration (CKD-EPI) and Modification of Diet in Renal Disease (MDRD) Study GFR Estimating Equations: The AusDiab (Australian Diabetes, Obesity and Lifestyle) Study. YAJKD 55, 660–670 (2010).
CrossRef - Jalalonmuhali, M., Lim, S. K., Md Shah, M. N. & Ng, K. P. MDRD vs. CKD-EPI in comparison to 51Chromium EDTA: A cross sectional study of Malaysian CKD cohort. BMC Nephrol 18, (2017).
CrossRef - Ibrahim, F. et al. Comparison of CKD-EPI and MDRD to estimate baseline renal function in HIV-positive patients. Nephrology Dialysis Transplantation 27, 2291–2297 (2012).
CrossRef - Stevens, L. A., Coresh, J., Greene, T. & Levey, A. S. Assessing Kidney Function-Measured and Estimated Glomerular Filtration Rate. N Engl J Med vol. 354 www.nejm.org (2006).
CrossRef - Zhang, Q. L. & Rothenbacher, D. Prevalence of chronic kidney disease in population-based studies: Systematic review. BMC Public Health 8, (2008).
CrossRef - Hooi, L. S. et al. A population-based study measuring the prevalence of chronic kidney disease among adults in West Malaysia. Kidney Int 84, 1034–1040 (2013).
CrossRef - Saminathan, T. A. et al. Prevalence of chronic kidney disease and its associated factors in Malaysia; Findings from a nationwide population-based cross-sectional study. BMC Nephrol 21, (2020).
CrossRef - Jalalonmuhali, M., Lim, S. K., Md Shah, M. N. & Ng, K. P. MDRD vs. CKD-EPI in comparison to 51Chromium EDTA: A cross sectional study of Malaysian CKD cohort. BMC Nephrol 18, (2017).
CrossRef - O’Callaghan, C. A., Shine, B. & Lasserson, D. S. Chronic kidney disease: A large-scale population-based study of the effects of introducing the CKD-EPI formula for eGFR reporting. BMJ Open 1, (2011).
CrossRef - Carter, J. L., Stevens, P. E., Irving, J. E. & Lamb, E. J. Estimating glomerular filtration rate: Comparison of the CKD-EPI and MDRD equations in a large UK cohort with particular emphasis on the effect of age. QJM 104, 839–847 (2011).
CrossRef - van den Brand, J. A. J. G. et al. Introduction of the CKD-EPI equation to estimate glomerular filtration rate in a Caucasian population. Nephrol Dial Transplant 26, 3176–3181 (2011).
CrossRef - Bustos-Guadã No, F. et al. Revista de la Sociedad Española de Nefrología Estimation of the glomerular filtration rate in people older than 85: Comparisons between CKD-EPI, MDRD-IDMS and BIS1 equations. (2017).
CrossRef - Corsonello, A. et al. Agreement between equations estimating glomerular filtration rate in elderly nursing home residents and in hospitalised patients: Implications for drug dosing. Age Ageing 40, 583–589 (2011).
CrossRef

