
Manuscript accepted on :11-10-2022
Published online on: 13-01-2023
Plagiarism Check: Yes
Reviewed by: Dr. Francisco Solano , Dr. Sohayla Mohamed Elsherbini Attalla
Second Review by: Dr. Exbrayat Jean-Marie
Final Approval by: Dr. Najam A. Siddiqi
Harini Rangaraju1  and Shenbaga Lalitha Sankar2*
1Department of Biochemistry, Medical research Foundation, Sankara Nethralaya, India, 600006,
2Department of Biochemistry, Sree Balaji Medical College and Hospital, India, 600044,
Corresponding Author E-mail: dr.lalittha@gmail.com
DOI : https://dx.doi.org/10.13005/bpj/2641
Abstract
Introduction Lifestyle factors are among the multiple factors that initiate pathology of non-communicable diseases (NCD) which starts in young age and remains undetected till the clinical symptoms occur. Serum antioxidant levels in individuals with varied lifestyle habits were evaluated to determine the relationship between lifestyle factors, reactive oxygen species and development of NCD. Objectives The purpose of this study is to evaluate the role of serum antioxidants in the metabolic changes initiated by lifestyle choices of apparently healthy individuals. Materials and methods 104 healthy volunteers of age 20-30 years from South Indian Population were randomly selected after obtaining informed consent for the cross section observational study. The inclusion criteria were Fasting glucose <100mg/dl, Triglycerides <150mg/dl, Total cholesterol< 200mg/dl and Hemoglobin >12 g/dl (females) and >14g/dl (males). Lifestyle factors like age, gender, diet, socioeconomic condition, physical activity, psychological stress, smoking, alcohol were determined based on questionnaires. Fasting serum antioxidants- Superoxide dismutase (SOD), Glutathione peroxidase (GPx), Coenzyme Q10 – single dilution method HPLC, serum uric acid and body mass index (BMI) were estimated. Pearson correlation and Spearman rho correlation was done using SPSS software version 17 with “p” value <0.05 were considered as significant. Results Mean of Age (25.30±3.214), BMI (22.5±4.65), Superoxide dismutase (U/mL) (181.78±17.9), Glutathione peroxidase (U/L) (8607.36±1237.2), Coenzyme Q10 (μg/L) (484.12±59.65) and Uric acid (mg/dL) (4.92±1.27) are as noted in the study group. A positive correlation was found between SOD, CoQ10 and increased dietary intake of fruits and vegetables, low BMI, higher Socio economic status. GPx and uric acid had a positive correlation with age, smokers and alcoholics, and negative correlation with physical activity. Gender wise differences significantly seen in GPx and Uric acid. Conclusion Serum antioxidants are altered by the lifestyle choices of the study population.
Keywords
Antioxidants; Biomarker; Lifestyle Factors; Non communicable disease; Young Population
Download this article as:| Copy the following to cite this article: Rangaraju H, Sankar S. L. Effect of Lifestyle Factors on Serum Antioxidant Levels in Apparently Healthy Individuals. Biomed Pharmacol J 2023;16(1). |
| Copy the following to cite this URL: Rangaraju H, Sankar S. L. Effect of Lifestyle Factors on Serum Antioxidant Levels in Apparently Healthy Individuals. Biomed Pharmacol J 2023;16(1). Available from: https://bit.ly/3GCWfeb |
Introduction
Health is defined by WHO as “A state of complete physical, mental and social well-being and not merely the absence of disease or infirmity”1. Several factors like lifestyle choices, environment, genetic constitution, public health amenities play a major role in determining health status of individuals2. But individuals with underlying Non-communicable diseases (NCD) go unrecognized in initial stage, which occurs in young age, and are diagnosed only after symptoms occur as age and disease progresses. This is because there are no definite tests to evaluate the influence of the above mentioned various factors on an individual’s health. Studies have shown that lifestyle factors induce biochemical alterations3 from a young age i.e. < 30 years4,5. Studies have also shown that reactive oxygen species by causing oxidative damage contributes to development of NCD6.
Hence in this study the lifestyle practices, [non-modifiable-age, gender, ethnicity and modifiable-behavioral (smoking, alcohol, drug usage), material (socio-economic condition), psychosocial, diet and nutrition and physical activity]5 of the young subjects and their serum antioxidants[Enzyme System- Superoxide Dismutase, Glutathione system- Glutathione Peroxidase, Pro oxidants- Uric acid, and other antioxidant metabolites7-Coenzyme Q10] have been evaluated. This is to check for correlation between the two as both are among the major contributors of development of NCD. The aim is to see if the serum antioxidants are modified due to the metabolic changes initiated by the lifestyle practices that are known to contribute to development of NCD.
This current study was conducted on a group of apparently healthy individuals in a South Asian population of young adults without any proven detectable pre-existing cause for altered serum antioxidant level. Their lifestyle factors were analyzed and their serum antioxidant levels has been simultaneously estimated and correlation between them has been statistically determined with certain limitations.
Materials and methodology
This cross-sectional observational study was conducted from July 2017 to June 2018 in a young south Indian population of Chennai, Tamil Nadu after getting prior approval from the Institutional ethics committee.
Apparently healthy volunteers i.e. with no history of any known disease and no complaints of any symptoms, under the age group of 20-30 years were randomly selected after providing complete information about this study and after getting informed consent in written format in their own preferred language in the presence of a witness. They were then tested for their fasting plasma glucose (FPG), fasting lipid profile and hemoglobin levels.
Inclusion criteria
Out of them 104 apparently healthy individuals (53 females and 51 males) with values within the range of FPG 70- 99 mg/dl (GOD POD Method), serum triglycerides <150mg/dl (Glycerol phosphate/peroxidase method), serum cholesterol< 200mg/dl (Cholesterol oxidase/peroxidase method) and hemoglobin 12-14 g/dl (Drabkin’s method8) for females and >13.5-17g/dl for males were enrolled in the study. Subjects with values out of the specified range and with significant medical illness or history that can cause oxidative stress were excluded from the study.
The selected subjects were then evaluated for their modifiable lifestyle factors like dietary habits (dietary intake of fruits and vegetables)9, socioeconomic condition(upper high, high, upper middle, lower middle, poor)10, psychological stress(no stress, moderate, high chance for stress related changes)11, physical activity and exercise (High, moderate, low-sedentary)12,smoking(high, moderate, nonsmokers)13 and alcohol consumption(high, moderate, non-consumers)14 by questionnaire method. The non-modifiable factors: Age (20 – 30 years), gender (males and females), ethnicity (south Indian) and also body mass index (BMI)15 were noted.
Questionnaires
The questionnaires which were internationally pre validated reliable and specific to the study factors were selected. The format was structured and close ended with multiple choice answers. They were easy to comprehend and were self administered in their preferred language.
Body mass index calculation
Body mass index (BMI) was calculated by dividing weight (kg) by height squared (m2)15 .They were classified in terms of: Normal 18.50- 22.99-1, Underweight <18.50 – 2, Overweight 23-24.99-3, Pre Obese 25-29.99-4, extreme obesity> 30-5 according to WHO table for Asians population.
Laboratory investigation
2ml of fasting (8-10 hours overnight) venous whole blood sample was collected in Light protected heparinized tubes aliquots prepared and processed for Superoxide dismutase-Arthur and Boyne method16 (Reference range164-240 U/mL), Glutathione peroxidase -method based on Paglia and valentine17 (Reference Range-4171-10881 U/L) in Spectro max e2, Coenzyme Q10 –single dilution method18 in HPLC Shimadzu (Reference Range 433-1532 µg/L), Uric acid-Uricase / POD method(Male: 4.0-7.2mg/dL, Female: 2.7-6.5mg/dL) in fully automated analyzer.
Exclusion criteria
Subjects with diseases causing oxidative stress and low antioxidant levels like: neurodegenerative diseases,19 cardiovascular diseases,20 diabetes mellitus21, hypertension,cancer22, cerebrovascular diseases, dyslipidemia23, liver diseases24, tuberculosis, anemia and drug(nutritional supplements) intake history and family history of NCD.
Statistical analysis
Statistical analysis was done using SPSS Inc. version 17.0 IBM software. The mean and standard deviation was calculated for all numerical values. Pearson correlation was done with confidence interval (C.I) 95% and p value up to < 0.05 was taken as significant. For gender association Spearman Rho correlation study was performed with C.I 95% and p value < 0.05 was taken as significant.
Result and discussion
In this study 104 individuals selected based on the criteria for apparently healthy status were studied and their lifestyle factors and antioxidant levels relationship were evaluated. The mean and standard deviation values for the age, BMI, and the four antioxidants studied are given in table 1.
Table 1: Mean, median and standard deviation of numerical parameters in this study.
| PARAMETER | VALUES Mean± S.D |
| Age (in years) | 25.30±3.214 |
| BMI (kg/m2) | 22.5±4.65 |
| Superoxide dismutase (U/mL) | 181.78±17.9 |
| Glutathione peroxidase (U/L) | 8607.36±1237.2 |
| Coenzyme Q10 (µg/L) | 484.12±59.65 |
| Uric acid (mg/dL) | 4.92±1.27 |
Pearson correlation studies between the lifestyle factors and serum SOD, GPx, CoQ10 and Uric acid were done and the values are shown in Table 2. In this current study as age progresses GPx and Uric acid seems to increase and SOD seems to fall, but as this is a limited group of only 20-30 years, this needs more data in a larger age group for it to be conclusive. The findings for SOD and GPx are consistent with the studies conducted by Bolzan et al25 and PP Singh et al26 in terms of age and data among individuals with or without smoking. Kaikonnen et al27 have shown positive influence of age on CoQ10 and uric acid relationship with age in our study is consistent with Chen et al28.
Table 2: Pearson correlation study between serum antioxidants and the lifestyle factors.
| Antioxidant | Age | SE score | IPAQ score | FACET score | STRESS score | Smoking score | Alcohol score | BMI score |
| Superoxide dismutase
|
-.204*
.038 |
-.198*
.044 |
.191
.052 |
.284**
.004 |
-.331**
.001 |
.216*
.028 |
-.162
.101 |
-.207*
.035 |
| Glutathione peroxidase
|
.266**
.006 |
.059
.549 |
-.857**
.000 |
-.103
.300 |
.155
.117 |
-.594**
.000 |
.765**
.000 |
.039
.691 |
| Coenzyme Q10
|
-.092
.354 |
-.309**
.001 |
.068
.492 |
.358**
.000 |
-.093
.348 |
.258**
.008 |
-.110
.267 |
-.259**
.008 |
| Uric acid
|
.340**
.000 |
-.273**
.005 |
-.344**
.000 |
-.016
.876 |
.043
.661 |
-.381**
.000 |
.436**
.000 |
.733**
.000 |
* Significant at 0.05 level (2 tailed) ** Significant at 0.01 level (2 tailed)
Overall the dietary intake have positive influence on SOD and CoQ10 levels which is consistent with other studies conducted. Toaldo et al had similar results with SOD and uric acid and they also reported increase of GPx with fruit juice intake29. Gutierrez-Mariscal et al reported about the importance of dietary intake of fruits and vegetables and CoQ10 in preventing oxidative DNA damage30.
Socio economic condition showed that with increasing socioeconomic betterment there was a statistically significant decrease of SOD, CoQ10 and uric acid but within reference range. When seen according to gender males showed the negative influence of social class only with CoQ10 and females showed negative influence of social class on uric acid alone. Mulholland et al study on the influence of social class on SOD and GPx showed the significant influence on GPx but not on SOD31.
Decreased physical activity increased the GPx25 and Uric acid with p<0.05 above the reference range. But SOD and CoQ10 did not show any significant influence in our study. Mena et al32 have proven positive influence of physical activity on SOD and GPx. Sarmiento et al showed positive influence of physical activity on CoQ10 levels33. Psychological stress shows increase in SOD values in abnormal range whereas in low stress conditions values are within range consistent with similar studies34.
Smoking and alcoholism is more prevalent among male population than in female population in India but this level is slowly rising among female population. For association between gender and antioxidant levels Spearman’s Rho test was performed, in that only GPx and uric acid showed significant difference within gender due to their influence on alcohol and smoking. Table 3 shows the results. And the statistical data was split to determine the significance of lifestyle factors influence on antioxidant levels in males and females separately as seen in table 4 and table 5.
Table 3: Spearman rho test for association between gender and antioxidant levels.
| Antioxidant | Gender |
| Superoxide dismutase
Correlation coefficient |
.084
.396 |
| Glutathione peroxidase
Correlation coefficient |
-.487**
.000 |
| Coenzyme Q10
Correlation coefficient |
.006
.951 |
| Uric acid
Correlation coefficient |
-.433**
.000 |
* Significant at 0.05 level (2 tailed) ** Significant at 0.01 level (2 tailed)
Table 4: Pearson correlation study to determine the influence of lifestyle factors on serum antioxidants in males
| Antioxidant | Age | SE score | IPAQ score | FACET score | STRESS score | Smoking score | Alcohol score | BMI score |
| Superoxide dismutase | -.380*
.006 |
-.239
.091 |
.112
.434 |
.291*
.038 |
.454**
.001 |
.366**
.008 |
.310*
.027
|
-.275*
.051 |
| Glutathione peroxidase | .051
.722 |
.129
.369 |
-.850**
.000 |
-.173
.226 |
.036
.800 |
-.599**
.000 |
.884**
.000 |
.185
.193 |
| Coenzyme Q10
|
-.296*
.035 |
-.445**
.001 |
.132
.356 |
.438**
.001 |
-.104
.467 |
.431**
.002 |
-.280*
.047 |
-.361**
.009 |
| Uric acid
|
.129
.366 |
-.026
.854 |
-.352*
.011 |
-.214
.131 |
.134
.350 |
-.311*
.026 |
.333**
.017 |
.750**
.000 |
* Significant at 0.05 level (2 tailed)** Significant at 0.01 level (2 tailed)
Table 5: Pearson correlation study to determine the influence of lifestyle factors on serum antioxidants in females
| Antioxidant | Age | SE score | IPAQ score | FACET score | STRESS score | Smoking score | Alcohol score | BMI score |
| Superoxide dismutase | .064
.650 |
-.172
.217 |
.296*
.031 |
.275*
.047 |
-.238
.086 |
-.081
.564 |
.075
.596
|
-.145
.299 |
| Glutathione peroxidase
|
.150
.284 |
.045
.749 |
-.805**
.000 |
.007
.962 |
.196
.160 |
-.206
.138 |
.224
.107 |
-.213
.125 |
| Coenzyme Q10
|
.062
.661 |
.168
.228 |
.031
.827 |
.286*
.038 |
-.096
.493 |
.029
.838 |
.069
.634 |
-.141
.314 |
| Uric acid
|
.229
.100 |
-.467**
.000 |
-.053
.704 |
.164
.240 |
-.107
.446 |
-.116
.408 |
.049
.729 |
.866**
.000 |
* Significant at 0.05 level (2 tailed)** Significant at 0.01 level (2 tailed)
Overall smoking had a positive influence on SOD, CoQ10 levels when values were within range ie nonsmokers. Smokers showed negative correlation with GPx and Uric acid. Conen et al35 showed no correlation between uric acid and smoking. Niklowitz et al showed male smokers had increased levels of CoQ10 than female smokers36.
The overall effect of alcohol consumption showed increased values of GPx and uric acid. In males alone when evaluated alcohol had positive correlation with increase in SOD, GPx and uric acid and showed negative association27 with decrease CoQ10 values. Chien et al37 and Lieber et al38 showed similar finding regarding alcohol on uric acid. Mulholland et al showed no relationship between alcohol and SOD and GPx31 which is different than the findings in our study.
Increased BMI being one of the risk factors for many NCD has been widely evaluated in patients with NCD. In this study lower the BMI with cut off at normal BMI range showed levels of SOD CoQ10 within range whereas uric acid35,37 seems to increase with increase in BMI. Same findings were seen when males and females data were separately analyzed. Marklund et al have also shown decreasing levels of SOD with increasing BMI39.
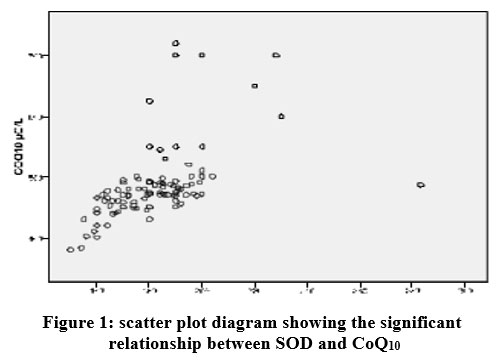 |
Figure 1: scatter plot diagram showing the significant relationship between SOD and CoQ10 |
Thus the findings in our study and the comparison with other studies show that most findings are consistent but certain discrepancies exist as explained above, which may need further detailed evaluation.
Conclusion
In this current study it is conclusive that serum antioxidant levels are significantly influenced by the different lifestyle choices. In considering modifiable lifestyle factors-betterment of socioeconomic status, low stress, low BMI, increased fruits and vegetables in diet and nonsmoking had appositive healthy influence on SOD and CoQ10, GPx and uric acid and showed the values within the reference range pointing as good lifestyle factors.. Typically sedentary lifestyle and alcohol consumption raised GPx and Uric acid values above the reference values(unhealthy trend maybe signifying compensatory mechanism) with statistical significance of p<0.05.Smoking had a negative relationship with GPx and Uric acid. From these findings we have come to the conclusion that individuals with good lifestyle and bad lifestyle choices have a line of demarcation determined by antioxidant levels. The main limitation of the study is that only few antioxidants were estimated and oxidant stress factor was not evaluated to equate to corresponding antioxidant levels and follow up of these patients were not possible. This study can be taken further by overcoming these limitations with a broader study group and adequate follow up.
Conflict of Interest
No conflict of interest.
Funding Sources
No external funding source.
References
- Preamble to the Constitution of the World Health Organization as adopted by the International Health Conference, New York, 19-22 June, 1946; signed on 22 July 1946 by the representatives of 61 States (Official Records of the World Health Organization, no. 2, p. 100) and entered into force on 7 April 1948.
- World Health Organization. The determinants of health. Available from:https://www.who.int/gender-equity-rights/understanding/sdh-definition/en/.
- Wingard DL, Berkman LF, Brand RJ. A multivariate analysis of health-related practices: a nine-year mortality follow-up of the Alameda County Study. Am J Epidemiol.1982; 116 (5): 765–775.PMID7148802.Housman & Dorman 2005, pp. 303–304
- Kaveeshwar SA, Cornwall J. The current state of diabetes mellitus in India.AMJ 2014, 7, 1, 45-48.http//dx.doi.org/10.4066/AMJ.2014.1979
CrossRef - Park. K Park textbook of preventive and social medicine. 23rd edition. Madhya Pradesh: Banarsidas Bhanot publishers; 2015. ISBN 978-93-82219-05-7
- Stańczyk M, Gromadzińska J, Wasowicz W. Roles of reactive oxygen species and selected antioxidants in regulation of cellular metabolism. Int J Occup Med Environ Health. 2005; 18(1):15-26.
- Vasudevan DM, Sreekumari S, Vaidyanathan K. Textbook of biochemistry for medical students. 7th edition.New Delhi: Jaypee publishers; 2013 p433-8.
- Mosby’s Manual of Diagnostic and Laboratory Tests. Third edition, By Kathleen Deska Pagana Ph.D., and Timothy J. Pagana M.D.FACS.
- Ashfield-Watt PAL, Welch AA, Godward, S, Bingham SA. Effect of a pilot community intervention on fruit and vegetable intakes: use of FACET (Five-a-day Community Evaluation Tool). Public Health Nutrition: 10(7), 671–80.
CrossRef - Aggarwal OP, Bhasin SK, Sharma AK, Chhabra P, Aggarwal K, Rajoura OP. A New Instrument (Scale) for Measuring the Socioeconomic Status of a Family: Preliminary Study. Indian Journal of Community Medicine Vol. 30, No. 4, October-December, 2005.
- International Stress Management Association. UK. Stress Questionnaire. Available from: https://isma.org.uk/sites/default/files/clients/413/Stress-Questionnaire-F2.pdf
- International physical activity questionnaire short form. Available from: https://sites.google.com/site/theipaq/questionnaire_links
- Cerutti PA. Prooxidant States and Cancer. Science 1985; 227:375–81.
CrossRef - AUDIT questionnaire available from:https://www.who.int/publications/i/item/audit-the-alcohol-use-disorders-identification-test-guidelines-for-use-in-primary-health-care.
- Davison, C, Frankel S, Davey Smith G. The limits of lifestyle: re-assessing `fatalism’ in the popular culture of illness prevention. Social Science and Medicine. 1992; 34, 675–85.
CrossRef - Superoxide dismutase (Ransod) assay. Randox kit insert. Randox Laboratories Ltd., Crumlin, County Antrim, UK Cat SD 125.
- Glutathione peroxidase (Ransel) assay. Randox kit insert. Randox Laboratories Ltd., Crumlin, County Antrim, UK RS 504.
- Littarru G P, Mosca F,Fattorini,D, Bompadre S,. Assay of Coenzyme Q10 in Plasma by a Single Dilution Step. Analytical Biochemistry 305, 49–54 (2002)
CrossRef - Barnham K J, Masters CL, Bush AI. Neurodegenerative diseases and oxidative stress. Nature Reviews Drug Discovery3, 205-214 (March 2004) | doi: 10.1038/nrd1330.
CrossRef - Asplund K. Antioxidant vitamins in the Prevention of cardiovascular diseases: a systemic review. J Intern Med 2002; 251:372
CrossRef - Allen RG, Balon AK. Oxidative influence in development and differentiation: and overview of a free radical theory of development. Free RadicBiol Med 1989; 6:631–61.
CrossRef - Klaunig JE, Kamendulis LM: The role of oxidative stress in carcinogenesis. Ann Rev Pharm Tox 2004; 44:239
CrossRef - Molinie F, Favier A, Kauffmann F, Berr C. Effects of lipid peroxidation and antioxidant status on peak flow in a population aged 59–71 years: the EVA study.
- Videla LA. Oxidative stress signaling underlying liver disease and hepatoprotective mechanisms. World J Hepatol 2009 October 31; 1(1): 72-78 ISSN 1948-5182 (online)
CrossRef - Bolzán AD, Bianchi MS, Bianchi NO. Superoxide dismutase, catalase and glutathione peroxidase activities in human blood: influence of sex, age and cigarette smoking. ClinBiochem. 1997 Aug; 30(6):449-54.
CrossRef - Singh PP, Barjatiya MK. Peroxidative stress and antioxidant status in relation to age in normal population and renal stone formers. Indian J Nephrol 2002; 12: 10-15
- Kaikkonen J, Nyyssoënen K, Tuomainen TP, Ristonmaa U, Salonen JT. Determinants of plasma coenzyme Q10 in humans. FEBS Letters 443 (1999) 163^166
CrossRef - Chen J, Chuang S, Chen H, Yeh W, Pan W. Serum Uric Acid Level as an Independent Risk Factor for All-Cause, Cardiovascular, and Ischemic Stroke Mortality: A Chinese Cohort Study. Arthritis & Rheumatism (Arthritis Care & Research) Vol. 61, No. 2, February 15, 2009, pp 225–232. DOI 10.1002/art.24164 © 2009, American College of Rheumatology
CrossRef - Toaldo IM,Cruz FA,da Silva EL, Bordignon-Luiz MT. Acute consumption of organic and conventional tropical grape juices (Vitislabrusca L.) increases antioxidants in plasma and erythrocytes, but not glucose and uric acid levels, in healthy individuals. Nutr Res. 2016 Aug;36(8):808-17. doi: 10.1016/j.nutres.2016.04.010.
CrossRef - Gutierrez-Mariscal FM, Perez-Martinez P, Delgado-Lista J, Yubero-Serrano EM, Camargo A, Delgado-Casado N et al. Mediterranean diet supplemented with coenzyme Q10 induces postprandial changes in p53 in response to oxidative DNA damage in elderly subjects. AGE (2012) 34:389–403.DOI 10.1007/s11357-011-9229-1
CrossRef - 31.Mulholland CW, Elwood PC, Davis A, Thurnham D, Kennedy O, Coulter J et al. Antioxidant enzymes, inflammatory indices and lifestyle factors in older men: A Cohort analysis J Med 1999;92:579-85.
CrossRef - Mena P, Maynar M, Gutierrez JM. Erythrocyte free radical scavenger enzymes in bicycle professional racers. Adaptation to training. Int J Sports Med 1991; 12:563-6.
CrossRef - 33. Sarmiento A, Diaz-Castro J, Pulido-Moran M, Moreno-Fernandez J, Kajarabille N, Chirosa I et al. Short-term ubiquinol supplementation reduces oxidative stress associated with strenuous exercise in healthy adults: A randomized trial. Biofactors. 2016 May 19. doi: 10.1002/biof.1297
CrossRef - Roberts VH,Smith J,McLea SA, Heizer AB, Richardson JL, Myatt L .Effect of increasing maternal body mass index on oxidative and nitrative stress in the human placenta. Placenta. 2009 Feb;30(2):169-75
CrossRef - Conen D,Wietlisbach V,Bovet P, Shamlaye C, Riesen W, Paccaud F, Burnier M. Prevalence of hyperuricemia and relation of serum uric acid with cardiovascular risk factors in a developing country. BMC Public Health. 2004 Mar 25; 4:9.
CrossRef - Niklowitz P, Fischer A, Onur S, Paulussen M, Menke T, Döring F. Smoking habits and coenzyme Q10 status in healthy European adults. Arch Med Sci 2016; 12, 4: 715–20
CrossRef - Chien KL,Chen MF,Hsu HC, Chang WT, Su TC, Lee YT, Hu FB. Plasma uric acid and the risk of type 2 diabetes in a Chinese community. Clin Chem. 2008 Feb; 54(2):310-6.
CrossRef - Lieber CS, Jones DP, Losowsky MS, Davidson CS. Interrelation of uric acid and ethanol metabolism in man. J Clin Invest. 1962 Oct; 41:1863-70.
CrossRef - Marklund SL, Nilsson P, Israelsson K, Schampi I, Peltonen M, Asplund K. Two variants of extracellularsuperoxide dismutase: relationship to cardiov-ascular risk factors in an unselected middle-aged population. J Intern Med. 1997 Jul; 242(1):5-14.
CrossRef

